. 2024 Jul;25(7):1283-1295.
doi: 10.1038/s41590-024-01858-1. Epub 2024 Jun 11.

IL-12 induces a B cell-intrinsic IL-12/IFNγ feed-forward loop promoting extrafollicular B cell responses

Affiliations

IL-12 induces a B cell-intrinsic IL-12/IFNγ feed-forward loop promoting extrafollicular B cell responses

Rebecca A Elsner et al. Nat Immunol. 2024 Jul.

Abstract

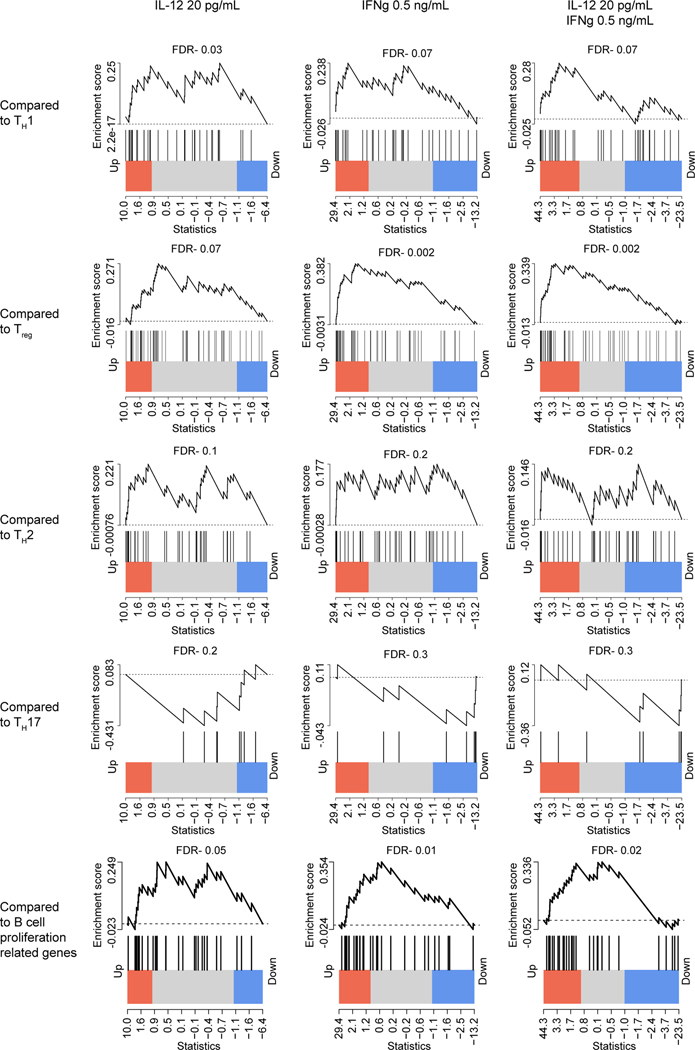
While some infections elicit germinal centers, others produce only extrafollicular responses. The mechanisms controlling these dichotomous fates are poorly understood. We identify IL-12 as a cytokine switch, acting directly on B cells to promote extrafollicular and suppress germinal center responses. IL-12 initiates a B cell-intrinsic feed-forward loop between IL-12 and IFNγ, amplifying IFNγ production, which promotes proliferation and plasmablast differentiation from mouse and human B cells, in synergy with IL-12. IL-12 sustains the expression of a portion of IFNγ-inducible genes. Together, they also induce unique gene changes, reflecting both IFNγ amplification and cooperative effects between both cytokines. In vivo, cells lacking both IL-12 and IFNγ receptors are more impaired in plasmablast production than those lacking either receptor alone. Further, B cell-derived IL-12 enhances both plasmablast responses and T helper 1 cell commitment. Thus, B cell-derived IL-12, acting on T and B cells, determines the immune response mode, with implications for vaccines, pathogen protection and autoimmunity.


Conflict of interest statement

Competing Interests Statement

The authors declare no competing interests.

Figures

Extended Data Fig. 1
IL-12 signaling on either B cells or CD4 T cells is sufficient to suppress GC. a-b, C57Bl/6 mice were infected with STm (Inf, red) or injected with HK bacteria control (Ctl, blue), 3 days later immunized with NP-CGG, and spleens analyzed 12 days later. a, Gating to identify NP-specific (NIP+) germinal center B cells for Figure 1a, example shown is from HK STm control group. b, Comparison of the percentage of NP-specific B cells that are GC phenotype 12 days post NP-CGG immunization. Data are combined from 2 experiments (n=3 Ctl WT, n=9 Ctl KO, n=7 Inf WT, n=10 Inf KO), symbols represent individual mice, bars display mean +/- SD, *p<0.05, **p<0.01, ***p<0.001, ****p<0.0001, P values calculated by one-way ANOVA with Tukey’s multiple comparisons. c-d, Gating scheme used to identify donor derived B cells and germinal centers for Figure 1e-f, example shown is from HK STm control group with WT B cell donor. d, Example upstream gating plots for Figure 1e-f to show gating of donor B cells for CD45.1 and CD45.2 genotypes.
Extended Data Fig. 2
Example calculation for competitive advantage in mixed bone marrow chimeras. a, Example gating scheme to identify resting T cells (CD4+ CD44low PD-1-), resting B cells (CD19+ NIP- CD38high CD95low), and plasmablasts (CD138+ CD44high). Example is from chimera treated with HK-STm and NP-CGG as described in Fig. 2. b, Example FACS plots to be used to demonstrate calculations, same as Figure 2a. Data are summarized below, showing paired comparisons of the CD45.1/CD45.2 ratio for resting T cells or B cells from the same mouse. Data are combined from 2 experiments, n=8 HK, n=9 Inf, n=2 naïve, symbols indicate individual mice, paired two-tailed t-test was used to compare resting T and B cells for each treatment, *p<0.05, **p<0.01, ***p<0.001. c, Example calculation to normalize resting B cell reconstitution on a per mouse basis. Resting B cells show a disadvantage for WT cells (30% WT vs 69% KO) compared to T cells, which show equal competition (48% WT vs 45% KO) after reconstituting irradiated mice with 50%/50% mixture of WT and IL12RKO bone marrow donor cells. Normalization to the resting T ratio gives a value <1 which indicates KO advantage. d, Example calculation normalizing PB to resting B cells to account for WT disadvantage in reconstitution. When accounting for the WT disadvantage of resting B cell reconstitution (30% WT vs 69% KO), PB show WT advantage (44% WT vs 45% KO) giving a normalized value >1 (2.23).
Extended Data Fig. 3
IL-12 promotes both proliferation and differentiation from B cells in vitro. a, Bead purified IL12p40 KO B cells were cultured for 4 days with LPS + recombinant IL-12 at the indicated concentrations, then analyzed by flow cytometry. Gating scheme used for analysis of proliferation and plasmablast (Blimp-1+ CD138+) differentiation among live B cells in Fig. 3a-b. An example of Blimp-1 and CD138 expression among total B cells is shown for reference, and that gate was applied to all VPD peaks individually with examples shown for cells in division peak 1 and 4. In green is an example of FlowJo Proliferation Platform analysis. b, Extended titration of IL-12 on LPS stimulated cells with analysis at 3 and 4 days without Blimp-1 staining. The frequency of live CD138+ VPDlow (excluding undivided cells) was determined by flow cytometry (left), the number of live cells per well were enumerated using trypan blue stain (center), and the two were used to calculate the number of live CD138+ VPDlow cells per well in each condition. Data are individual mice combined from two experiments for n=2 for each culture time point, shown are mean +/- SD. P values calculated by mixed-effects analysis with Dunnett’s multiple comparisons. c-e, Bead purified IL12p40 KO B cells were cultured for 4 days with CpG ODN1826 + recombinant IL-12 and analyzed by flow cytometry. Data are individual mice combined from 2 experiments for n=2, shown are mean +/- SD. c, Example of proliferation dye dilution by histogram overlay, and %Divided and Proliferation index as above, with P value calculated by one-way ANOVA. d, Analysis of differentiation per division number, as described for Figure 3b, with P value calculated by two-way ANOVA and Dunnett’s multiple comparisons comparing each group to 0 pg/mL IL-12. e, example FACS plots of %Blimp-1+ CD138+ cells in indicated culture conditions. For all charts (b, c, d), NS = not significant, *p<0.05, **p<0.01, ***p<0.001, ****p<0.0001.
Extended Data Fig. 4
IL-12 induces B cell production of IFNγ that promotes PB differentiation through autocrine signaling. a, Comparison of WT and IL12p40 KO B cells for Blimp-1+ CD138+ cell differentiation among proliferation peaks after four days of stimulation in the presence of LPS +/- recombinant IL-12, or IL-12 blocking antibody. Data are combined from 3 experiments for a total of n=4 per genotype, symbols indicate the mean +/- SD. Statistical analyses are two-way ANOVA. b-e, Four-day LPS stimulation of bead purified B cells comparing dose titrations of recombinant IL-12 and IFNγ on both IL12p40 KO and IFNγ KO B cells. Data are combined from 3 experiments for n=3 per genotype. All symbols (c,d) represent mean +/- SD. b, Representative FACS plots of proliferation dye dilution between groups. c, Precursor frequency of cells that have divided at least once (%Divided), and d, the average number of divisions of dividing cells (Proliferation index) as calculated by FlowJo proliferation analysis. Statistical analysis (c,d) are two-way ANOVA with Dunnett’s multiple comparison comparing each concentration to controls of 0 pg/mL IL-12 or 0 ng/mL IFNγ and comparing IL12p40 KO cells to IFNγ KO cells. e, Analysis of Blimp-1+ CD138+ cell differentiation among divisions comparing titration of IL-12 (left) or IFNγ (right) on IL12p40 KO (square symbols solid lines) or IFNγ KO (triangle symbols dotted lines) B cells, colors indicate concentrations of indicated cytokines added to cultures. Statistical analysis is two-way ANOVA with Tukey’s multiple comparison. For all charts (a, c, d, e), NS = not significant, *p<0.05, **p<0.01, ***p<0.001, ****p<0.0001.
Extended Data Fig. 5
IL-12 and IFNγ promote proliferation and differentiation of human B cells. a-c, Primary B cells purified from spleens of n=7 individual human organ donors were cultured for 8 days with CpG +/- cytokines or blocking antibodies as indicated. a, Flow cytometry plots demonstrate upstream gating for one donor example. b, Histograms comparing proliferation of treatment groups for each individual donor. c, Analysis of %PB (CD38hi IRF4hi) per division for each individual donor (n=1 each). Statistical comparisons are multiple paired one-tailed t-tests each compared to block/block (gray line), NS = not significant, *p<0.05, **p<0.01, ***p<0.001, ****p<0.0001.
Extended Data Fig. 6
B cell expression of IFNγ receptor, but not T-bet, is necessary for maximal PB response during Salmonella infection. a-d, Additional data described in Fig. 5a, data combined from two experiments, n=11 HK B-WT, n=12 Inf B-WT, n=13 HK B-KO and Inf B-KO. a, NP-specific IgG1 and IgG2b antibody forming cells (AFC), and the sum of IgM+IgG1+IgG2b+IgG2c. Symbols represent individual mice and bars the mean +/-SD, P values calculated by two-tailed t-tests. b, Example gating for IFNγ producing T and B cells (summarized in Fig. 5c). For CD4+ T cells, examples are shown from both infected and HK control mice as different gates for CD44+ cells were necessary. c, Example upstream gating for intracellular IFNgR stain, CD19+ and/or CD138+ gate represents B cells + PB, which is then separated in to “PB” or CD138- cells, and then “GC” and the remainder are called “non-GC/PB” which represents a majority naïve cells. d, Histograms showing selection of Cre-escape cells among PB populations from B-KO mice (filled histograms). e, Additional ELISPOT data as described in Fig. 5e. Data combined from 2 experiments, n=14 (HK B-WT, HK B-KO, Inf B-WT), n=16 Inf B-KO, symbols represent individual mice and bars the mean +/- SD, all P values calculated by two-tailed t-test. f, Histograms showing T-bet expression among cells gated as in panel (c) with CD19+ and/or CD138+ gate. g, Splenocytes from mice treated for 3 days with recombinant IL-12 in vivo (Fig. 2c), were stained for T-bet expression in B cells. A population of T-bet+ IRF4- cells was found to be expanded in IL-12 treated mice. This population (orange) was overlayed on all B cells (gray) to show their CD38 CD95 staining in relation to CD38low CD95hi early GC B cells. FACS plots are representative of n=10 mice per group. h, Proliferation index of in vitro cultured CD19-Cre+/- T-bet flox B cells from Fig. 5i, n=3 biological replicates; symbols are mean +/- SD, analyzed by two-way ANOVA. One of two independent experiments with similar results is shown. i, Representative FACS plots of T-bet staining among CD19-Cre+/- T-bet flox B cells in indicated conditions from Fig. 5i. For all charts (a, e, h), NS = not significant, *p<0.05, **p<0.01, ***p<0.001, ****p<0.0001.
Extended Data Fig. 7
Curated list of DEGs induced by IL-12 and IFNγ treatment. a-d, B cells from n=3 mice were individually bead purified and stimulated with LPS and the indicated concentrations of IL-12, IFNγ, and blocking antibodies for 4 or 24 hours, and RNA was isolated for bulk sequencing. a, Experimental design; all DEG were compared to IL-12 block + IFNγ block condition for their respective time point. b, Venn diagrams comparing up (top) and down (bottom) DEG for 4 hour IFNγ 0.5 ng/mL versus 3 ng/mL both with IL-12 block. c, Venn diagrams comparing (top) down DEG for 4 versus 24 hour IFNγ 0.5 ng/mL (block IL-12), (middle) those plus 24 hr IL-12 20 pg/mL + IFNγ 0.5 ng/mL, (bottom) or all 24 hr groups; IL-12 20 pg/mL (block IFNγ), IFNγ 0.5 ng/mL (block IL-12), or IL-12+IFNγ. d, Heatmap of curated list of top DEG of interest clustered by gene names. Numbers in boxes indicate logFC mean of 3 samples, * indicates significance (FDR < 0.05) of differential regulation compared to control. e, Quantification of IL-12 and IFNγ in culture supernatants from 3 time points. Data are combined from 2 experiments, n=6 biological replicates per condition. Symbols represent the mean +/- SD. Comparisons are one-way ANOVA with Tukey’s multiple comparisons for suboptimal cytokine concentrations, and two-tailed paired t-test comparing LPS only to either IL-12 or IFNγ at sufficient concentrations (200 pg/mL and 10 ng/mL respectively), NS = not significant, *p<0.05.
Extended Data Fig. 8
IL-12 and IFNγ DEG are enriched for TH1, Treg, and B cell proliferation genes. Gene set enrichment analysis (GSEA) plots illustrating significant upregulation of TH1 Treg, and B cell proliferation related genes at 24 hours of IL-12 and IFNγ samples (n = 3) compared with their control conditions. The FDR adjusted P values (FDR) indicated in each chart were calculated using rankSumTestWithCorrelation function from the R limma package.
Extended Data Fig. 9
In vivo B cell derived IL-12 influences both B and T cells, and synergizes with IFNγ signals for maximal PB differentiation. a, Representative FACS plots of B cells from mice treated with PBS or recombinant IL-12 as in Figure 2b, and b, summary data of B cells expressing T-bet and producing IFNγ after IL-12 treatment. Data combined from two experiments, n=10 per group, analyzed by two-tailed t-test. c-i, Additional data related to experiment described in Figure 8c. Data combined from two experiments, n=11 (WT/WT), n=9 (WT/KO), n=11 (KO/WT), n=10 (KO/KO). For e and i, all symbols represent individual mice and bars the mean +/- SD. P values calculated by two-tailed t-tests.c, Gating scheme used to identify donor derived B cells and PB for Figure 8d. Example shown is from the group IL12RKO T cells + WT B cells. d, Example FACS plots of donor derived B cells (TCRb-, CD19+ or CD138+ from either CD45.1 WT or CD45.2 KO gate), donor genotype is indicated above each chart. e, Additional summary from Figure 8d showing the number of CD138+ donor B cells per spleen, and the fold change of IRF4 MFI on PB compared to “naïve” (CD138- CD19+) B cells of the same mouse. f, Gating scheme used to analyze CD4 T cells from donor cells, example mouse received WT T cells and WT B cells. g,h, Representative FACS plots of donor derived T cells showing expression of T-bet+ IFNγ+ Th1 cells in g, and CXCR5high Bcl6high TFH in h and i, Example FACS plots (h), and summary data (i), of the percentage of TFH among donor T cells per mouse. j, Additional analysis of mixed bone marrow chimera mice described in Figure 8h. Fold advantage was calculated for GC B cells compared to resting cells from the same mouse as described in Extended Data 2. Data shown are combined from 2 experiments, (HK: n=12 for IL-12R, n=13 for IFNgR and IL-12R+IFNgR, Inf: n=15 IL-12R, n=16 IFNgR, n=14 IL-12R+IFNgR), symbols represent individual mice and bars the mean +/- SD. Individual groups are tested against the hypothesis of no competitive difference by one sample t-test (two-tailed) compared to a hypothetical value of 1, and compared to each other by two-tailed t-tests. k, Visual representation of the proposed model. Early (4 hours) IL-12 initiates IFNγ production and autocrine IFNγ signals induce expression of genes that both establish negative feedback of IFNγ signaling, and an overlapping positive feedback loop between IL-12 and IFNγ signaling. IFNγ promotes IL-12 signaling by upregulating IL-12 signaling components (IL-12R and STAT4) and STAT1 which IFNγ signals through. At 24 hours, if both IL-12 and IFNγ are present, positive feedback overcomes negative regulation to sustain IFNγ signaling. Additionally, IL-12 and IFNγ synergize to induce genes which are not expressed under either condition alone. For all charts (b, e, i, j), NS = not significant, *p<0.05, **p<0.01, ***p<0.001, ****p<0.0001.
Extended Data Fig. 10
Hypothetical models of synergy. a, Experimental rationale for design of mixed bone marrow chimeras in Fig. 8h, with the null hypothesis being no synergy. b, Proposed model of positive feedback loop, summarizing sequencing results. Upper case protein names refer to protein function, lower case gene names refer to RNA sequencing data. “PROTEIN (Gene)” refers to hypothetical regulatory links between transcription factors and target genes based on existing literature.
Figure 1.
Figure 1.
IL-12 signaling on either B cells or CD4 T cells is sufficient to suppress GC. a-c, B6 or IL12Rb2 KO B6 mice were immunized i.p. with NP-CGG in alum, then 3–4 hours later injected with either heat killed control (HK Ctl) or live Salmonella (infected) i.p., and their splenocytes analyzed 12 days later. Data are combined (n=3 Ctl WT, n=9 Ctl KO, n=7 Inf WT, n=10 Inf KO), from two independent experiments for all but Ctl WT, which was from one experiment and omitted from statistical analysis, as this condition has been previously published. a, Representative psuedoplots pre-gated on [live, singlets, TCRb-], showing gates for NIP+ CD19+ B cells (NP-specific), then CD38low CD95hi GC. Numbers next to gated regions indicate percentages of cells from the parent gate. b, Number of NIP+ GCBC per spleen. P values were calculated by one-way ANOVA with Tukey’s multiple comparisons. c, Number of STm colony forming units (CFU) per spleen. P values were calculated by two-tailed t-test. d, Experimental design for panels e and f. CD4+ T cells and B cells were purified and recombined into 4 mixtures, which were then injected into OTII+/− Rag2KO CD45.1/2 hosts at day −1. Recipients were immunized with NP-CGG and injected with HK Ctl or infected with STm at day 0, and their splenocytes were assessed 12 days later. e-f, Data combined from two experiments (n=8 columns 1,2, n=9 columns 3,4), P values were calculated by one-way ANOVA with Tukey’s multiple comparisons. e, Number of GC per spleen. f, Representative FACS plots pre-gated on [live, singlet, TCRb-, CD19+] and CD45.1/1 or CD45.2/2 to ensure the origin of the B cells, as indicated. For all charts (b, c, e), points represent individual mice and bars the mean +/− SD, NS = not significant, *p<0.05, **p<0.01, ***p<0.001, ****p<0.0001.
Figure 2.
Figure 2.
IL-12 signaling in B cells is necessary and sufficient to promote PB differentiation. a-b, B6 mice with an irrelevant BCR (B18+/− Vk8R+/− CD45.1/2) were irradiated and reconstituted with a mixture of 50% WT CD45.1 and 50% IL12Rb2 KO CD45.2 bone marrow. After 10 weeks, mice were infected with STm or given HK bacteria and 3 days later immunized with NP-CGG, then analyzed at 12 days post NP-CGG immunization. a, Representative FACS plots of reconstitution among resting T cells (CD4+ CD44low), resting B cells (CD19+ CD38hi CD95low CD138- CD44low), and plasmablasts (TCRb- CD138+ CD44hi). Numbers in parentheses are the ratio of %WT/%KO per mouse. b, Ratios of %WT/%KO were used to normalize competitive advantage for each mouse of resting B cells relative to resting T cells (left), and to calculate the competitive advantage for IL12Rb2 expression among PB relative to resting B cells (right). Values >1 indicate the fold-advantage of WT cells. Data are combined from 2 experiments, n=8 HK, n=9 Inf, n=2 naïve. One-way ANOVA was used to compare groups for resting B cells (left), and two-tailed t-test was used to compare HK versus Infected groups for PB competitive advantage. Additionally, one-sample t-tests (two-tailed) are displayed at the top of each chart in parentheses to compare each group individually to the hypothetical value of 1 for “no competitive advantage” (*)p<0.0332, (**)p<0.0021, (***)p<0.0002, (****)p<0.0001). Symbols indicate individual mice, bars the mean +/− SD. c, WT B6 mice were immunized with NP-CGG, then PBS or 800 ng recombinant IL-12 was administered i.v. on days 1, 2, and 3 post immunization. At day 4 splenic antibody secreting cells were quantified by ELISPOT, and the number of NIP+ CD138+ PB and the %IgM+ of CD138+ PB were determined by flow cytometry. Data are combined from two experiments, n=10 per group, P values were calculated by one-tailed t-tests. For all charts (b,c) symbols represent individual mice, bars the mean +/− SD. NS = not significant, *p<0.05, **p<0.01, ***p<0.001, ****p<0.0001.
Figure 3.
Figure 3.
IL-12 promotes both proliferation and differentiation of purified B cells in vitro. a-b, B cells from IL12p40 KO B6 mice were purified by magnetic depletion of unwanted cells, labeled with violet proliferation dye (VPD), and cultured for 4 days with LPS stimulation with graded concentrations of recombinant murine IL-12, then analyzed by flow cytometry. Points and error bars are the mean +/− SD from n=3 mice cultured individually. One experiment representative of three is shown. a, left, an overlay histogram of live singlet B cells from indicated culture conditions. Center: the % of cells that underwent at least one division (%Divided); and right, the average number of divisions of dividing cells (Proliferation index) were calculated with the FlowJo Proliferation Platform. Effect of IL-12 concentration was determined by One-way ANOVA with Dunnett’s multiple comparisons for each point compared to 0 pg/mL IL-12. b, Analysis of the effect of IL-12 on differentiation of cells from a; the number of cell divisions was determined by gating on each proliferation peak, then the % of Blimp-1+ CD138+ cells (plasmablasts) among each division number was plotted. Colors represent individual IL-12 concentrations, and two-way ANOVA with Dunnett’s multiple comparisons was used to compare each concentration to 0 pg/mL IL-12. For all charts, NS = not significant, *p<0.05, **p<0.01, ***p<0.001, ****p<0.0001.
Figure 4.
Figure 4.
IL-12-induced production of IFNγ by B cells promotes PB differentiation via autocrine signaling. a-c, B cells of the indicated genotypes were cultured with LPS +/− recombinant IL-12 for 4 days. Flow cytometry plots show representative samples of IL12p40 KO cells cultured with 0 and 200 pg/mL IL-12, gated on live singlet B cells. Charts to the right show summary data from all genotypes, data are combined from 3 experiments with a total of n=2 IL12p40 KO and STAT4 KO, n=3 WT, IL12Rb2 KO and IFNgR1 KO, symbols indicate the mean +/− SD. Statistical analysis by two-way ANOVA with Tukey’s multiple comparison. a, Quantitation of Blimp-1hi CD138+ PB. b, Quantitation of Blimp-1hi IRF4hi cells. c, Quantitation of Blimp-1lo T-bethi cells. d, B cells of the indicated genotypes were cultured with LPS with dose titrations of recombinant IL-12 (left) and IFNγ (right). Percentages of Blimp-1hi CD138+ PB as gated in a are plotted as a function of cytokine concentration. Data are combined from 3 experiments for n=3 per genotype, symbols indicate the mean +/− SD. Statistical analysis by two-way ANOVA with Dunnett’s multiple comparison. e-f Primary human B cells from n=7 individual organ donors were cultured for 8 days with CpG +/− cytokines or blocking antibodies as indicated. e, Flow cytometry plots show representative analysis from one donor, previously gated on live singlet B cells. Cytokine additions are indicated above each plot. Gates used for quantitation in top panel of f are shown. f, Summary data of CD38hi IRF4hi PB (top) and frequency of cells that had divided more than once (bottom). Dots and lines connect individual donors, data are combined from 2 individual experiments (n=3 or n=4 donors each experiment, n=7 total). Statistical analysis by one-tailed paired t-tests. For all charts (a-d, f), NS = not significant, *p<0.05, **p<0.01, ***p<0.001, ****p<0.0001.
Figure 5.
Figure 5.
Effects of IFNγ responsiveness and T-bet expression on PB responses in vivo and in vitro. a-d, CD19Cre+/− IFNgR1f/f B6 mice (B-KO), or Cre-negative IFNgR1f/f controls (B-WT) were injected with Salmonella (Inf) or heat killed control (HK), immunized 3 days later with NP-CGG, and analyzed 5 days later. Data are combined from 2 experiments, n=11 HK B-WT, n=12 Inf B-WT, n=13 HK B-KO and Inf B-KO. For a-c, symbols represent individual mice and bars the mean +/− SD. P values calculated by two-tailed (a,c) and one-tailed (b) t-test. a, NP-specific IgM and IgG2c antibody forming cells (AFC) per spleen, enumerated by ELISPOT. b, Salmonella colony forming units (CFU) per spleen. c, Number of IFNγ producing CD4 T cells (left) and B cells (right) per spleen. d, The % of B cell subsets escaping CD19Cre deletion was determined by staining for IFNgR expression by flow cytometry. Symbols are mean +/− SD. e-g, The same experiment as in a-d was performed, comparing CD19Cre+/− T-betf/f mice and Cre-negative T-betf/f controls. Data are combined from 2 experiments, n=14 (HK B-WT and B-KO, Inf B-WT), n=16 Inf B-KO, symbols represent individual mice, bars the mean +/− SD, all P values calculated by two-tailed t-test. e, NP-specific IgM and IgG2c AFC per spleen enumerated by ELISPOT. f, Salmonella colony forming units (CFU) per spleen. g, Number of IFNγ-producing CD4 T cells (left) and B cells (right) per spleen. h, Purified B cells from CD19Cre+/− T-betf/f (KO) or Cre-negative controls (WT) were cultured for 4 days with LPS +/− recombinant IL-12, IFNγ, or an IL-12 blocking antibody as indicated, “-“ indicates the cytokine was neither added nor blocked. Shown is differentiation as a function of division number, statistical analysis is two-way ANOVA with Tukey’s multiple comparisons; data shown are mean +/− SD of n=3 mice. One of two independent experiments with similar results is shown. i, Purified B cells from CD19-Cre+/− T-betf/f mice were cultured as in h. Differentiation as a function of division number was compared for n=3; symbols are mean +/− SD, analyzed by two-way ANOVA with Tukey’s multiple comparisons. One of two independent experiments with similar results is shown. For all charts (a-i), NS = not significant*p<0.05, **p<0.01, ***p<0.001, ****p<0.0001.
Figure 6.
Figure 6.
IL-12 and IFNγ synergize to induce proliferation and differentiation at low concentrations, dependent on autocrine cytokine secretion. a-d, Purified B cells from WT, IL12p40 KO, and IFNγ KO mice, were cultured for 4 days with LPS +/− recombinant IL-12, IFNγ, or blocking antibodies, as indicated, “-“ indicates the cytokine was neither added nor blocked. a-b, Statistical analysis by two-way ANOVA with Tukey’s multiple comparisons. Data shown are mean +/− SD; n=4 (block/block and 20/block), n=5 all others, combined from two independent experiments. a, Differentiation as a function of division number. b, The 20 pg/mL IL-12 + 0.5 ng/mL IFNγ conditions from each mouse strain in a are plotted together. c, Representative histograms of VPD dilution on live singlet B cells. d, Summarized proliferation index data, symbols represent cultures from individual mice and bars the mean +/− SD (n=4 (block/block and 20/block), n=5 all others) combined from two independent experiments. Statistical analysis shown is two-tailed t-test. For all charts (a, b, d), NS = not significant, *p<0.05, **p<0.01, ***p<0.001, ****p<0.0001.
Figure 7.
Figure 7.
IL-12 and IFNγ induce distinct changes in gene expression in cultured B cells. a-e, B cells from n=3 WT mice were individually purified and cultured with cytokines and/or blocking antibodies for 4 or 24 hours, as indicated. DEG are determined by comparison to the IL-12-block + IFNγ-block condition for the matched time point control. a, Bar charts of the numbers of DEG (log2FC 1, FDR <0.05), the expression of which is up (orange) or down (blue) relative to control. b, Venn diagrams of up-DEG between IL-12 20 pg/mL only (block IFNγ), IFNγ 0.5 ng/mL only (block IL-12), or IL-12 20 pg/mL + IFNγ 0.5 ng/mL at 4 (left) and 24 (right) hours. c, Curated heat map of DEG, clustered by row. Numbers in boxes are the log2FC of the mean of n=3 replicates. Asterisk next to numbers indicates significance (*FDR<0.05) of differential regulation compared to the control condition. d, Venn diagrams comparing IFNγ 0.5 ng/mL only (block IL-12) at 4 and 24 hours (left), or those plus IL-12 20 pg/mL + IFNγ 0.5 ng/mL at 24 hours. e, X-Y plot comparing DEG at 24 hours of IL-12-block IFNγ 0.5 ng/mL (x-axis) and IL-12 20 pg/mL IFNγ 0.5 ng/mL (y-axis) conditions, to reveal the effects of adding IL-12. Text colors indicate significance with FDR<0.05 for IL-12-block+IFNγ (pink), IL-12+IFNγ (blue), or both conditions (black). f, Quantification of IL-12 and IFNγ from 24 hour culture supernatants. Data are combined from 2 experiments with n=6 biological replicates per condition represented by symbols, and means represented by bars +/− SD. Comparisons are two-tailed paired t-tests.
Figure 8.
Figure 8.
IL-12 secreted from B cells influences both B and T cell differentiation in vivo, synergizing with IFNγ signals. a, Representative FACS plots of B cells [live, singlet, TCRβ- CD45R+], and combined data, from NP-CGG-immunized mice treated with PBS or recombinant IL-12, as described in Figure 2c. Data combined from 2 experiments, n=10 per group, analyzed by two-tailed t-test. b, Quantification of IL-12 and IFNγ from sera of mice given HK or Inf STm for 3 or 7 days. Data combined from 2 experiments, n=6 per group. c-g, Cell intrinsic roles of IL-12R and IL-12p40 expression on T and B cells respectively, in vivo. Data combined from 2 experiments, n=11 (WT/WT), n=9 (WT/KO), n=11 (KO/WT), n=10 (KO/KO), all symbols represent individual mice and bars the mean +/− SD. P values calculated by two-tailed (d and f) and one-tailed (e) t-tests. c, Experimental design: CD4+ T cells and B cells were purified and recombined into 4 combinations and injected into OTII+ Rag2KO hosts on day −1. On day 0 hosts were injected with HK Salmonella, NP-CGG ~3 hours later, and spleens analyzed 4 days later. d, Frequency of PB determined by FACS, and e, AFC quantified by ELISPOT. f, Frequency of indicated T cell populations determined by FACS; and g, representative FACS plots. h, Bone marrow chimeras were reconstituted with 50%/50% mixtures of CD45.1 WT and one of three KO genotypes carrying the CD45.2 marker: IFNgR1 KO, IL12Rb2 KO, or IFNgR1 KO and IL12Rb2 KO (double KO). After reconstitution, mice were injected with HK or Inf Salmonella on day −3, NP-CGG on day 0, and spleen cells analyzed 12 days later. Fold-advantage was calculated as described (Figure 2), values above 1 indicating WT advantage. Data combined from 2 HK experiments (HK: n=12 for IL-12R, n=13 for IFNgR and IL-12R+IFNgR) and 2 Inf experiments (Inf: n=15 IL-12R, n=16 IFNgR, n=14 IL-12R+IFNgR), symbols represent individual mice and bars the mean +/− SD. Individual groups are also tested against the hypothesis of no competitive advantage by one sample t-test (two-tailed) compared to a hypothetical value of 1, (*)p<0.0332, (**)p<0.0021, (***)<0.0002, (****)p<0.0001, and groups compared to each other by two-tailed t-tests. For all charts (a-h), NS = not significant, *p<0.05, **p<0.01, ***p<0.001, ****p<0.0001.

Similar articles

Cited by

References

    1. Elsner RA & Shlomchik MJ Germinal Center and Extrafollicular B Cell Responses in Vaccination, Immunity, and Autoimmunity. Immunity 53, 1136–1150 (2020).PMC7748291. PMID33326765 - PMC - PubMed
    1. Weisel F & Shlomchik M Memory B Cells of Mice and Humans. Annu Rev Immunol 35, 255–284 (2017), PMID28142324 - PubMed
    1. Liu X, Yao J, Zhao Y, Wang J & Qi H Heterogeneous plasma cells and long-lived subsets in response to immunization, autoantigen and microbiota. Nat Immunol 23, 1564–1576 (2022), PMID36316480 - PubMed
    1. Trivedi N et al. Liver Is a Generative Site for the B Cell Response to Ehrlichia muris. Immunity 51, 1088–1101 e1085 (2019).PMC6955021. PMID31732168 - PMC - PubMed
    1. William J, Euler C, Christensen S & Shlomchik MJ Evolution of autoantibody responses via somatic hypermutation outside of germinal centers. Science 297, 2066–2070 (2002), PMID12242446 - PubMed

Methods-only References

    1. Sonoda E et al. B cell development under the condition of allelic inclusion. Immunity 6, 225–233 (1997), PMID9075923 - PubMed
    1. Hoiseth SK & Stocker BA Aromatic-dependent Salmonella typhimurium are non-virulent and effective as live vaccines. Nature 291, 238–239 (1981), PMID7015147 - PubMed
    1. Weisel NM et al. Surface phenotypes of naive and memory B cells in mouse and human tissues. Nat Immunol 23, 135–145 (2022).PMC8712407. PMID34937918 - PMC - PubMed
    1. Dobin A et al. STAR: ultrafast universal RNA-seq aligner. Bioinformatics 29, 15–21 (2013).PMC3530905. PMID23104886 - PMC - PubMed
    1. Liao Y, Smyth GK & Shi W featureCounts: an efficient general purpose program for assigning sequence reads to genomic features. Bioinformatics 30, 923–930 (2014), PMID24227677 - PubMed

MeSH terms