. 2024 Jun 11;7(1):720.
doi: 10.1038/s42003-024-06407-y.

Knockout of the longevity gene Klotho perturbs aging and Alzheimer's disease-linked brain microRNAs and tRNA fragments

Affiliations

Knockout of the longevity gene Klotho perturbs aging and Alzheimer's disease-linked brain microRNAs and tRNA fragments

Serafima Dubnov et al. Commun Biol. .

Abstract

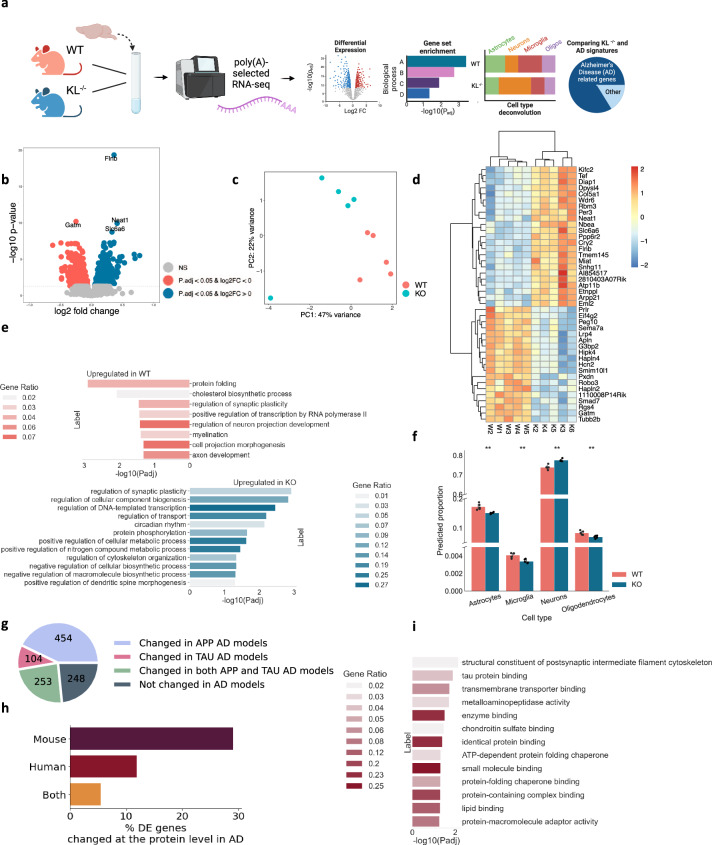
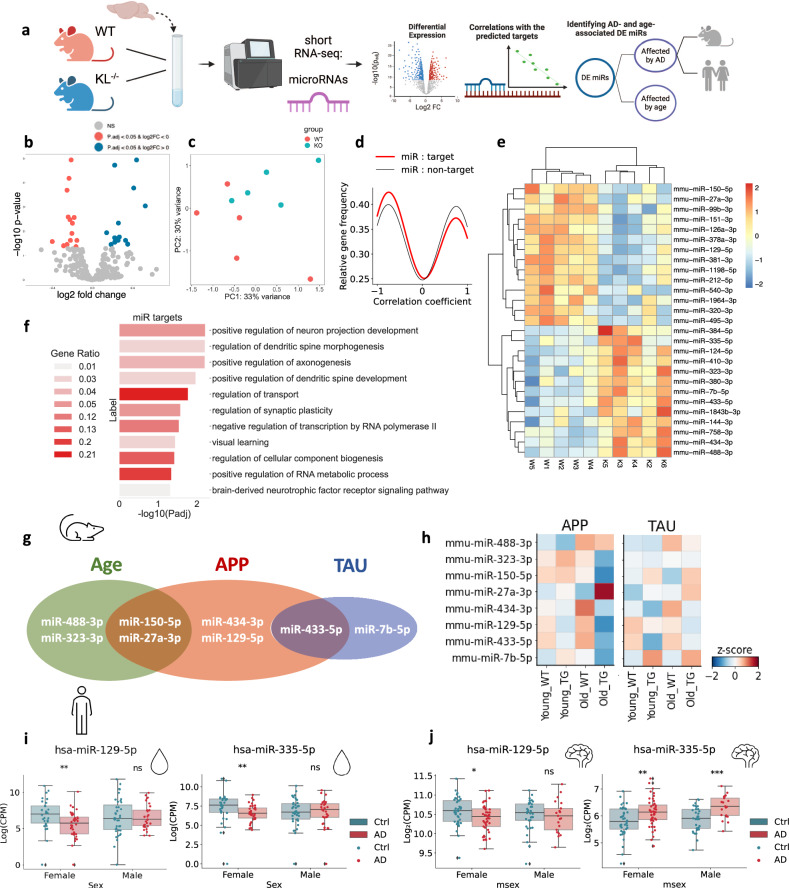
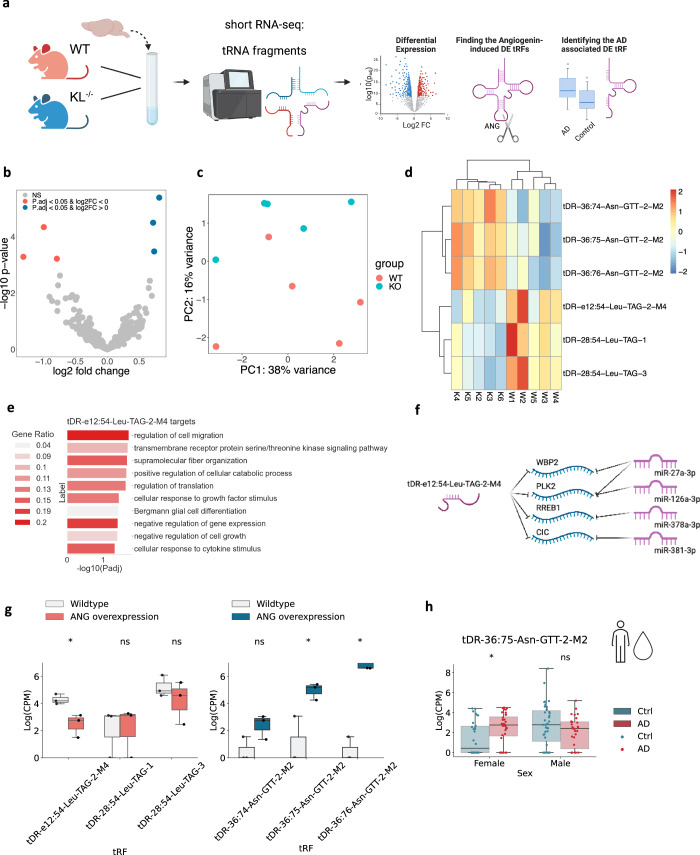
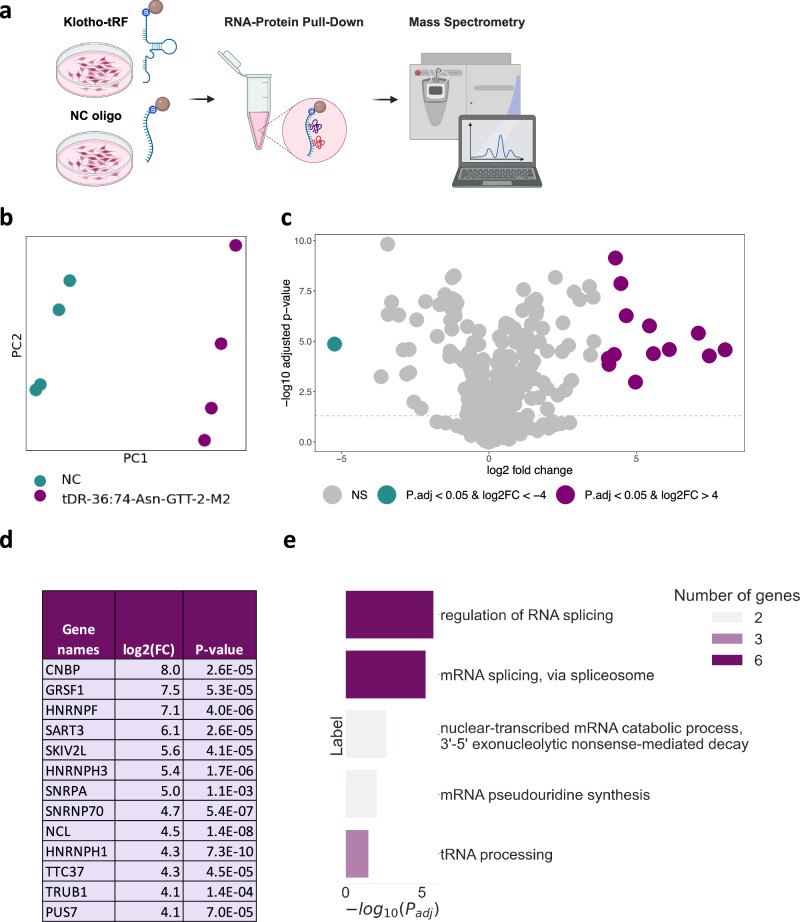
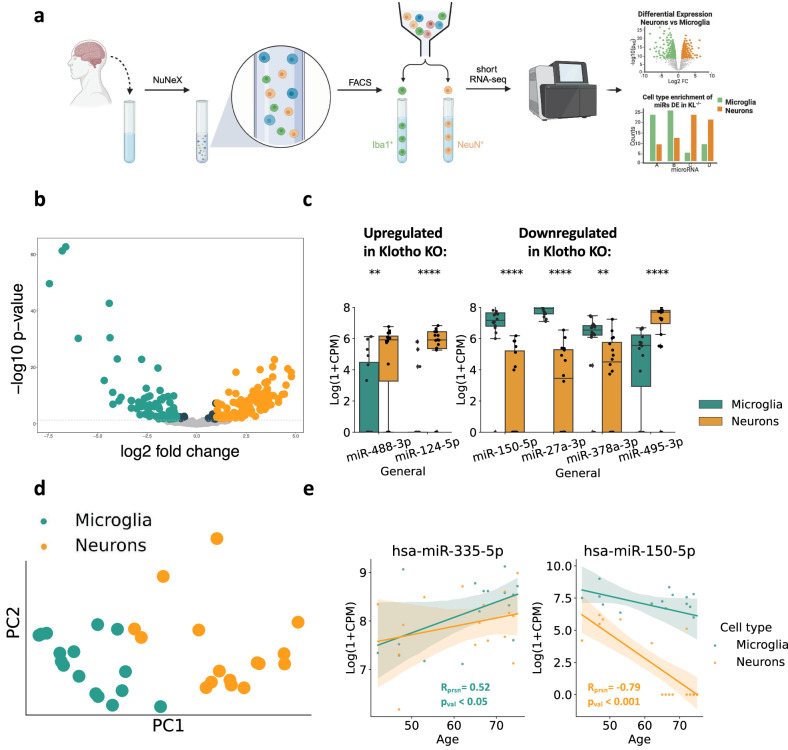
Overexpression of the longevity gene Klotho prolongs lifespan, while its knockout shortens lifespan and impairs cognition via perturbation of myelination and synapse formation. However, comprehensive analysis of Klotho knockout effects on mammalian brain transcriptomics is lacking. Here, we report that Klotho knockout alters the levels of aging- and cognition related mRNAs, long non-coding RNAs, microRNAs and tRNA fragments. These include altered neuronal and glial regulators in murine models of aging and Alzheimer's disease and in human Alzheimer's disease post-mortem brains. We further demonstrate interaction of the knockout-elevated tRNA fragments with the spliceosome, possibly affecting RNA processing. Last, we present cell type-specific short RNA-seq datasets from FACS-sorted neurons and microglia of live human brain tissue demonstrating in-depth cell-type association of Klotho knockout-perturbed microRNAs. Together, our findings reveal multiple RNA transcripts in both neurons and glia from murine and human brain that are perturbed in Klotho deficiency and are aging- and neurodegeneration-related.


Conflict of interest statement

The authors declare no competing interests.

Figures

Fig. 1
Fig. 1. Klotho KO induces numerous long RNA transcriptome changes.
a Graphical representation of the analysis shown in Fig. 1. Created with BioRender.com. b Volcano plot of polyadenylated RNAs DE in murine Klotho-knockout (n = 5) compared to wildtype (n = 5) brains; significantly upregulated transcripts in blue, significantly downregulated transcripts in pink; padj < =0.05. c PCA of polyadenylated RNA reads colored by genotype. d Heatmap showing normalized and centered counts of the most significantly altered transcripts (padj <= 5e-6; colormap - z-score of normalized count levels, centered to the mean). e GO annotation of biological processes enriched in up- and down-regulated transcripts (blue and pink, respectively) under Klotho-knockout. f AutoGeneS prediction of the cell type proportions in WT and KO profiles based on the scRNA-seq atlas; **: pval < 0.01, ns: non-significant. g Pie chart proportions of DE genes in AD studies. h Bar plot showing the percent of DE mRNAs encoding proteins that are altered in a mouse model AD study, in a compilation of human AD proteomic studies and in both. i. GO annotation of molecular functions enriched in protein-coding transcripts whose associated proteins were altered in a compilation of human AD proteomic studies. The error bands denote 95% confidence intervals.
Fig. 2
Fig. 2. Klotho depletion perturbs miR signatures, resembling AD and aging-associated changes.
a Graphical representation of the analysis shown in Fig. 2. Created with BioRender.com. b Volcano plot of miRs DE in Klotho-knockout (n = 5) compared to wildtype (n = 5) mice, significantly upregulated transcripts in blue, significantly downregulated transcripts in pink, padj < =0.05. c PCA based on miR counts and colored by genotype. d Gaussian kernel density estimates of Pearson correlation coefficients between klotho-affected miRs and their targets (red), and klotho-miRs and DE mRNAs which are not their targets (black). X axis: Pearson correlation coefficient. Y axis: relative frequency of miR-mRNA pairs with the corresponding coefficient. e Heatmap showing normalized and centered counts of DE miRs (colormap: z-score of the normalized counts, centered to the mean). f Gene Ontology annotation of miR targets from enriched biological processes. g Venn diagram of DE miRs that co-change in the murine hippocampus with age and/or in one of the AD pathology models (APP - APPswe/PS1L166P; TAU - THY-Tau22). h Scaled heatmap of miR alterations from (G) across age and genotype conditions of both APP and TAU mouse models. i Log2(CPM) counts of hsa-miR-129-5p and hsa-miR-335-5p in CSF from AD patients and cognitively healthy controls, divided by sex (**: padj < 0.01). j Log2(CPM) counts of hsa-miR-129-5p and hsa-miR-335-5p in the nucleus accumbens of AD patients (cogdx=4), compared to cognitively healthy individuals (cogdx=1), divided by sex (**: padj < 0.01). The error bands denote 95% confidence intervals.
Fig. 3
Fig. 3. Klotho knockout alters tRF levels sex-dependently.
a Graphical representation of the analysis shown in Fig. 3. Created with BioRender.com. b Volcano plot of DE tRFs in murine Klotho-knockout (n = 5) compared to wildtype (n = 5) brains; significantly upregulated transcripts in blue, significantly downregulated transcripts in pink; padj < =0.05. c PCA of tRF counts colored by genotype. d Heatmap showing normalized and centered counts of altered tRFs (colormap: z-score of the normalized counts, centered to the mean). e Gene Ontology annotation of biological processes enriched in tDR-36:75-Asn-GTT-2-M2 targets, and negatively correlated with this tRF in Klotho KO data. f Schematically illustrated common targets of tDR-36:75-Asn-GTT-2-M2 and miRs. g Log2(CPM) counts of altered tRFs in HEK293 cells under angiogenin overexpression compared to wildtype; left panel, tRFs decreased, right panel tRFs increased under Klotho KO;.*: padj < 0.1. h Log (CPM) counts of tDR-36:75-Asn-GTT-2-M2 in CSF of AD patients and cognitively healthy controls, divided by sex,*: padj < 0.05. The error bands denote 95% confidence intervals.
Fig. 4
Fig. 4. Pull-down assay revealing that tDR-36:74-Asn-GTT-2-M2 binds multiple proteins involved in splicing, mRNA decay and pseudouridylation.
a Graphical representation of the pull-down experiment: SH-SY5Y cells were plated, harvested after four days, and incubated with magnetic streptavidin beads to which biotinylated tDR-36:74-Asn-GTT-2-M2 (Klotho-tRF) or biotinylated negative control (NC) RNA-oligonucleotides were bound. After wash steps the beads were submitted to mass spectrometry and the proteins bound to each oligonucleotide were identified. Created with BioRender.com. b PCA showing separation of the proteins bound to the tDR-36:74-Asn-GTT-2-M2 (purple) vs. those bound to the NC oligo (green), 4 samples per group. c Volcano plot showing the differentially expressed proteins in biotinylated tDR-36:74-Asn-GTT-2-M2 (n = 4) vs biotinylated NC pulldown samples (n = 4). Proteins significantly upregulated with log2FC > =4 are colored in purple, proteins sinificantly downregulated with log2FC > =-4 are colored in green. The statistical analysis in was performed using the Perseus package. d List of the 13 proteins enriched by log2FC > =4 (16-fold) in tDR-36:74-Asn-GTT-2-M2 vs. NC samples. e Gene Ontology annotation of the biological processes enriched within the differentially expressed proteins in panel D.
Fig. 5
Fig. 5. Klotho KO affects miR levels in both neurons and microglia.
a Graphical representation of the pipeline used to produce bulk cell type-specific short transcriptome datasets of live brain cells. Using the NuNeX protocol, samples extracted during neurosurgeries were broken down to single nuclei surrounded by thin cytoplasm layers. Nuclei stained with microglia- (Iba1) and neuron- (NeuN) specific fluorescent markers were FACS-sorted and short RNA-sequenced. Created with BioRender.com. b Volcano plot showing altered level miRs enriched in neurons (n = 16) in orange or microglia (n = 16) in green. c 6 miRS DE in Klotho KO were also enriched in one of the cell types. Left panel: miRs upregulated in Klotho KO; Right panel: miRs downregulated in Klotho KO, **: padj < =0.01; ****: padj < =0.0001. d PCA of the cell type-specific small transcripts (7 miRs DE in Klotho KO, colored by cell type). e Linear correlation of donor age with log2(CPM) count levels of hsa-miR-335-5p (significantly correlated in microglia) and hsa-miR-150-5p (significantly correlated in neurons), colored by cell type as in panel D. The error bands denote 95% confidence intervals.

Update of

References

    1. Hou Y, et al. Ageing as a risk factor for neurodegenerative disease. Nat. Rev. Neurol. 2019;15:565–581. doi: 10.1038/s41582-019-0244-7. - DOI - PubMed
    1. Kuro-o M. Klotho and aging. Biochim. Biophys. Acta BBA - Gen. Subj. 2009;1790:1049–1058. doi: 10.1016/j.bbagen.2009.02.005. - DOI - PMC - PubMed
    1. Nagai T, et al. Cognition impairment in the genetic model of aging klotho gene mutant mice: a role of oxidative stress. FASEB J. 2003;17:50–52. doi: 10.1096/fj.02-0448fje. - DOI - PubMed
    1. Zhao, Y. et al. Klotho overexpression improves amyloid‐β clearance and cognition in the APP/PS1 mouse model of Alzheimer’s disease. Aging Cell19, e13239 (2020). - PMC - PubMed
    1. Dubal DB, et al. Life Extension Factor Klotho Enhances Cognition. Cell Rep. 2014;7:1065–1076. doi: 10.1016/j.celrep.2014.03.076. - DOI - PMC - PubMed

MeSH terms