. 2024 Oct;45(10):2045-2060.
doi: 10.1038/s41401-024-01275-y. Epub 2024 Jun 11.

Effects of Kv1.3 knockout on pyramidal neuron excitability and synaptic plasticity in piriform cortex of mice

Affiliations

Effects of Kv1.3 knockout on pyramidal neuron excitability and synaptic plasticity in piriform cortex of mice

Yong-Sheng Zhou et al. Acta Pharmacol Sin. 2024 Oct.

Abstract

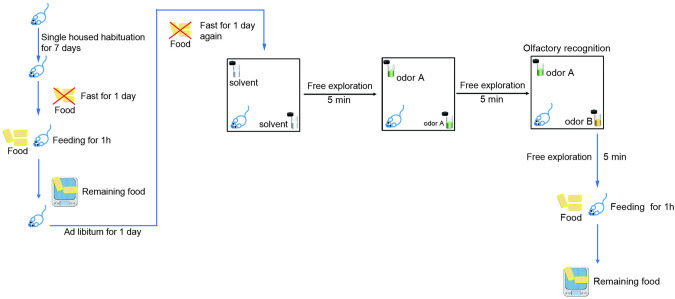
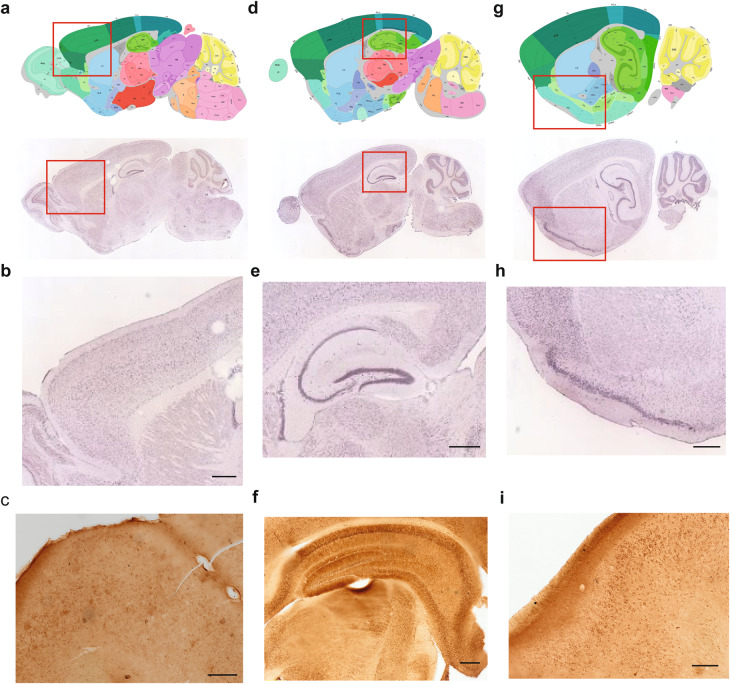
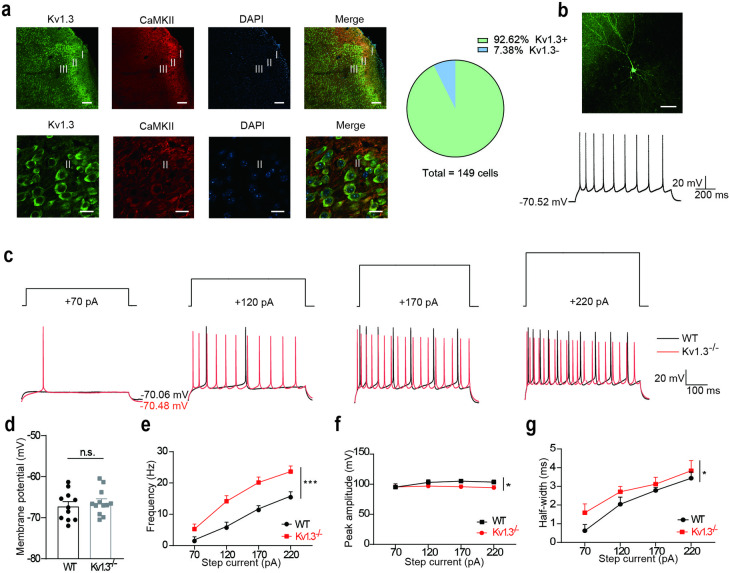
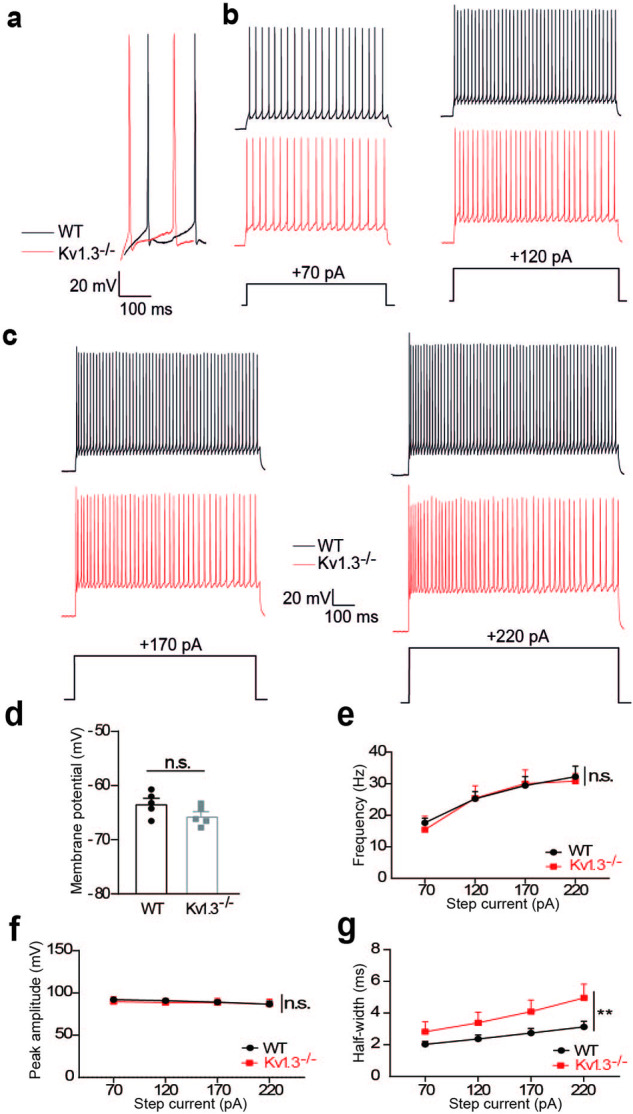
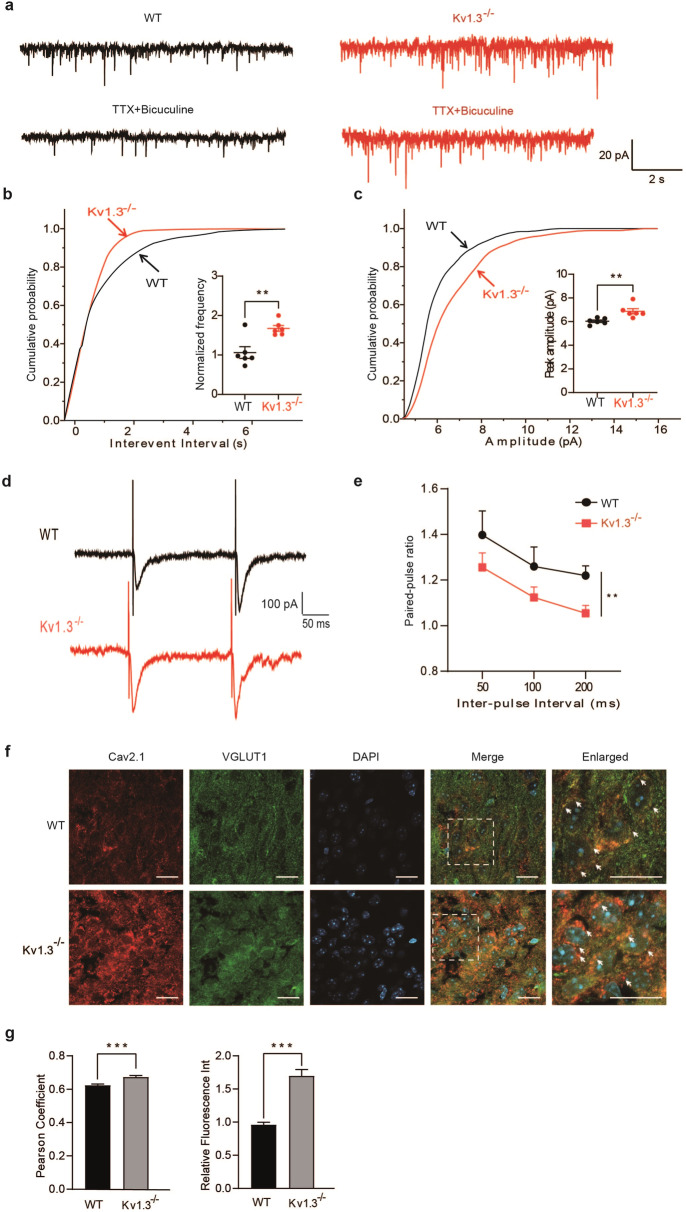
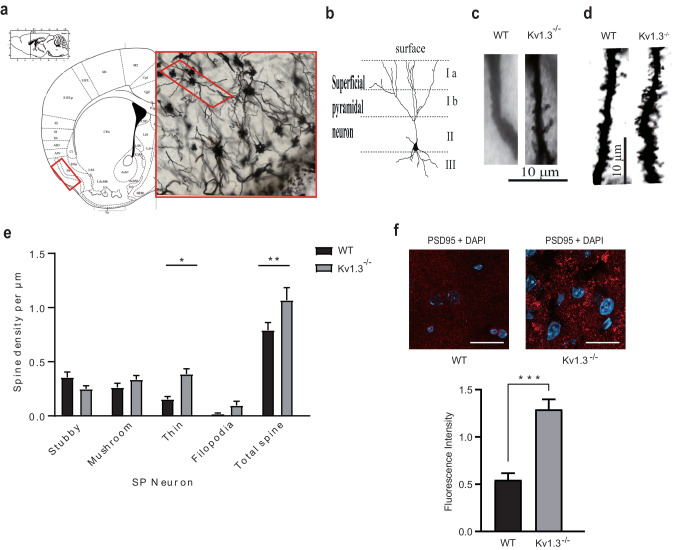
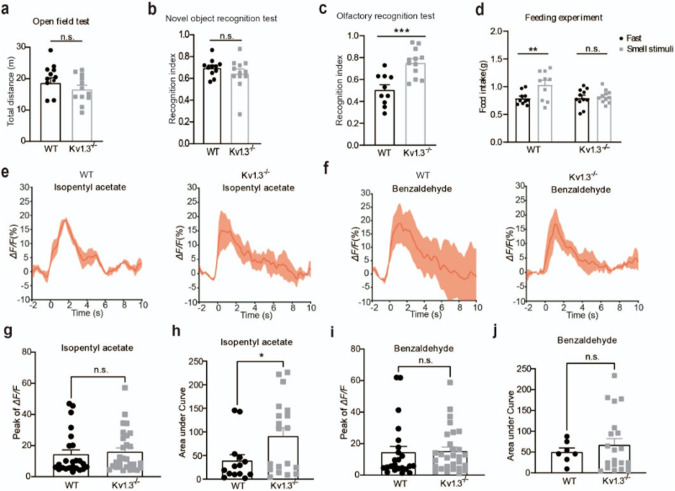
Kv1.3 belongs to the voltage-gated potassium (Kv) channel family, which is widely expressed in the central nervous system and associated with a variety of neuropsychiatric disorders. Kv1.3 is highly expressed in the olfactory bulb and piriform cortex and involved in the process of odor perception and nutrient metabolism in animals. Previous studies have explored the function of Kv1.3 in olfactory bulb, while the role of Kv1.3 in piriform cortex was less known. In this study, we investigated the neuronal changes of piriform cortex and feeding behavior after smell stimulation, thus revealing a link between the olfactory sensation and body weight in Kv1.3 KO mice. Coronal slices including the anterior piriform cortex were prepared, whole-cell recording and Ca2+ imaging of pyramidal neurons were conducted. We showed that the firing frequency evoked by depolarization pulses and Ca2+ influx evoked by high K+ solution were significantly increased in pyramidal neurons of Kv1.3 knockout (KO) mice compared to WT mice. Western blotting and immunofluorescence analyses revealed that the downstream signaling molecules CaMKII and PKCα were activated in piriform cortex of Kv1.3 KO mice. Pyramidal neurons in Kv1.3 KO mice exhibited significantly reduced paired-pulse ratio and increased presynaptic Cav2.1 expression, proving that the presynaptic vesicle release might be elevated by Ca2+ influx. Using Golgi staining, we found significantly increased dendritic spine density of pyramidal neurons in Kv1.3 KO mice, supporting the stronger postsynaptic responses in these neurons. In olfactory recognition and feeding behavior tests, we showed that Kv1.3 conditional knockout or cannula injection of 5-(4-phenoxybutoxy) psoralen, a Kv1.3 channel blocker, in piriform cortex both elevated the olfactory recognition index and altered the feeding behavior in mice. In summary, Kv1.3 is a key molecule in regulating neuronal activity of the piriform cortex, which may lay a foundation for the treatment of diseases related to piriform cortex and olfactory detection.

Keywords: Kv1.3; neuronal excitability; olfactory recognition; piriform cortex; synaptic plasticity.


Conflict of interest statement

The authors declare no competing interests.

Figures

Scheme 1
Scheme 1
The procedures for olfactory recognition and feeding behavior tests.
Scheme 2
Scheme 2
The procedure for Kv1.3 conditional knockdown with adeno-associated virus.
Fig. 1
Fig. 1. Kv1.3 expression pattern in the medial prefrontal cortex, hippocampus and piriform cortex.
a Reference mouse brain atlas (above, mouse.brain-map.org) and KCNA3 mRNA in situ hybridization section (below, mouse.brain-map.org/experiment/show/70723477), including the mPFC, in the Allen Institute database. b Enlarged mPFC area in the red rectangle of Panel a; the black line in the bottom right corner is the scale bar and represents 500 μm. c Immunohistochemistry for Kv1.3 in the mPFC; the scale bar represents 200 μm. d Reference mouse brain atlas and KCNA3 mRNA in situ hybridization section including the hippocampus from the Allen Institute database. e Enlarged hippocampal area in the red rectangle of Panel c; the scale bar represents 500 μm. f Immunohistochemical analysis of Kv1.3 in the hippocampus; the scale bar represents 200 μm. g Reference mouse brain atlas and KCNA3 mRNA in situ hybridization section including the piriform cortex (PC) from the Allen Institute database. h Enlarged PC area in the red rectangle of Panel g; the scale bar represents 500 μm. i Immunohistochemistry for Kv1.3 in PCs; the scale bar represents 200 μm.
Fig. 2
Fig. 2. Effects of Kv1.3 KO on the action potentials of pyramidal neurons in the piriform cortex.
a Immunofluorescence of Kv1.3 and CaMKII expression in the piriform cortex (left) and statistics of the Kv1.3-positive or Kv1.3-negative ratio in CaMKII-expressing neurons; I, II, and III represent the first, second and third layers of the piriform cortex, respectively; for the top panel, the white line in the right bottom corner is the scale bar and represents 200 μm; for the bottom panel, the scale bar represents 20 μm. b Representative pyramidal neuron labeled with biocytin and its action potential in the second layer of the piriform cortex; the scale bar represents 50 μm. c Representative action potentials of wild-type (black) and Kv1.3 knockout (red) mice subjected to different current stimuli; Statistical analysis of the resting membrane potential (d), action potential frequency (e), peak amplitude (f) and half-width (g) of pyramidal neurons (n = 12 for the WT group, n = 11 for the Kv1.3 KO group). The results are expressed as the mean ± SEM and were tested with Student’s t test or two-way ANOVA. *P < 0.05; ***P < 0.001; n.s. not significant.
Fig. 3
Fig. 3. Effects of Kv1.3 KO on action potentials of semilunar cells in the piriform cortex.
a Representative action potential firing in detail for wild-type (black) and Kv1.3 knockout (red) mice subjected to 70 pA current stimulation. b, c Representative action potentials of semilunar cells after stimulation with different currents. Statistical analysis of the resting membrane potential (d), action potential frequency (e), peak amplitude (f) and half-width (g) of semilunar neurons (n = 5 for the WT group, n = 5 for the Kv1.3 group). The results are expressed as the mean ± SEM and were tested with Student’s t test or two-way ANOVA. **P < 0.01; n.s. not significant.
Fig. 4
Fig. 4. Effects of the Kv1.3 blocker PAP-1 on the action potentials of pyramidal neurons in the piriform cortex.
Effects of ACSF (black) and PAP-1 administration (red) on the resting membrane potential (a), action potential frequency (b), peak amplitude (c) and half-width (d) of pyramidal neurons in the piriform cortices of WT mice (n = 5). Effects of ACSF (black) and PAP-1 administration (red) on the resting membrane potential (e), action potential frequency (f), peak amplitude (g) and half-width (h) of pyramidal neurons in the piriform cortices of Kv1.3 KO mice (n = 5). The results are expressed as the mean ± SEM and were tested with Student’s t test or two-way ANOVA. *P < 0.05; **P < 0.01; ***P < 0.001; n.s. not significant.
Fig. 5
Fig. 5. Effects of Kv1.3 KO on Ca2+ signals.
a Representative image of changes in GCaMP6s fluorescence in brain slices from WT and Kv1.3 KO mice; the scale bar represents 50 μm. b Representative traces (left) and statistical results (right) of differences in GCaMP6s fluorescence intensity before and after HK stimulation (n = 40 for the WT group, n = 43 for the Kv1.3 group). Immunoblotting diagrams (c) and statistical results for CaMKII (d left) and p-CaMKII expression (d right). e Immunoblotting diagrams (top) and statistical analysis of PKCα (bottom) protein expression levels (n = 3). f Immunofluorescence of PKCα and Na-K ATPase expression in the piriform cortex; the scale bar represents 20 μm. Statistics for Pearson’s coefficient (g) and relative fluorescence intensity for Kv1.3 compared to Na-K ATPase (h) (n = 9 for the WT group, n = 14 for the Kv1.3 group). The results are expressed as the mean ± SEM and were tested with Student’s t test. *P < 0.05; ***P < 0.001; n.s. not significant.
Fig. 6
Fig. 6. Effects of Kv1.3 KO on the synaptic plasticity of pyramidal neurons in the piriform cortex.
a Representative postsynaptic currents and miniature excitatory postsynaptic currents (mEPSCs) of wild-type (black) and Kv1.3 knockout mice (red). b Representative cumulative probability distribution of interevent intervals and statistical results of mEPSC frequency (n = 6 for the WT group, n = 6 for the Kv1.3 group). c Representative cumulative probability distribution and statistical results of the mEPSC amplitude (n = 6 for the WT group, n = 6 for the Kv1.3 group). d Representative evoked excitatory postsynaptic currents (eEPSCs) recorded with paired stimulation. e Statistical results of the paired-pulse ratio with 50 ms, 100 ms, and 200 ms stimulation intervals (n = 6 for the WT group, n = 8 for the Kv1.3 group). f Immunofluorescence of Cav2.1 and VGLUT1 expression in the piriform cortex; the scale bar represents 20 μm. g Statistics for Pearson’s coefficient (left) and relative fluorescence intensity for Cav2.1 compared to VGLUT1 (right) (n = 33 for the WT group, n = 23 for the Kv1.3 group). The results are expressed as the mean ± SEM and were tested with Student’s t test or two-way ANOVA. **P < 0.01; ***P < 0.001.
Fig. 7
Fig. 7. Effects of Kv1.3 KO on the spine growth of pyramidal neurons.
a Representative image of pyramidal neurons in the piriform cortex. b Reconstruction of pyramidal neurons in the piriform cortex. c Representative first-order dendrites in WT and Kv1.3 KO mice. d Representative second-order dendrites in WT and Kv1.3 KO mice. e Statistical analysis of the spine densities of pyramidal neurons in the piriform cortex (n = 8 for the WT group, n = 8 for the Kv1.3 group). f Representative image (top) and statistical analysis (bottom) of PSD95 immunofluorescence intensity in the piriform cortex (n = 8 for the WT group, n = 23 for the Kv1.3 group); the scale bar represents 20 μm. The results are expressed as the mean ± SEM and were tested with Student’s t test. *P < 0.05; **P < 0.01; ***P < 0.001; n.s. not significant.
Fig. 8
Fig. 8. Effects of Kv1.3 KO on olfactory and feeding behaviors.
a Statistics for total distance traveled by WT and Kv1.3 KO mice in the open field test (n = 11 for the WT group, n = 11 for the Kv1.3 group). b Statistics for the recognition indices of WT and Kv1.3 KO mice in the novel object recognition test (n = 11 for the WT group, n = 11 for the Kv1.3 group). c Statistics for the recognition indices of WT and Kv1.3 KO mice in the olfactory recognition test (n = 11 for the WT group, n = 11 for the Kv1.3 group). d Statistics for the food weights eaten by WT and Kv1.3 KO mice with or without smell stimuli (n = 11 for the WT group, n = 11 for the Kv1.3 group). Representative fluorescence intensity traces of GCaMP6s in WT and Kv1.3 KO after isopentyl acetate (e) or benzaldehyde (f) exposure. g Statistics for the ΔF/F peak during isopentyl acetate exposure (n = 24 for the WT group, n = 24 for the Kv1.3 group). h Statistics for the area under the curve (AUC, %*s) during isopentyl acetate exposure (n = 14 for the WT group, n = 19 for the Kv1.3 group). i Statistics for the peak of ΔF/F during benzaldehyde exposure (n = 11 for the WT group, n = 11 for the Kv1.3 group). j Statistics for the area under the curve (AUC, %*s) during benzaldehyde exposure (n = 7 for the WT group, n = 21 for the Kv1.3 group). The results are expressed as the mean ± SEM and were tested with Student’s t test or one-way ANOVA. *P ≤ 0.05; **P ≤ 0.01; ***P ≤ 0.001; n.s. not significant.
Fig. 9
Fig. 9. Effects of the Kv1.3 inhibitor PAP-1 and conditional knockdown in the piriform cortex on olfactory and feeding behavior.
a Statistics for the recognition indices of the vehicle and PAP-1 intraperitoneally injected groups in the olfactory recognition test (n = 5 for the WT group, n = 6 for the PAP-1 group). b Statistics for the weights of food eaten by the vehicle and PAP-1 intraperitoneal injection groups with or without smell stimuli (n = 5 for the WT group, n = 5 for the PAP-1 group). c Statistics for the recognition indices of the vehicle and PAP-1 cannula-injected groups in the olfactory recognition test (n = 6 for the WT group, n = 6 for the PAP-1 group). d Statistics for the weights of food eaten by the vehicle and PAP-1 cannula injection groups with or without smell stimuli (n = 6 for the WT group, n = 6 for the PAP-1 group). e Confirmation of the Kv1.3 editing efficiency of the sgRNA-expressing plasmid (n = 10 for the Kv1.3+Cas9 group, n = 6 for the Kv1.3+Cas9+sgRNA group). f Representative immunofluorescence images of sections from the control and CRISPR groups; the scale bar represents 20 μm. g Statistics for Kv1.3 immunofluorescence intensity between the control and CRISPR groups (n = 74 for the control group, n = 67 for the CRISPR group). h Statistics for body weight of the control and CRISPR groups (n = 8 for the control group, n = 7 for the CRISPR group). i Statistics for the recognition indices of the control and CRISPR groups in the olfactory recognition test (n = 8 for the control group, n = 7 for the CRISPR group). j Statistics for the weights of food eaten by the control and CRISPR groups with or without smell stimuli (n = 8 for the control group, n = 7 for the CRISPR group). The results are expressed as the mean ± SEM and were tested with Student’s t test or one-way ANOVA. *P ≤ 0.05; ***P ≤ 0.001; n.s. not significant.
Scheme 3
Scheme 3
The mechanisms of neuronal excitability changes in Kv1.3 knockout mice.

References

    1. Kim DM, Nimigean CM. Voltage-gated potassium channels: a structural examination of selectivity and gating. Cold Spring Harb Perspect Biol. 2016;8:a029231. - PMC - PubMed
    1. Veh RW, Lichtinghagen R, Sewing S, Wunder F, Grumbach IM, Pongs O. Immunohistochemical localization of five members of the Kv1 channel subunits: contrasting subcellular locations and neuron-specific co-localizations in rat brain. Eur J Neurosci. 1995;7:2189–205. - PubMed
    1. Zhao W, Chen Y. Progress in research of KV1.1 and KV1.3 channels as therapeutic targets. Curr Top Med Chem. 2016;16:1877–85. - PubMed
    1. Guan D, Lee JC, Tkatch T, Surmeier DJ, Armstrong WE, Foehring RC. Expression and biophysical properties of Kv1 channels in supragranular neocortical pyramidal neurones. J Physiol. 2006;571:371–89. - PMC - PubMed
    1. He S, Shao LR, Rittase WB, Bausch SB. Increased Kv1 channel expression may contribute to decreased sIPSC frequency following chronic inhibition of NR2B-containing NMDAR. Neuropsychopharmacology. 2012;37:1338–56. - PMC - PubMed

Substances

LinkOut - more resources