. 2024 Jun 11;31(1):62.
doi: 10.1186/s12929-024-01051-4.

Adipocyte pyroptosis occurs in omental tumor microenvironment and is associated with chemoresistance of ovarian cancer

Affiliations

Adipocyte pyroptosis occurs in omental tumor microenvironment and is associated with chemoresistance of ovarian cancer

Chang-Ni Lin et al. J Biomed Sci. .

Abstract

Background: Ovarian carcinoma (OC) is a fatal malignancy, with most patients experiencing recurrence and resistance to chemotherapy. In contrast to hematogenous metastasizing tumors, ovarian cancer cells disseminate within the peritoneal cavity, especially the omentum. Previously, we reported omental crown-like structure (CLS) number is associated with poor prognosis of advanced-stage OC. CLS that have pathologic features of a dead or dying adipocyte was surrounded by several macrophages is well known a histologic hallmark for inflammatory adipose tissue. In this study, we attempted to clarify the interaction between metastatic ovarian cancer cells and omental CLS, and to formulate a therapeutic strategy for advanced-stage ovarian cancer.

Methods: A three-cell (including OC cells, adipocytes and macrophages) coculture model was established to mimic the omental tumor microenvironment (TME) of ovarian cancer. Caspase-1 activity, ATP and free fatty acids (FFA) levels were detected by commercial kits. An adipocyte organoid model was established to assess macrophages migration and infiltration. In vitro and in vivo experiments were performed for functional assays and therapeutic effect evaluations. Clinical OC tissue samples were collected for immunochemistry stain and statistics analysis.

Results: In three-cell coculture model, OC cells-derived IL-6 and IL-8 could induce the occurrence of pyroptosis in omental adipocytes. The pyroptotic adipocytes release ATP to increase macrophage infiltration, release FFA into TME, uptake by OC cells to increase chemoresistance. From OC tumor samples study, we demonstrated patients with high gasdermin D (GSDMD) expression in omental adipocytes is highly correlated with chemoresistance and poor outcome in advanced-stage OC. In animal model, by pyroptosis inhibitor, DSF, effectively retarded tumor growth and prolonged mice survival.

Conclusions: Omental adipocyte pyroptosis may contribute the chemoresistance in advanced stage OC. Omental adipocytes could release FFA and ATP through the GSDMD-mediate pyroptosis to induce chemoresistance and macrophages infiltration resulting the poor prognosis in advanced-stage OC. Inhibition of adipocyte pyroptosis may be a potential therapeutic modality in advanced-stage OC with omentum metastasis.

Keywords: Adipocyte pyroptosis; Chemoresistance; Inflammation; Omentum metastasis; Ovarian cancer.


Conflict of interest statement

The authors declare that they have no competing interests.

Figures
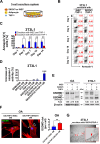
Fig. 1
Fig. 1
Pyroptotic cell death occurrence in adipocytes was observed in the 3-cell coculture system. A A cartoon diagram shows the 3- cell coculture system, including ovarian cancer cell (SKOV3) or normal epithelial cell (iNEC), adipocyte (primary culture omental adipocyte, OA or differentiated 3T3L1 adipocyte cells (3T3L1) and THP-1 macrophage (THP-1), which mimic the omental tumor microenvironment. B, C When cocultured with ovarian cancer SKOV3, the 3T3L1 adipocytes developed less apoptosis, compared to coculture with normal epithelial cell iNEC. By PI, Annexin V staining, the percentage of apoptotic 3T3L1 adipocytes increased to 27.12% when coculture with iNEC/THP-1 cells, while only 2.50% when coculture with SKOV3/THP-1 cells at Day 7. The quantification results in different days were shown in (C). D The increase of caspase-1 activity of 3T3L1 adipocytes was significantly higher when 3T3L1 adipocytes treated with SKOV3/3T3L1/THP-1 3-cell coculture condition medium (CM) than those with other condition medium. E The expression level of cleaved-GSDMD in adipocytes was obviously increased when cocultured with SKOV3. The expression of cleaved-GSDMD in OA, 3T3L1 adipocytes was 5.56-fold and 2.30-fold when cocultured with THP-1/SKOV3 cells than cultured alone; the expression of cleaved-GSDMD in OA, 3T3L1 adipocytes was 2.1-fold in OA and 1.19-fold in 3T3L1 adipocytes when coculture with THP-1/iNEC cells. The molecular weight of cleaved-GSDMD in OA cells from human is 37 kDa, in 3T3L1 adipocytes cells from mice is 35 kDa. F By GSDMD (in green) and Phalloidin (in red) immunofluorescence double staining in OA, the confocal image analysis showed more GSDMD yellow dots (arrow head) on the cell membrane of OA when treated with OA/THP-1/SKOV3 CM compared with OA/THP-1 /iNEC CM, (GSDMD dots per cell, mean: 2.55 vs. 1.23, p < 0.01 ). G Transmission electron microscopy (TEM) images showed some GSDMD-formed pores (arrow head, pore diameter less than 30 μm) in the 3T3L1 adipocyte cell membrane after coculture with SKOV3/THP-1 cells. ∗p < 0.05; ∗∗p < 0.01; ∗∗∗p < 0.001
Fig. 2
Fig. 2
IL-6, IL-8 were abundantly in 3-cell coculture system and associated with adipocyte pyroptosis. A By cytokine arrays analysis, the IL-6, IL-8 and CCL5 levels in mediums from OA/THP-1/SKOV3, 3T3L1/THP-1/SKOV3 coculture were increased. B Expression of IL-6, IL-8 and CCL5 by quantitative PCR in SKOV3, THP-1 and OA, 3T3L1 adipocyte cells in different culture condition. The results showed an increase in the IL-6 expression level of 3.99-fold, IL-8 expression level of 3.81-fold in SKOV3 cells, and the CCL5 expression level of 15.07-fold in THP-1 cells in 3-cell coculture than cells in culture alone. The expression levels of IL-6, IL-8 and CCL5 were all reduced in OA, 3T3L1 adipocyte after 3-cell coculture than cells in culture alone. C In ELISA analysis, the concentrations of IL-6 (mean: 370.36 pg/ml) and IL-8 (mean: 208.93 pg/ml) in OA/THP-1/SKOV3 CM were significantly higher than that in OA/THP-1/iNEC CM. Also, the levels of IL-6 (mean: 63 pg/ml) and IL-8 (mean: 189 pg/ml) in 3T3L1/THP-1/SKOV3 CM were significantly higher than that in 3T3L1/THP-1/iNEC CM. D Both OA, 3T3L1 adipocyte cells increased caspase-1 activity when treated with IL-6, IL-8, ovarian cancer patient ascites or 3T3L1/THP-1/SKOV3 CM at 3, 7 days compared to no treatment. After 3 days treatment, in OA, caspase-1 activity increased 40.63% after treated with ascites from ovarian cancer patient, increased 20.78% after IL-6 (370 pg/ml) treatment, increased 17.37% after IL-8 (209 pg/ml) treatment and increased 20.90% after combined IL-6 and IL-8 treatment. In 3T3L1 adipocytes, the caspase-1 activity increased 44.31% after 3T3L1/THP-1/SKOV3 CM treatment, increased 25.48% after IL-6 (63 pg/ml) treatment, increased 19.17% after IL-8 (189 pg/ml) treatment and increased 25.2% after combined IL-6 and IL-8 treatment. E The NLRP3/caspase-1/GSDMD pathway was activated by increased cleavage -form of GSDMD in OA and 3T3L1 adipocytes after 3 day treatment with ascites, 3T3L1/THP-1/SKOV3 CM, IL-6, IL-8 or combined IL-6 and IL-8 treatment. The OA treated with OC patient’s ascites, 3T3L1 adipocytes treated with 3T3L1/THP-1/SKOV3 CM, respectively were as a positive control. ∗p < 0.05; ∗∗p < 0.01; ∗∗∗p < 0.001
Fig. 3
Fig. 3
ATP released from adipocytes during pyroptosis induces macrophages migration to adipose tissue. A, B In the adipocyte organoid model, the number of infiltrated THP-1-RFP cells (red color) in 3T3L1-GFP spheres (green color) was significantly increased when treated with 3T3L1/THP-1/SKOV3 CM compared to treated with 3T3L1/THP-1/iNEC CM. Two-dimension view as XY view, three-dimension view as XYZ view which were cumulated from serial section of the adipocyte sphere at 1 μm at Z stack. The quantification of THP-1-RFP cells (red color) from XYZ view was showed in (B) with the mean values: 184 infiltrated macrophages when treated with 3T3L1/THP-1/iNEC CM vs. 51 infiltrated macrophages when treated with T3L1/THP-1/SKOV3 CM. C The ATP level in 3T3L1/THP-1/SKOV3 CM was significantly higher than in 3T3L1 adipocytes CM (1.00-fold) or in 3T3L1/THP-1/iNEC CM (2.4-fold) by luminescent ATP assay. D For determining the source of ATP in CM, OA, 3T3L1 adipocytes, THP-1 macrophages and SKOV3 cells were treated with IL-6, IL-8 or combination. After IL-6 or IL-8 or combination treatment, only adipocytes, i.e. OA or 3T3L1 adipocytes, the ATP level in CM were significantly increase. For SKOV3 or THP-1 macrophages, the ATP levels in CM were without change. E For macrophages cell migration assays, the number of migrated THP-1 macrophages cells was significantly increased after 3T3L1/THP-1/SKOV3 CM treatment (mean value: 150 cells), ATP (100 µM) treatment (mean value: 124 cells) and combination treatment (mean value: 280 cells), as compare with no treatment (mean value: 67 cells). F The mean number of migrated THP-1 macrophages cells was reduced from 134 to 33 after GSDMD inhibitor, DSF (0.3 µM) treatment. ∗p < 0.05; ∗∗p < 0.01; ∗∗∗p < 0.001
Fig. 4
Fig. 4
FFA released from adipocytes via pyroptosis contributes to invasion and chemoresistance of OC. A The FFA in 3T3L1/THP-1/SKOV3 CM was significantly elevated than that in 3T3L1 adipocytes CM or 3T3L1/THP-1/iNEC CM (2.79-fold vs. 1.00-fold vs. 1.18-fold). B The FFA in 3T3L1 adipocytes CM with IL-6, IL-8 co-treatment was significantly elevated than that with no treatment (4.27-fold vs. 1.0-fold), with IL-6 (2.33-fold) or IL-8 treatment (1.81-fold). C The lipid in SKOV3 cells significantly increased after 3T3L1/THP-1/SKOV3 CM treatment and decreased by FFA uptake inhibitor, SSO treatment. By Oil Red O staining, the area of positive stain in five hundred SKOV3 cells was significantly increased when treated with 3T3L1/THP-1/SKOV3 CM than those without CM (16.6% vs. 8.31%), while the area of positive stain decrease to 10.81% by SSO (100 µM ) treatment. D Increased SKOV3 FFA uptakes with 3T3L1/THP-1/SKOV3 CM, increases SKOV3 invasion ability. The mean number of invaded cells was significantly increased in SKOV3 after 3T3L1/THP-1/SKOV3 CM treatment as compared with control (90 cells vs. 36 cells), while the mean number of invaded cells was reduced to 57 cells when treated with SSO (100 µM). E Increased SKOV3 FFA uptakes with 3T3L1/THP-1/SKOV3 CM, increases SKOV3 cell chemoresistance. By MTT assays, the IC50 of cisplatin in SKOV3 cells was 2.47 µM but increased to 26.12 µM when treatment with 3T3L1/THP-1/SKOV3 CM. However, the IC50 of cisplatin in SKOV3 decreased to 8.12 µM when added with SSO (100 µM). F The chemoresistance of SKOV3 cultured in OC patient’s ascites or 3T3L1/THP-1/SKOV3 CM is associated involved fatty acid oxidation through elevated CPT1B expression. By Western blot analysis, the expressions of acetylated-STAT3, and CPT1B of SKOV3 cell treated with OC patient’s ascites or 3T3L1/THP-1/SKOV3 CM were increased, while reduced the expression after added with SSO (100 µM), i.e. CPT1B expression from 6.09-fold reduced to 4.85-fold in ascites cultured; 5.50-fold reduced to 4.51-fold in 3T3L1/THP-1/SKOV3 CM cultured. FFA released from adipocytes via pyroptosis contributes to invasion and chemoresistance of OC. G The DSF inhibits the NLRP3/caspase-1/GSDMD pathway of OA cultured in patient ascites and 3T3L1 adipocytes cells cultured in 3T3L1/THP-1/SKOV3 CM. The cleaved form of GSDMD was reduced from 13.81-fold to 4.56-fold in OA cells; from 16.22-fold to 3.15-fold in 3T3L1 cells by treated with DSF (0.3 µM). H DSF reversed fatty acid oxidation-related CPT1B expression of SKOV3 cell cultured in 3T3L1/THP-1/SKOV3 CM. The CPT1B expression was reduced from 5.37-fold to 1.34-fold by treated with DSF (0.3 µM). I The invaded SKOV3 cells significantly reduced by treated with DSF (0.3 µM) as compared without DSF treatment (mean invaded cells: 63 vs. 44 cells). J The FFA level in 3T3L1/THP-1/SKOV3 CM was significant decreased from 2.61-fold to 1.77-fold by treated with DSF (0.3 µM). K The SKOV3 cells did not occur pyroptosis by treated with cisplatin as no increase of cleaved form GSDMD. The breast cancer cell line, MDA-MB-231 as positive control for pyroptosis of cleaved form GSDMD
Fig. 5
Fig. 5
GSDMD-mediated pyroptosis in OC omental adipocyte causes chemoresistance and patient poor outcome. A The ascitic IL-6 (mean: 407.90 pg/ml) and IL-8 (mean: 214.80 pg/ml) in OC patients (n = 18) were higher than those in patients with benign disease (n = 21) (mean of IL-6 = 10.11 pg/ml; mean of IL-8 = 5.71 pg/ml). B The ascitic ATP level in OC patients (n = 18) (mean RLU = 0.0351) was significantly higher than that in patients with benign disease (n = 21) (mean RLU = 0.0071). C CD68 (+) macrophages in omental adipose tissue showed a positive correlation with the ascitic ATP level in OC patients (n = 18, r2 = 0.4500, p = 0.0023). D, E The level of ascitic FFA in OC patients (n = 18) (mean: 4.94 nM) was significantly higher than that in patients with benign disease (n = 21) (mean: 2.16 nM). CD36, as a receptor of FFA in OC cells, showed a positive correlation with the ascitic FFA concentration (r2 = 0.4873, p = 0.0013). Moreover, OC patients with high concentration of FFA in ascites was associated with chemoresistance (p = 0.0478) than those with low concentration of FFA in ascites. F In advanced-stage OC patients (n = 97), patient with chemoresistance (n = 36) had higher GSDMD expression in omental adipocytes than those with chemosensitive (n = 61) (10.19% vs. 4.29% area) (p = 0.0025). G For survival analysis, advanced-stage OC patient with high GSDMD expression in omental adipocytes carried a poor progression-free survival than those with low MSDMD expression (p = 0.0001)
Fig. 6
Fig. 6
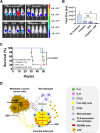
Inhibition of omental adipocyte pyroptosis is a potential therapeutic strategy in advanced-stage OC. A, B In the mouse model, tumor growth was retarded by cisplatin, DSF or combination treatment, especially DSF and cisplatin combination treatment. Quantification of the IVIS level at day 28 after tumor inoculation is shown in (B). C Survival analysis of the mice showed that inhibition of omental adipocyte pyroptosis prolonged survival in treated with DSF alone (survival rate = 60%) or combined with DSF and cisplatin treatment (survival rate = 80%). D Schematic representation of the proposed model for adipocyte pyroptosis in the omental TME of OC.

Similar articles

Cited by

References

    1. Marchetti C, De Felice F, Romito A, Iacobelli V, Maria Sassu C, Corrado G, Ricci C, Scambia G, Fagotti A. Chemotherapy resistance in epithelial ovarian cancer: mechanisms and emerging treatments. Semin Cancer Biol. 2021;77:144–66. doi: 10.1016/j.semcancer.2021.08.011. - DOI - PubMed
    1. Tan DS, Agarwal R, Kaye SB. Mechanisms of transcoelomic metastasis in ovarian cancer. Lancet Oncol. 2006;7(11):925–34. doi: 10.1016/S1470-2045(06)70939-1. - DOI - PubMed
    1. Nieman KM, Kenny HA, Penicka CV, Ladanyi A, Buell-Gutbrod R, Zillhardt MR, Romero IL, Carey MS, Mills GB, Hotamisligil GS, et al. Adipocytes promote ovarian cancer metastasis and provide energy for rapid tumor growth. Nat Med. 2011;17(11):1498–503. doi: 10.1038/nm.2492. - DOI - PMC - PubMed
    1. Germain N, Dhayer M, Boileau M, Fovez Q, Kluza J, Marchetti P. Lipid metabolism and resistance to Anticancer Treatment. Biology (Basel) 2020;9(12):474. doi: 10.3390/biology9120474. - DOI - PMC - PubMed
    1. Liang YL, Lin CN, Tsai HF, Wu PY, Lin SH, Hong TM, Hsu KF. Omental Macrophagic Crown-like structures are Associated with Poor Prognosis in Advanced-Stage Serous Ovarian Cancer. Curr Oncol. 2021;28(5):4234–46. doi: 10.3390/curroncol28050359. - DOI - PMC - PubMed