. 2024 Jun 11;19(1):47.
doi: 10.1186/s13024-024-00738-4.

Single molecule array measures of LRRK2 kinase activity in serum link Parkinson's disease severity to peripheral inflammation

Affiliations

Single molecule array measures of LRRK2 kinase activity in serum link Parkinson's disease severity to peripheral inflammation

Yuan Yuan et al. Mol Neurodegener. .

Abstract

Background: LRRK2-targeting therapeutics that inhibit LRRK2 kinase activity have advanced to clinical trials in idiopathic Parkinson's disease (iPD). LRRK2 phosphorylates Rab10 on endolysosomes in phagocytic cells to promote some types of immunological responses. The identification of factors that regulate LRRK2-mediated Rab10 phosphorylation in iPD, and whether phosphorylated-Rab10 levels change in different disease states, or with disease progression, may provide insights into the role of Rab10 phosphorylation in iPD and help guide therapeutic strategies targeting this pathway.

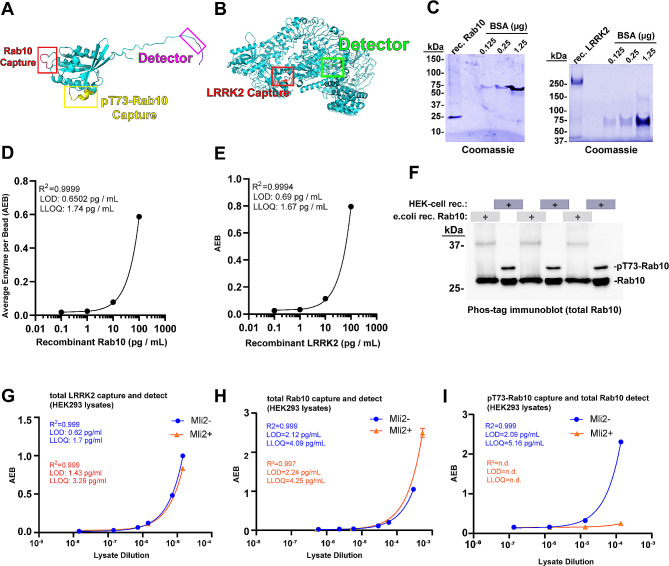
Methods: Capitalizing on past work demonstrating LRRK2 and phosphorylated-Rab10 interact on vesicles that can shed into biofluids, we developed and validated a high-throughput single-molecule array assay to measure extracellular pT73-Rab10. Ratios of pT73-Rab10 to total Rab10 measured in biobanked serum samples were compared between informative groups of transgenic mice, rats, and a deeply phenotyped cohort of iPD cases and controls. Multivariable and weighted correlation network analyses were used to identify genetic, transcriptomic, clinical, and demographic variables that predict the extracellular pT73-Rab10 to total Rab10 ratio.

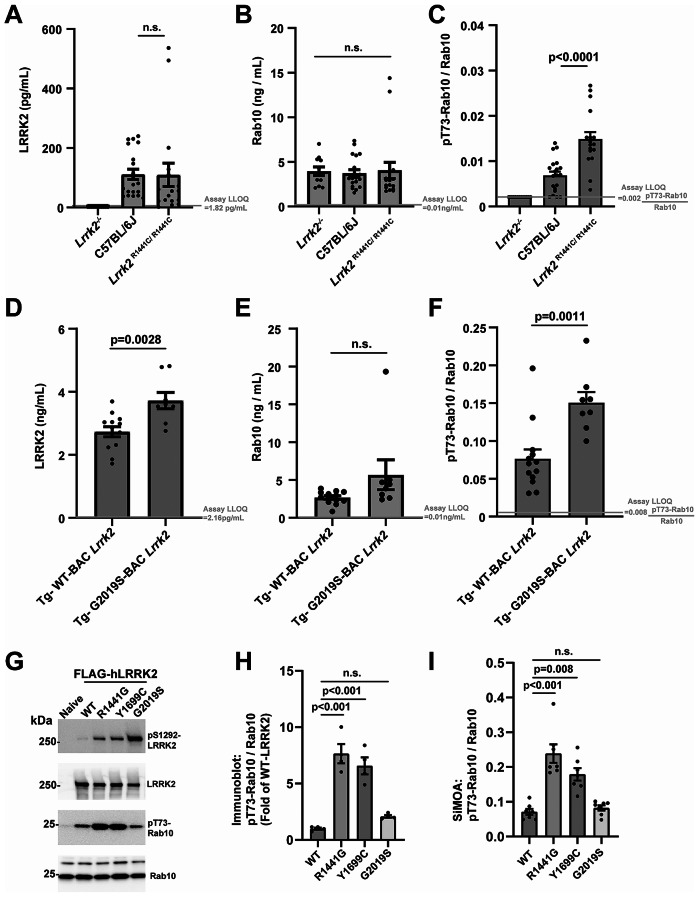
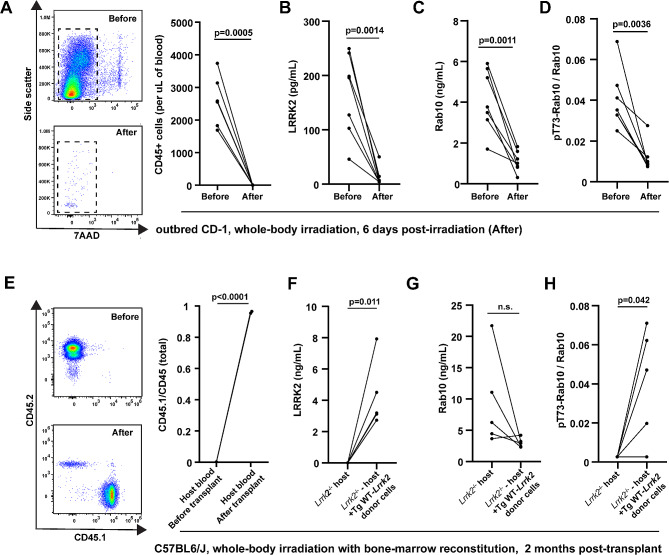
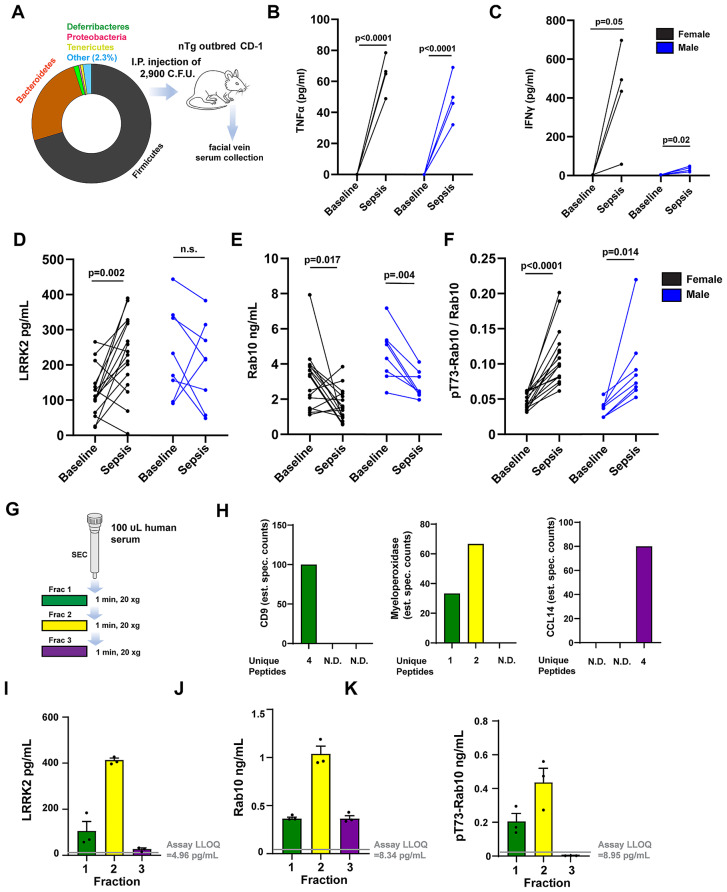
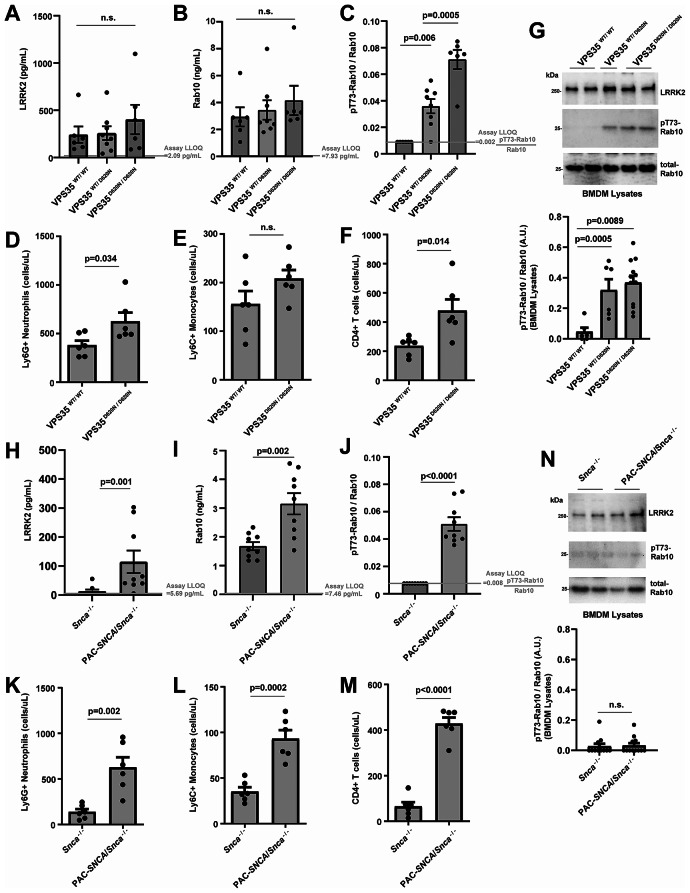
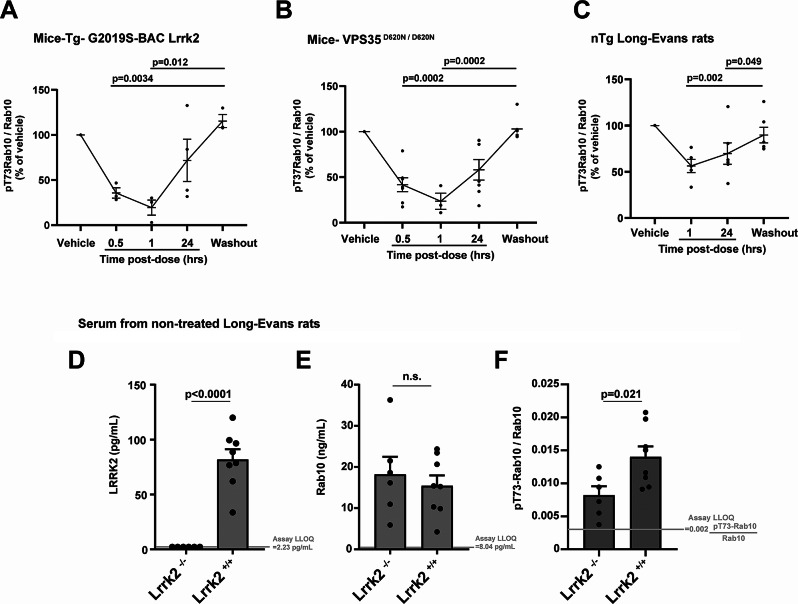
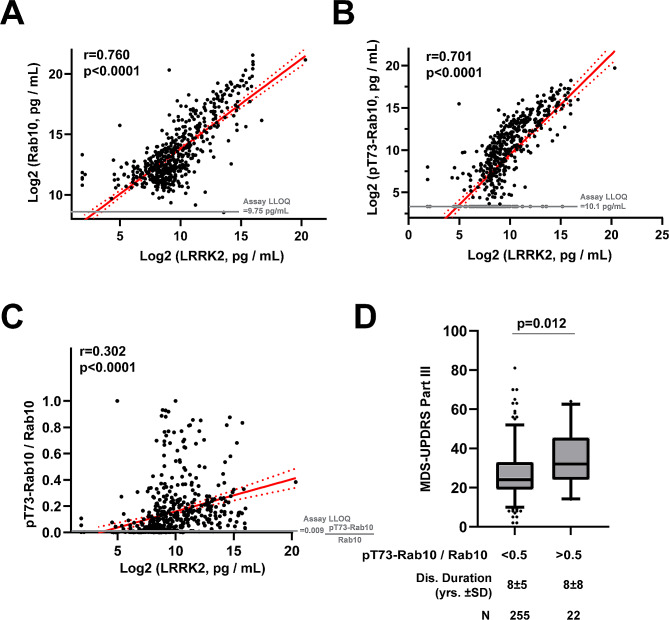
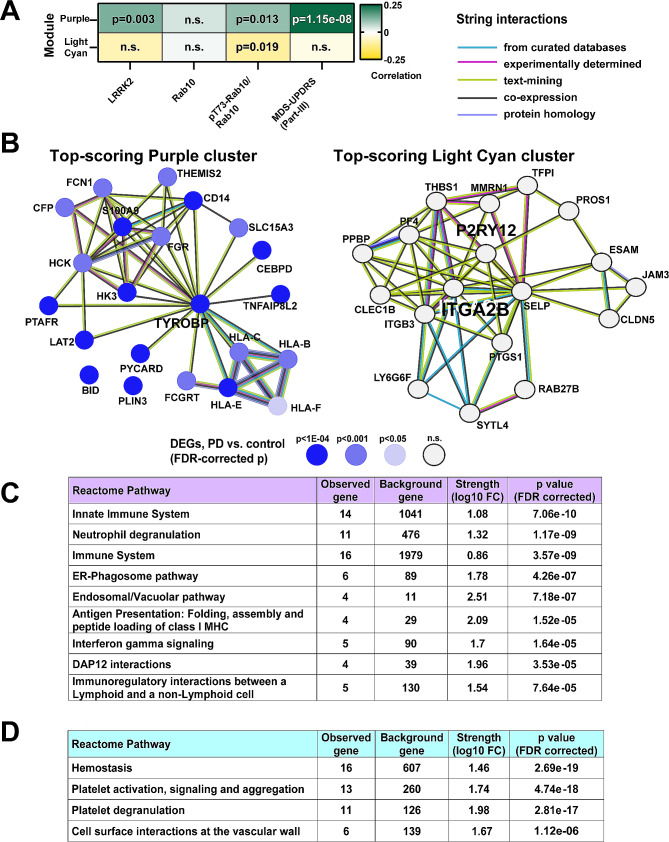
Results: pT73-Rab10 is absent in serum from Lrrk2 knockout mice but elevated by LRRK2 and VPS35 mutations, as well as SNCA expression. Bone-marrow transplantation experiments in mice show that serum pT73-Rab10 levels derive primarily from circulating immune cells. The extracellular ratio of pT73-Rab10 to total Rab10 is dynamic, increasing with inflammation and rapidly decreasing with LRRK2 kinase inhibition. The ratio of pT73-Rab10 to total Rab10 is elevated in iPD patients with greater motor dysfunction, irrespective of disease duration, age, sex, or the usage of PD-related or anti-inflammatory medications. pT73-Rab10 to total Rab10 ratios are associated with neutrophil degranulation, antigenic responses, and suppressed platelet activation.

Conclusions: The extracellular serum ratio of pT73-Rab10 to total Rab10 is a novel pharmacodynamic biomarker for LRRK2-linked innate immune activation associated with disease severity in iPD. We propose that those iPD patients with higher serum pT73-Rab10 levels may benefit from LRRK2-targeting therapeutics that mitigate associated deleterious immunological responses.

Keywords: Blood-based biomarkers; Inflammation; Neurodegeneration; Single-molecule array assays; Transcriptomic analysis.


Conflict of interest statement

A.B.W. has served as a member of The Michael J. Fox Executive Foundation (MJFF) Scientific Advisory Board and is a paid consultant for SciNeuro, Inc, and has been a paid consultant for EscapeBio Inc.; and has received research grants from Biogen Inc. and EscapeBio, Inc., as well as MJFF, ASAP Foundation, Parkinson’s Foundation, and the National Institutes of Health (NIH). A.B.W. is part owner of a series of LRRK2 kinase inhibitors (WO 2013166276) and part owner of induced-pluripotent stem cell lines of early-onset PD distributed by Cedars Sinai. L.H.S. is on the Scientific Advisory Board of Lucy Therapeutics. D.G.S. is a member of the faculty of the University of Alabama at Birmingham and is supported by endowment and University funds. Dr. Standaert is an investigator in studies funded by Abbvie, Inc., the American Parkinson Disease Association, the Michael J. Fox Foundation for Parkinson Research, The National Parkinson Foundation, Alabama Department of Commerce, Alabama Innovation Fund, Genetech, the Department of Defense, and the NIH. He has a clinical practice and is compensated for these activities through the University of Alabama Health Services Foundation. He serves as Deputy Editor for the journal Movement Disorders and is compensated for this role by the International Parkinson and Movement Disorders Society. He has served as a consultant for or received honoraria from Abbvie Inc., Alnylam Pharmaceutics, Appello, Biohaven Pharmaceuticals, Inc., BlueRock Therapeutics, Coave Therapeutics Curium Pharma, F. Hoffman-La Roche, Eli Lilly USA, Sanofi-Aventis, and Theravance, Inc. He has also received book royalties from McGraw-Hill Publishers. T.A.Y. has active grants from the American Parkinson Disease Association, Travere Therapeutics, and the NIH (RF1NS115767-A1, R01NS112203, P50NS108675, U01NS104326, R13GM109532, T32GM008361). T.A.Y. serves on the Scientific Advisory Board for Parkinson’s Foundation. TAY has received honorarium for presentations and panels from the Movement Disorders Society and for grant reviews from NIH. She has a U.S. Patent #7,919,262 on the use of 14-3-3s in neurodegeneration.

Figures

Fig. 1
Fig. 1
Development of sensitive single-molecule array assays and standards for fluid measures of total LRRK2, total Rab10, and pT73-Rab10. (A) AlphaFold structure of Rab10 and (B) LRRK2. Specific epitopes selected for the quantification of total LRRK2, total Rab10, and pT73-Rab10. The assay for Rab10 and pT73-Rab10 share the same detector antibody on the C-terminus but differ in capture antibody epitopes. (C) Representative SDS-PAGE gels with Coomassie stain (blue) for the quantification of recombinant His-Rab10 (derived from E. coli cells) and FLAG-G2019S-LRRK2 (derived from HEK-293T cells). Recombinant bovine-serum albumin standards are shown. (D) Representative regression curves for the measurement of recombinant Rab10 and (E) recombinant LRRK2 in the assay buffer. Goodness-of-fit (r-squared), limit-of-detection (LOD), and lower-limit of quantification (LLOQ) are indicated and calculated from duplicate and triplicate values for each assay point. (F) Representative phos-tag immunoblot analysis showing the proportion of Rab10 protein phosphorylated in protein lysates. HEK-293T lysates were generated through transient transfection of plasmids expressing FLAG-R1441G-LRRK2 with human FLAG-Rab10. The ratio of pT73-Rab10 to total Rab is calculated from three independent preparations as 15.2% ± 0.9% SEM. Protein preparations analyzed by phos-tag analysis are utilized as standards for single-molecule arrays (SiMOA). (G) Representative regression curves for the analysis of LRRK2, (H) Rab10, and (I) pT73-Rab10, as measured in diluted (sample buffer) HEK-293T protein lysates. Prior to lysis, cells were treated with MLi2 (200 nM, 30 min, red dots and lines) or vehicle (blue dots and lines). Assay quality parameters (orange font) are indicated based on triplicate values. Error bars for experimental replicates are typically less than 5% and too short to be visualized graphically in most of the plots
Fig. 2
Fig. 2
LRRK2 mutations increase the extracellular ratio of pT73-Rab10 to total Rab10 as measured with single-molecule array assays (SiMOA) in serum. (A) Levels of total LRRK2, (B) total Rab10 and (C) the ratio of pT73-Rab10 to total Rab10 as measured by SiMOA in venous mouse serum from Lrrk2−/− (8 males and 3 females), non-transgenic C57BL6/J (12 males and 8 females), and knockin Lrrk2R1441C/R1441C mice (9 males and 8 females). (D-F) A cohort of transgenic Tg-WT-BAC Lrrk2 (4 males and 9 females) and Tg-G2019S-BAC Lrrk2 mice (5 males and 3 females) were also analyzed for these markers. In these strains, no differences were noted between males and females. Ages in both cohorts of the mice ranged from 3–6 months. (G) Representative immunoblots of lysates from HEK-293T cells transfected with FLAG-LRRK2 plasmids 24-hours before harvesting lysates. (H) Quantification of endogenous pT73-Rab10 to total Rab10 ratio. (I) SiMOA assay analysis of the lysates for the ratio of pT73-Rab10 to total Rab10. Dots show mean values calculated from independent experiments. Columns show group means, error bars show SEM, and p values are determined with two-tailed t-tests, or from one-way ANOVA followed by Tukey’s post-hoc test in the graphs with more than two groups
Fig. 3
Fig. 3
Serum LRRK2 and pT73-Rab10 proteins originate primarily from bone marrow immune cells. (A) Representative cytographs and column graphs showing the analysis of live (7AAD- 7-Aminoactinomycin D negative) leukocytes in blood from outbred male CD-1 mice before and six-days after 11 grays of radiation. (B) SiMOA analysis of serum from these mice for (B) total LRRK2, (C) total Rab10 and (D) the ratio of pT73-Rab10 to total Rab10. (E) Cytographs show the analysis of host CD45.2 and donor CD45.1 mice before and after radiation, and the column graph shows the mean of the ratio of CD45.1 cells to total CD45 cells (n = 3 male mice). Bone marrow transplantation of donor Tg-WT-Lrrk2 cells into host Lrrk2−/− mice restores levels of (F) total LRRK2, (G) total Rab10 and (H) the ratio of pT73-Rab10 to total Rab10. Each dot shows mean values from the analysis of a single animal (all ~ 2 months of age), and p values are calculated from paired (before and after) sample t-tests
Fig. 4
Fig. 4
Sepsis increases the extracellular ratio of pT73-Rab10 to total Rab10 in serum that primarily localizes to exosome-enriched serum fractions. (A) Microbe profile of cecal slurry generated from healthy CD-1 outbred male mice. Percentages of phylum-level taxonomy, identified by 16S rRNA amplicon sequencing, are depicted with the “Other” category including Actinobacteria, Cyanobacteria, and Verrocomicrobia. Slurries were injected intraperitoneally into a cohort of outbred male (n = 8) and female (n = 16) CD-1 mice, with serum procured from facial vein draws. At the 8 hr time point after injection, 4 female and 4 male mice were selected at random to measure serum (B) interferon-γ (IFNγ) and (C) TNF with ELISA analysis. (D) Before and after graphs show changes in serum LRRK2 levels, (E) total Rab10 and (F) the ratio of pT73-Rab10 to total Rab10 72 hrs post-injection. P values shown are from paired samples (before and after) t-tests. (G) Procedure for “Exo-Spin Serum mini columns’’ size-exclusion fractionation of 100 microliters of human serum spread into fractions 1–3. (H) Proteomic analysis of eluted fractions via mass spectrometry assessments of the relative abundance of unique peptides associated with characteristic serum exosome proteins CD9 (plasma-membrane protein enriched in exosomes and extracellular vesicles), myeloperoxidase (a soluble myeloid-cell produced enzyme enriched in exosomes and extracellular vesicles), and a small soluble cytokine HCC-1 (CCL14). (I) Column graphs show levels of LRRK2, (J) Rab10, (K) and pT73-Rab10 as measured in three different human biobanked serum samples (one male and one female with PD, and one healthy control). Green bars are measured from fraction one, yellow bars are fraction two, and purple are fraction three. Columns show group mean and error bars show SEM
Fig. 5
Fig. 5
The ratio of pT73-Rab10 to total Rab10 in serum is elevated in mouse models of late-onset PD. (A) Levels of total LRRK2, (B) total Rab10 and (C) the ratio of pT73-Rab10 to total Rab10 as measured by SiMOA in venous serum from VPS35WT/WT (2 males and 4 females) mice, VPS35WT/D620N (4 males and 4 females) mice, and VPS35D620N/D620N (6 males) mice. (D) Graphs show numbers of neutrophils (CD11b + Ly6G+), (E) classical monocytes (CD11b + Ly6G- Ly6C+), and (F) CD4 T-cells measured by flow cytometry in VPS35WT/WT and VPS35D620N/D620N serum samples. (G) Representative immunoblots and quantification of cultured bone marrow derived macrophages demonstrating elevated pT73-Rab10 to total Rab10 levels with mutant VPS35 expression. (H) Levels of total LRRK2, (I) total Rab10 and (J) the ratio of pT73-Rab10 to total Rab10 from Snca−/− (3 males and 6 females) mice, and PAC-SNCA/Snca−/− (5 males and 4 females) mice. (K) Graphs show numbers of neutrophils (CD11b + Ly6G+), (L) classical monocytes (CD11b + Ly6G- Ly6C+), and (M) CD4 T-cells measured by flow cytometry in Snca−/− and PAC-SNCA/Snca−/− mice blood. (N) Representative immunoblots and quantification of cultured bone marrow-derived macrophages demonstrating low but equivalent pT73-Rab10 to total Rab10 between Snca−/− and PAC-SNCA/Snca−/− mice. Mouse ages ranged from 3–6 months. Columns depict group mean, dots represent the mean values from an animal or independent experiment, and error bars show SEM. P values are from two-tailed t-tests or one-way ANOVA analysis with Tukey’s multiple comparison when three groups are tested
Fig. 6
Fig. 6
The ratio of pT73-Rab10 to total Rab10 in serum is pharmacodynamic. In mice and rats, the LRRK2 small molecule inhibitor PFE-360 was given as a single oral dose (10 mg per kg), serum (mouse facial vein or rat lateral saphenous vein) collected one-hour after a vehicle-only administration (Vehicle), and serum next collected at the indicated time post-drug administration, with a final collection at 48 h after drug (Washout). The ratio of pT73-Rab10 to total Rab10 diminishes relative to baseline in (A) Tg-G2019S-BAC-Lrrk2 (4 male mice) and (B) VPS35D620N/D620N (7 male mice), as well as (C) nTg Long-Evans Lrrk2+/+ rats (7 male rats). Rodent ages were 3–5 months, bars show group means, error bars show SEM, and dots show the mean values from individual rodents. In repetitive venous draws, some samples were not successfully collected due to insufficient volume collected or hemolysis, thereby excluding the sample for analysis (see Additional File S3 for all raw data collected). Bars in panels A-C show group mean, error bars show SEM, and p values were calculated from one-way ANOVA analysis with Tukey’s post-hoc comparisons. (D) Graphs show levels of LRRK2, (E) Rab10, and (F) the ratio of pT73-Rab10 to total Rab10 in Long-Evans Lrrk2−/− rats (3 males and 3 females) compared to non-transgenic Long-Evans Lrrk2+/+ rats (4 males and 4 females). Columns in panels D-E show group mean, error bars show SEM, and p values are from two-tailed t-test
Fig. 7
Fig. 7
LRRK2 protein levels predict pT73-Rab10 levels that are elevated in PD cases with worse MDS-UPDRS scores. (A) Scatter plots show relationships between measured serum levels of total Rab10 and LRRK2, (B) pT73-Rab10 and LRRK2, and (C) the ratio of pT73-Rab10 to Rab10 and LRRK2. N = 522 cases and controls (see Table 1). R values show correlation coefficients and p values correspond to mean linear regression analysis of lines (red) with 95% confidence intervals shown (red dashed curves). (D) Box and whisker plot comparing the mean MDS-UPDRS part III scores in PD cases split to lower (< 0.5) and higher (> 0.5) ratios of pT73-Rab10/Rab10. P value indicated is from a Mann-Whitney U test for comparisons of groups with unequal sizes
Fig. 8
Fig. 8
The ratio of pT73-Rab10 to total Rab10 in serum, and MDS-UPDRS III scores, are associated with myeloid cell activation and antigenic responses. (A) A weighted gene co-expression network analysis (WGCNA) identifies 27 gene modules of densely co-expressed genes (see Supplemental Fig. S6 for hierarchical clustering). Two modules, Purple and Light Cyan, are significantly correlated with the ratio of pT73-Rab10 to total Rab10. Pearson’s correlation coefficients and associated p values are additionally shown for correlation to LRRK2 protein levels in serum and MDS-UPDRS-III scores. (B) Top-scoring StringDB protein-protein interaction clusters from Purple and Light Cyan modules are shown. Differentially expressed genes (DEGs) in PD subjects vs. control are indicated from DESeq2 negative binomial fit, with level of significance (Benjamini-Hochberg adjusted p values) shown with a blue gradient. (C) All terms from the Reactome Pathway database (FDR-corrected p-value cutoff 1 × 10− 4) are listed. Top process terms from Purple (N = 290 searchable genes) and (D) Light Cyan (N = 102 searchable genes) are shown. All terms with a p < 0.05 cutoff from multiple databases are listed in Supplemental Material 3

Update of

Similar articles

Cited by

References

    1. Wszolek ZK, Pfeiffer B, Fulgham JR, Parisi JE, Thompson BM, Uitti RJ, et al. Western Nebraska family (family D) with autosomal dominant parkinsonism. Neurology. 1995;45:502–5. doi: 10.1212/WNL.45.3.502. - DOI - PubMed
    1. Saunders-Pullman R, Mirelman A, Alcalay RN, Wang C, Ortega RA, Raymond D, et al. Progression in the LRRK2-Asssociated Parkinson Disease Population. JAMA Neurol. 2018;75:312–9. doi: 10.1001/jamaneurol.2017.4019. - DOI - PMC - PubMed
    1. Lake J, Reed X, Langston RG, Nalls MA, Gan-Or Z, Cookson MR, et al. Coding and noncoding variation in LRRK2 and Parkinson’s Disease Risk. Mov Disord. 2022;37:95–105. doi: 10.1002/mds.28787. - DOI - PMC - PubMed
    1. Bryant N, Malpeli N, Ziaee J, Blauwendraat C, Liu Z, AMP PD, Consortium, et al. Identification of LRRK2 missense variants in the accelerating medicines partnership Parkinson’s disease cohort. Hum Mol Genet. 2021;30:454–66. doi: 10.1093/hmg/ddab058. - DOI - PMC - PubMed
    1. West AB, Schwarzschild MA. LRRK2-Targeting therapies March through the Valley of Death. Mov Disord. 2023. p. 361–5. - PMC - PubMed

Substances