. 2024 Jun 11;22(1):321.
doi: 10.1186/s12964-024-01693-9.

Motor skill learning modulates striatal extracellular vesicles' content in a mouse model of Huntington's disease

Affiliations

Motor skill learning modulates striatal extracellular vesicles' content in a mouse model of Huntington's disease

Júlia Solana-Balaguer et al. Cell Commun Signal. .

Abstract

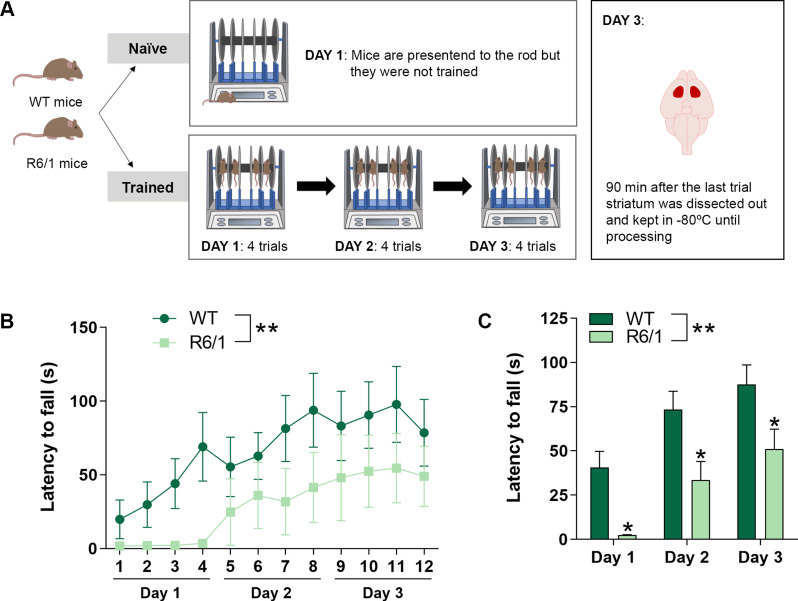
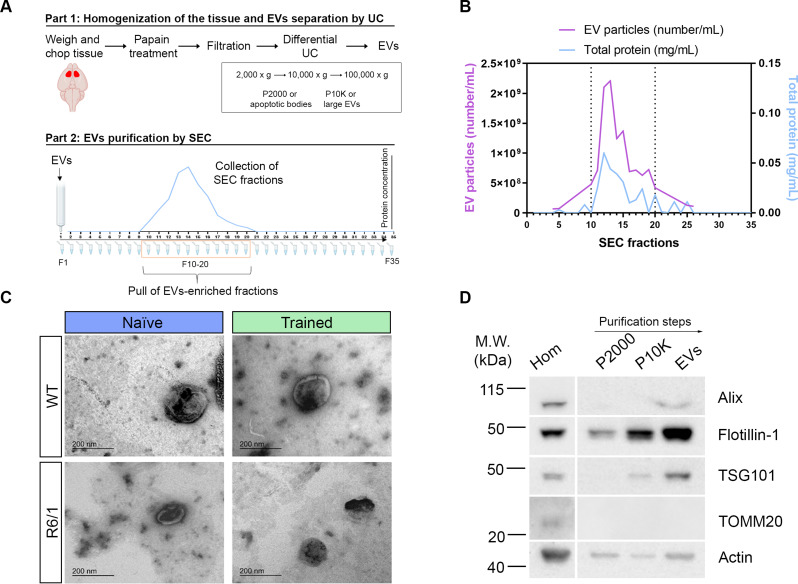
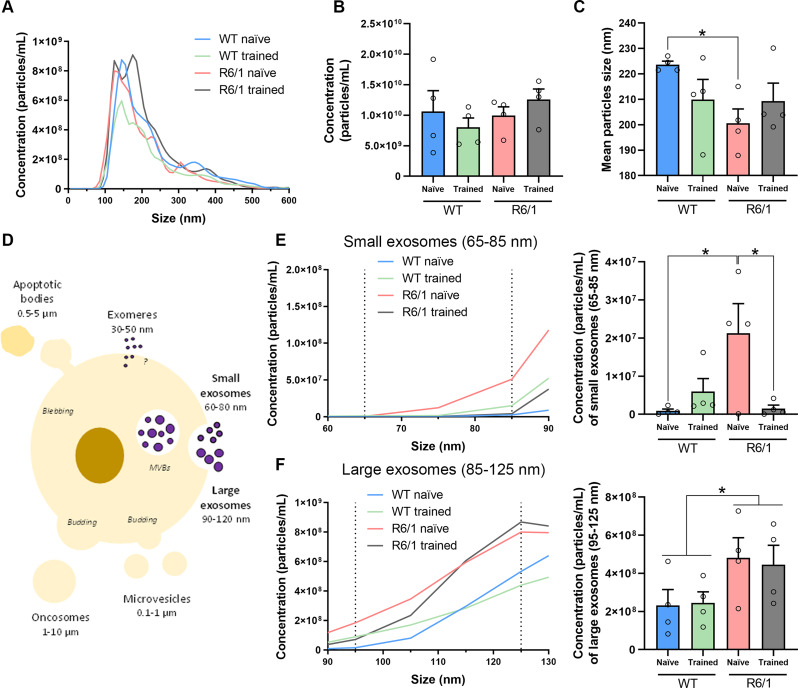
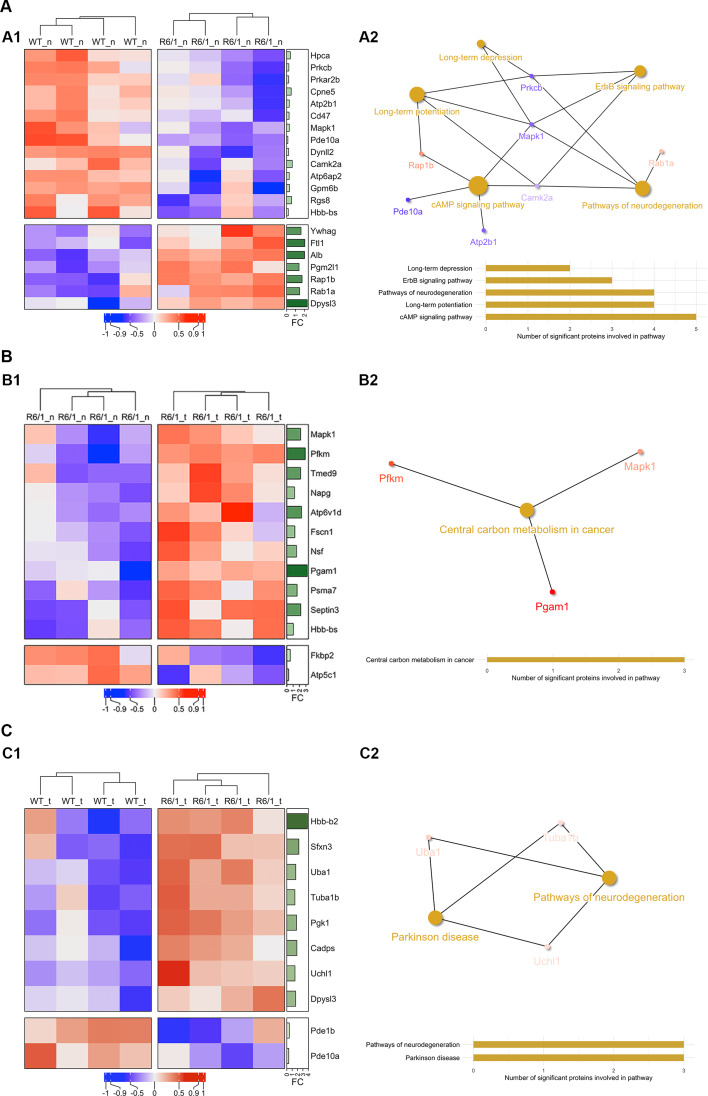
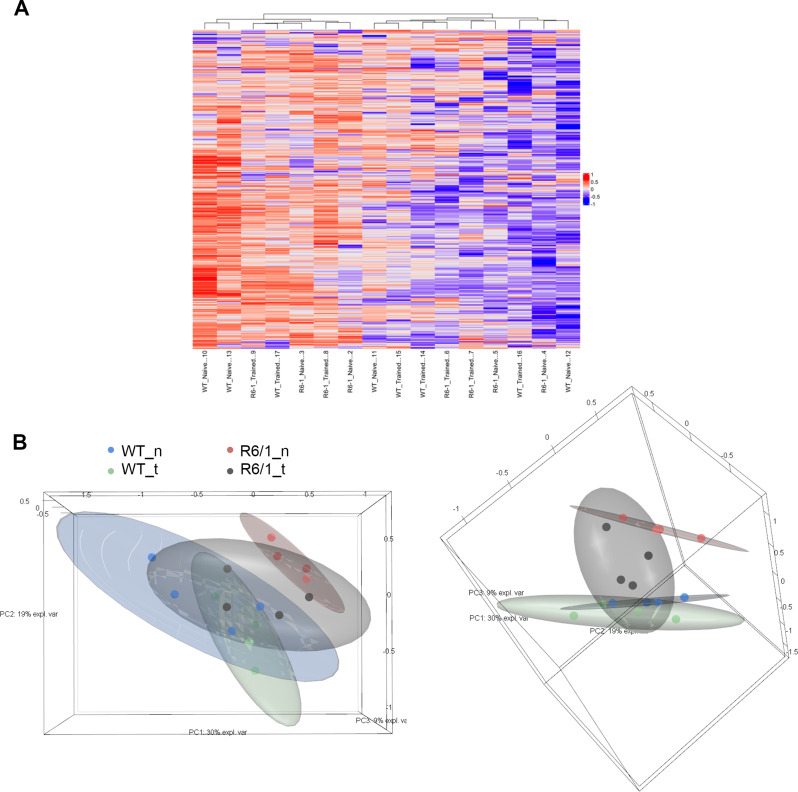
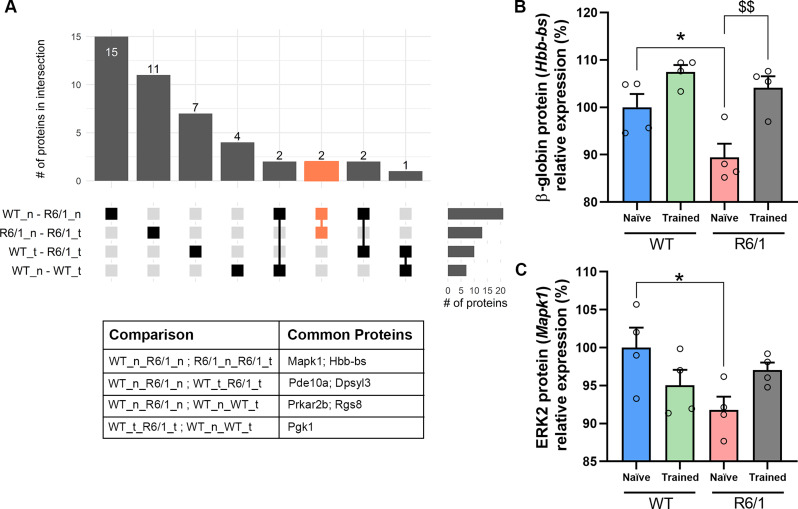
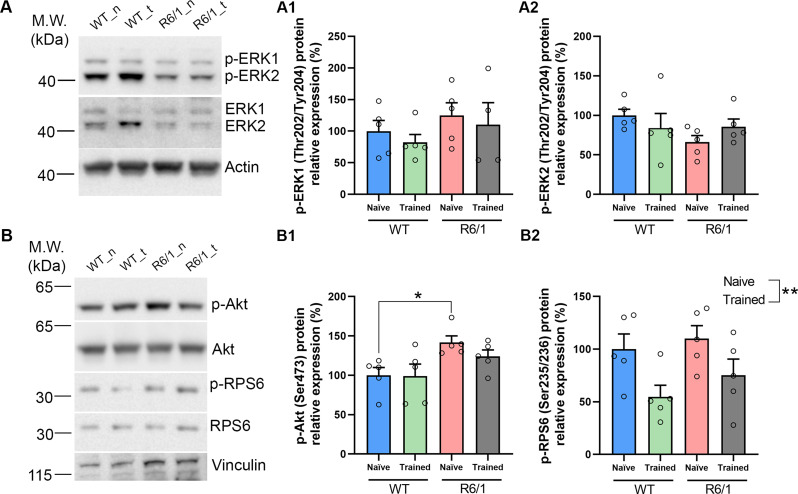
Huntington's disease (HD) is a neurological disorder caused by a CAG expansion in the Huntingtin gene (HTT). HD pathology mostly affects striatal medium-sized spiny neurons and results in an altered cortico-striatal function. Recent studies report that motor skill learning, and cortico-striatal stimulation attenuate the neuropathology in HD, resulting in an amelioration of some motor and cognitive functions. During physical training, extracellular vesicles (EVs) are released in many tissues, including the brain, as a potential means for inter-tissue communication. To investigate how motor skill learning, involving acute physical training, modulates EVs crosstalk between cells in the striatum, we trained wild-type (WT) and R6/1 mice, the latter with motor and cognitive deficits, on the accelerating rotarod test, and we isolated their striatal EVs. EVs from R6/1 mice presented alterations in the small exosome population when compared to WT. Proteomic analyses revealed that striatal R6/1 EVs recapitulated signaling and energy deficiencies present in HD. Motor skill learning in R6/1 mice restored the amount of EVs and their protein content in comparison to naïve R6/1 mice. Furthermore, motor skill learning modulated crucial pathways in metabolism and neurodegeneration. All these data provide new insights into the pathogenesis of HD and put striatal EVs in the spotlight to understand the signaling and metabolic alterations in neurodegenerative diseases. Moreover, our results suggest that motor learning is a crucial modulator of cell-to-cell communication in the striatum.

Keywords: Cortico-striatal activation; Extracellular vesicles; Huntington’s disease; Motor learning; Proteomics; Striatum.


Conflict of interest statement

The authors declare no competing interests.

Figures

Fig. 1
Fig. 1
Accelerating rotarod training in WT and R6/1 mice. (A) Schematic representation of the experimental procedure. 2-month-old WT and R6/1 transgenic mice were divided in two groups: the naïve group was presented the first day to the rod, but no training was performed, and the trained group was physically trained for 3 consecutive days, with 4 trials per day. 90 min after the last trial, the striata was dissected out and kept at -80ºC until processing for EVs isolation. (B) Latency to fall at accelerating speeds (4–40 rpm) over 5 min. (C) Latency to fall. Data is represented as the mean of the 4 trials per day. Values are represented as mean ± SEM (n = 4). Data were analyzed by two-way ANOVA followed by Bonferroni’s post hoc test. (*P < 0.05, vs. WT)
Fig. 2
Fig. 2
Isolation and purification of striatal EVs. (A) Schematic overview of EVs isolation from the striata. Striata was chopped and chemically digested, then homogenized and, cells, apoptotic bodies and large EVs were discarded by centrifugation. EVs were isolated from the supernatant by differential ultracentrifugation. EVs were then purified by SEC, and fractions 10 to 20 (peak in protein and particle concentration) were pulled together and considered as EV-enriched. (B) SEC elution profile. Total protein (blue) and EVs particle concentration (purple) was measured in each fraction by NanoDrop™ Spectrophotometer and NanoSight NS300, respectively. The peak of protein corresponds to the peak of EVs particles. (C) TEM micrographs of the vesicles show particles with the characteristic morphology and size of EVs, in the four groups (WT / R6/1 ± training). Images were visualized using negative staining. (D) Homogenates, apoptotic bodies (P2000), large microvesicles (P10K) and EVs were subjected to WB analysis with antibodies against EVs markers (Alix, Flotillin-1 and TSG101). TOMM20 is used as a negative EV control. Actin is used as a loading control for homogenates
Fig. 3
Fig. 3
Striatal EVs from WT and R6/1 mice are differentially distributed in size and concentration. (A) Representative average curve of size distribution and particle concentration of the four different groups (WT / R6/1 ± training), by NTA analysis. Data is represented as the mean of the 4 animals per group and normalized by the tissue weight used for EVs-isolation. (B) Quantification of the total EVs particle concentration. (C) Quantification of the mean diameter (nm) of EVs particles. (D) Schematic representation of the different types of EVs, classified by size and biogenesis. (E) Vesicles ranging from 65 to 85 nm were selected (small exosomes) and concentration was represented. (F) Vesicles ranging from 95 to 125 nm were selected (large exosomes) and concentration was represented. Values are represented as mean ± SEM (n = 4). Data were analyzed by two-way ANOVA followed by Bonferroni’s post hoc test. (*P < 0.05)
Fig. 4
Fig. 4
Striatal EVs from naïve or trained WT and R6/1 mice present a differential proteomic signature that results in biological pathways’ alterations. (A) Pairwise comparison of naïve WT and R6/1 mice striatal EVs. (A1) Heatmap showing the differentially expressed proteins in WT and R6/1 mice derived striatal EVs (n = 4 per group). (A2) Network plot show in yellow the significant pathways that are altered considering the proteomic content of EVs. (B) Pairwise comparison of naïve R6/1 and trained R6/1 striatal EVs. (B1) Heatmap showing the differentially expressed proteins in naïve R6/1 and trained R6/1 mice striatal EVs (n = 4 per group). (B2) Network plot show in yellow the significant pathways that are altered considering the proteomic content of EVs. (C) Pairwise comparison of trained WT and R6/1 striatal EVs. (C1) Heatmap showing the differentially expressed proteins in WT trained and R6/1 trained mice striatum-EVs (n = 4 per group). (C2) Network plot show in yellow the significant pathways that are altered considering the proteomic content of EVs. In all cases, statistically significant overexpressed proteins are depicted in red, whereas proteins that are underrepresented are shown in blue. In the right annotation the fold change (FC) is displayed in green as a bar plot for each of the proteins (the darker the color, the higher the FC value). FC is calculated as 2^(mean1-mean2). Proteins were considered significant when the p value was under 0.05 in a t-test and a FC of less than 0.33 or above 1.7
Fig. 5
Fig. 5
R6/1 mice striatal EVs get more similar to WT after motor learning. (A) Heatmap showing all the proteins detected in striatum EVs in the four animals per condition, with the method used (LC-MS/MS). Overexpressed proteins are depicted in red, whereas proteins that are underrepresented are shown in blue. (B) PCA-3D model plot constructed with top variables based on a PLS-DA analysis shows clear clustering of naïve WT (WT_n) and naïve R6/1 (R6/1_n) mice striatal EVs, regarding EVs protein composition, but no separation between the other groups. To construct the model, the whole list of proteins –whether significantly altered or not between groups– was used. Component 1 stand for an 30% of variance, component 2 for a 19% and component 3 for a 9%. In addition, surrounding ellipses represent the 95% confidence interval for each group
Fig. 6
Fig. 6
Motor learning restores normal levels of ERK2 and β-globin in R6/1 mice striatal EVs. (A) UpSet plot shows the number of proteins in striatal EVs that overlap among the four comparisons: naïve WT vs. naïve R6/1 (WT_n_R6/1_n), naïve R6/1 vs. trained R6/1 (R6/1_n_R6/1_t); trained WT vs. trained R6/1 (WT_t_R6/1_t), and naïve WT vs. trained WT (WT_n_WT_t). The comparison of interest is shown in orange. The table indicates which proteins are overlapping in each case. (B) Quantification of ERK2 levels in striatal EVs. (C) Quantification of beta-globin levels in striatal EVs. Values are represented as mean ± SEM (n = 4). Data were analyzed by two-way ANOVA followed by Bonferroni’s post hoc test. (*P < 0.05 vs. WT naïve; $$P < 0.01 vs. R6/1 naïve)
Fig. 7
Fig. 7
Motor learning mildly restores the physiological Akt phosphorylation in R6/1 mice. Striatal homogenates from naïve or trained WT and R6/1 mice, were subjected to WB analysis. Actin or vinculin are used as loading controls. (A) Representative immunoblots show phospho-ERK1/2 Thr202/Tyr204 and total ERK. Densitometric analysis of (A1) phospho-ERK1 and (A2) phosphor-ERK2. (B) Representative immunoblots show phospho-Akt Ser473, phospho-RPS6 Ser235/236, total Akt and total RPS6. Densitometric analysis of (B1) phospho-Akt and (B2) phospho-RPS6. Data were analyzed by two-way ANOVA followed by Bonferroni’s post hoc test (*P < 0.05 vs. WT naïve)

Similar articles

Cited by

References

    1. MacDonald ME, Ambrose CM, Duyao MP, et al. A novel gene containing a trinucleotide repeat that is expanded and unstable on Huntington’s disease chromosomes. The Huntington’s Disease Collaborative Research Group. Cell. 1993;72(6):971–83. doi: 10.1016/0092-8674(93)90585-E. - DOI - PubMed
    1. Mann DMA, Oliver R, Snowden JS. The topographic distribution of brain atrophy in Huntington’s disease and progressive supranuclear palsy. Acta Neuropathol. 1993;85(5):553–9. doi: 10.1007/BF00230496/METRICS. - DOI - PubMed
    1. Vonsattel JP, Myers RH, Stevens TJ, Ferrante RJ, Bird ED, Richardson EP. Neuropathological classification of Huntington’s disease. J Neuropathol Exp Neurol. 1985;44(6):559–77. doi: 10.1097/00005072-198511000-00003. - DOI - PubMed
    1. Dumas EM, Van Den Bogaard SJA, Hart EP, et al. Reduced functional brain connectivity prior to and after disease onset in Huntington’s disease. Neuroimage Clin. 2013;2(1):377–84. doi: 10.1016/J.NICL.2013.03.001. - DOI - PMC - PubMed
    1. Burgold J, Schulz-Trieglaff EK, Voelkl K et al. Cortical circuit alterations precede motor impairments in Huntington’s disease mice. Scientific Reports 2019 9:1. 2019;9(1):1–13. 10.1038/s41598-019-43024-w. - PMC - PubMed

Publication types