. 2024 Jun 11;11(1):36.
doi: 10.1186/s40779-024-00539-2.

Genome-wide enhancer RNA profiling adds molecular links between genetic variation and human cancers

Affiliations

Genome-wide enhancer RNA profiling adds molecular links between genetic variation and human cancers

Yi-Min Cai et al. Mil Med Res. .

Abstract

Background: Dysregulation of enhancer transcription occurs in multiple cancers. Enhancer RNAs (eRNAs) are transcribed products from enhancers that play critical roles in transcriptional control. Characterizing the genetic basis of eRNA expression may elucidate the molecular mechanisms underlying cancers.

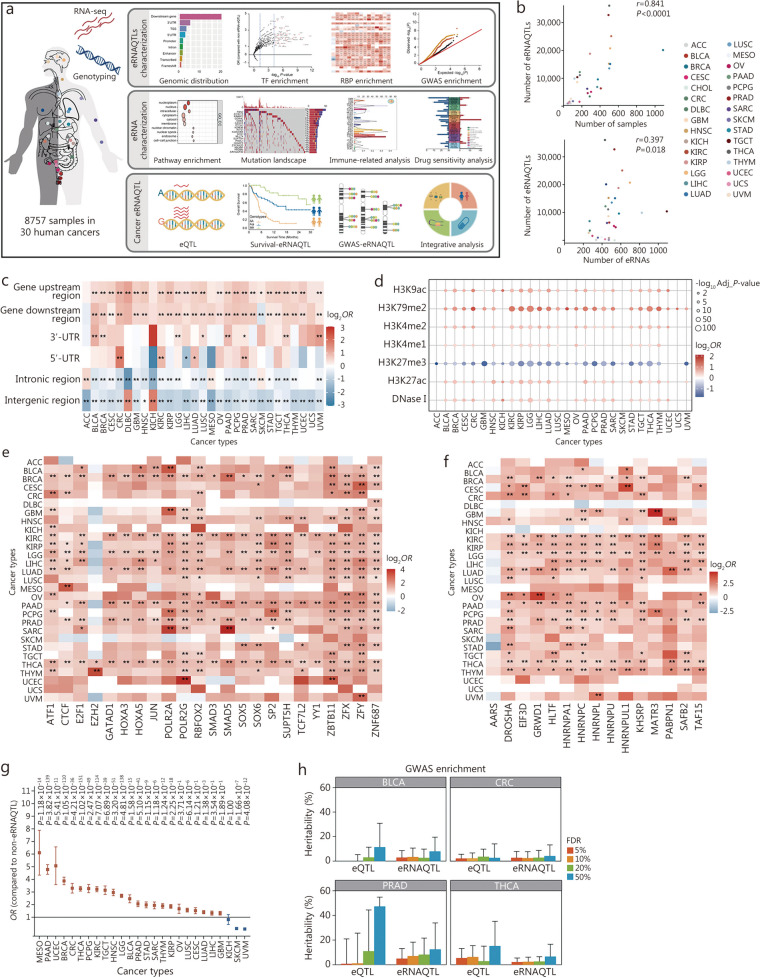
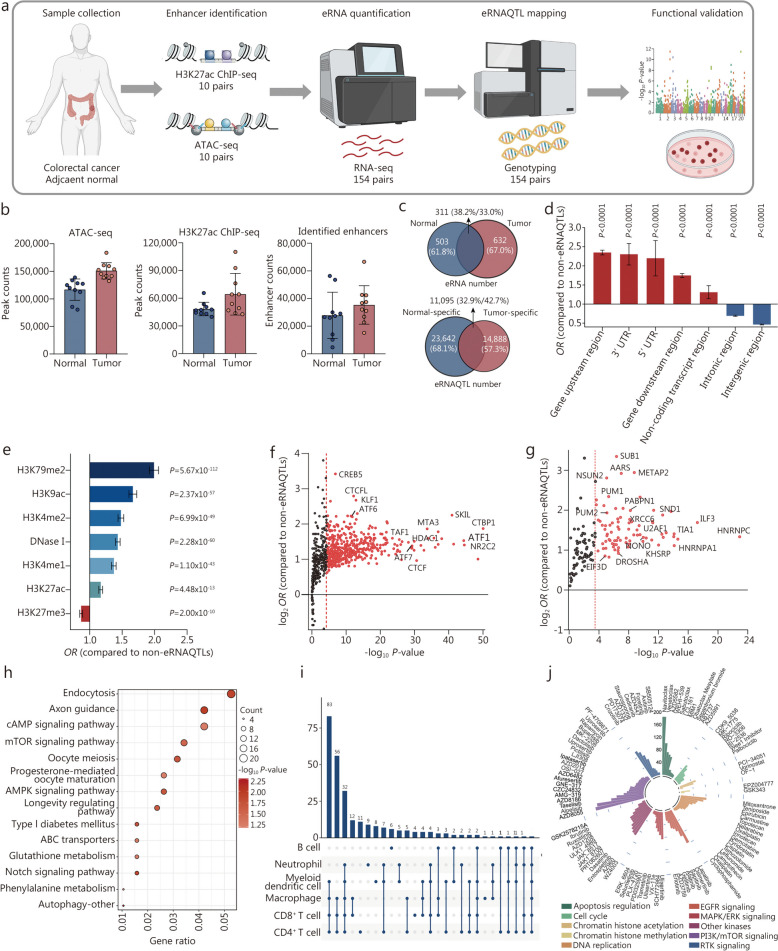
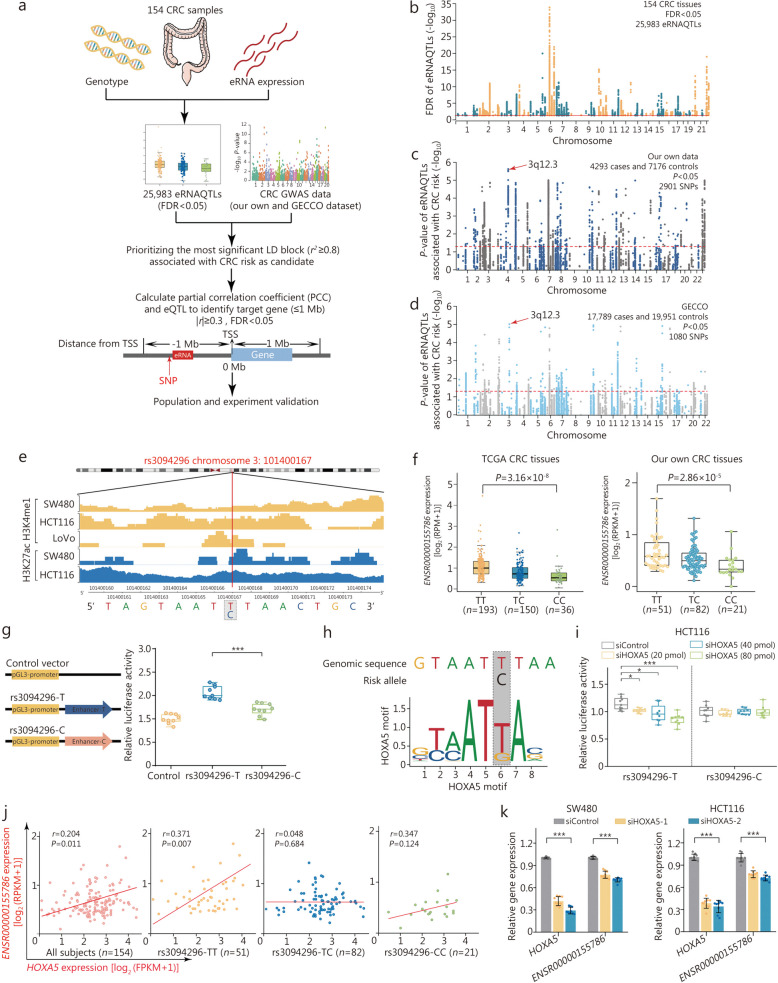
Methods: Initially, a comprehensive analysis of eRNA quantitative trait loci (eRNAQTLs) was performed in The Cancer Genome Atlas (TCGA), and functional features were characterized using multi-omics data. To establish the first eRNAQTL profiles for colorectal cancer (CRC) in China, epigenomic data were used to define active enhancers, which were subsequently integrated with transcription and genotyping data from 154 paired CRC samples. Finally, large-scale case-control studies (34,585 cases and 69,544 controls) were conducted along with multipronged experiments to investigate the potential mechanisms by which candidate eRNAQTLs affect CRC risk.

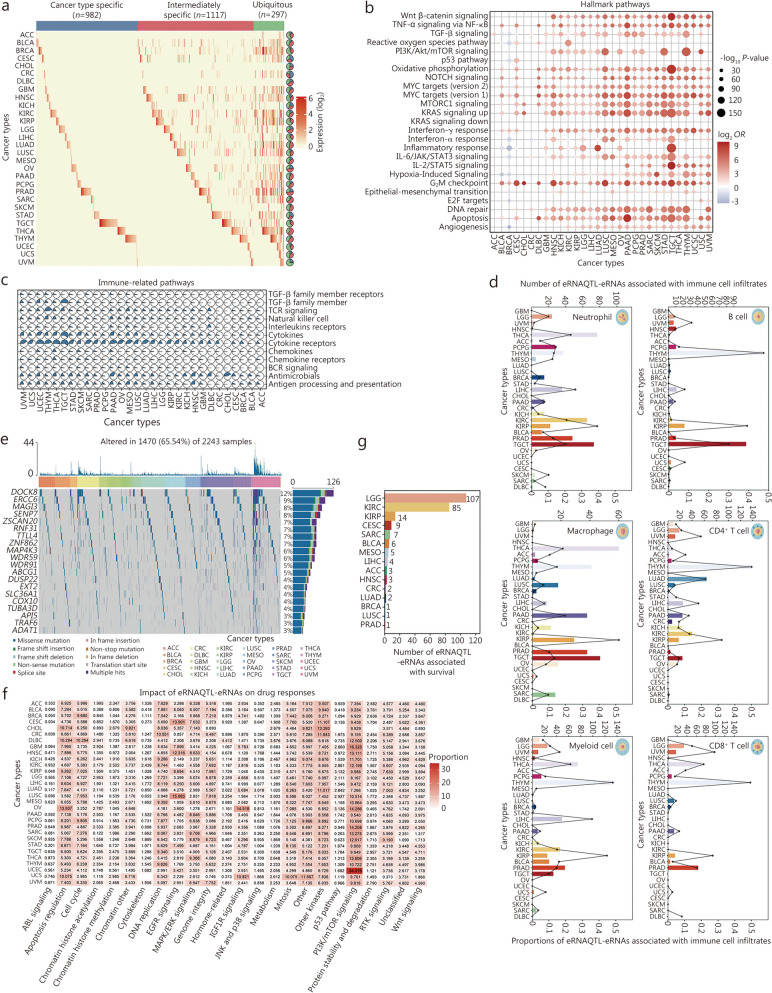
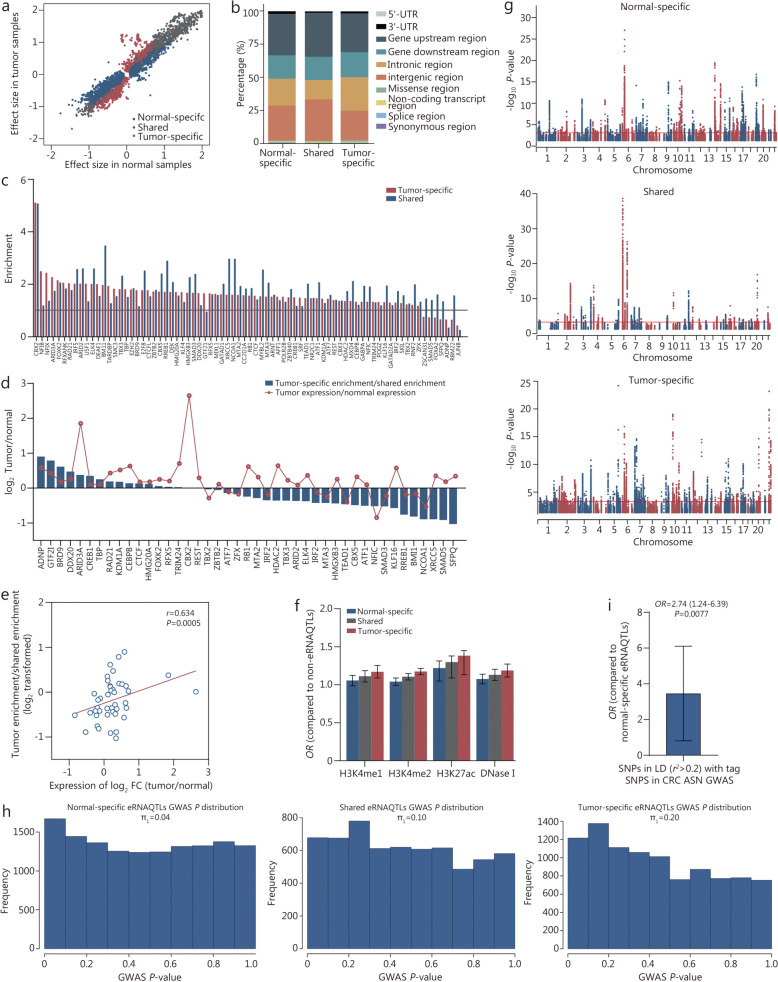
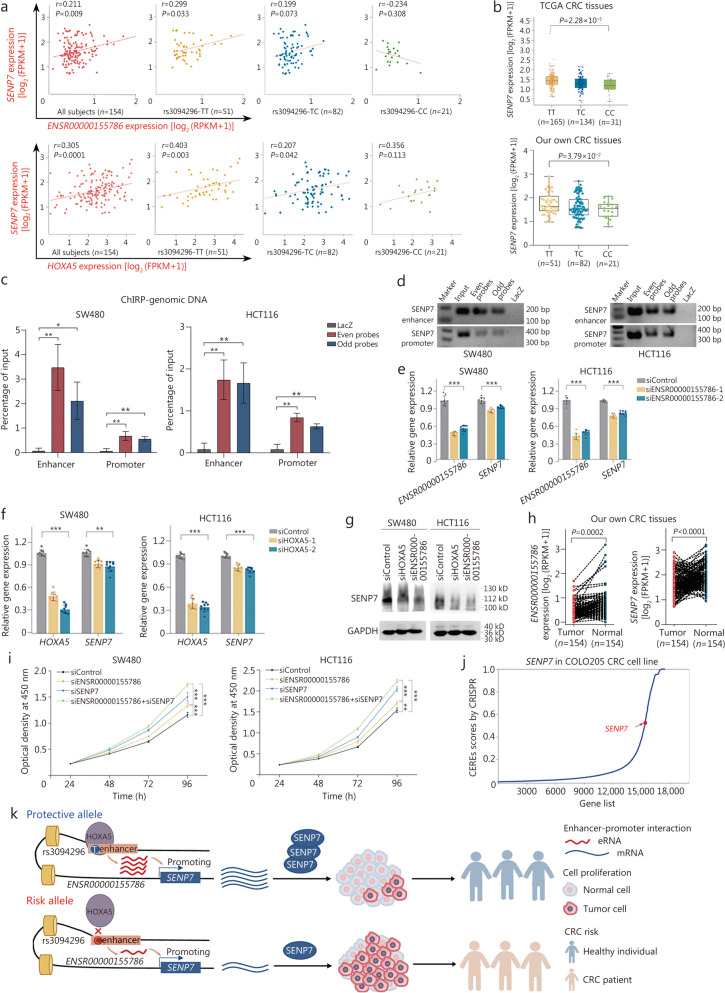
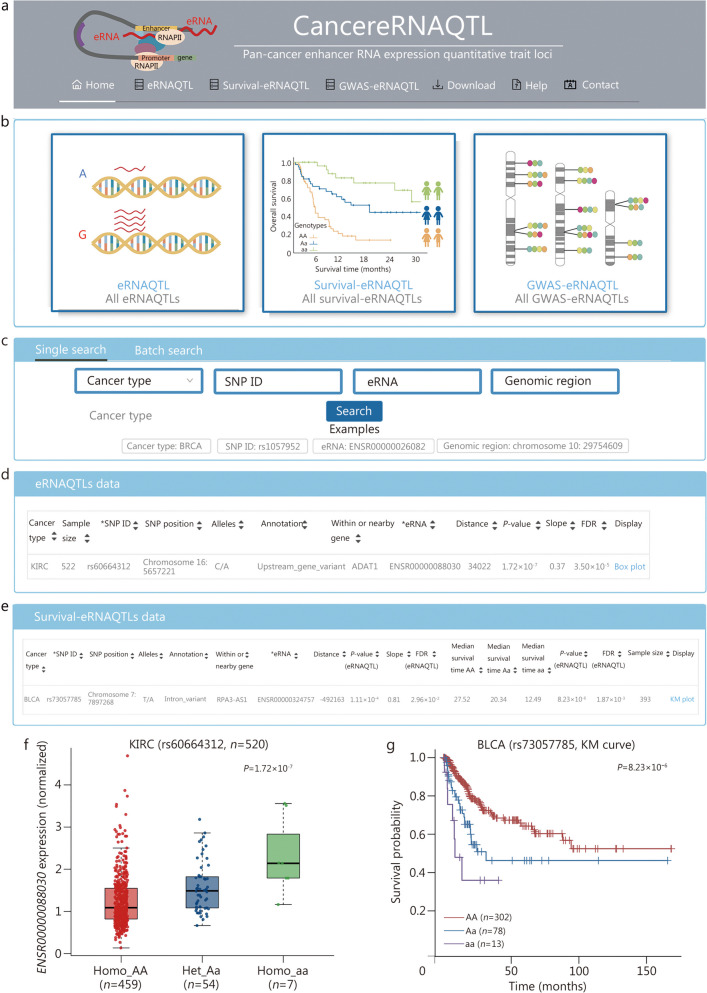
Results: A total of 300,112 eRNAQTLs were identified across 30 different cancer types, which exert their influence on eRNA transcription by modulating chromatin status, binding affinity to transcription factors and RNA-binding proteins. These eRNAQTLs were found to be significantly enriched in cancer risk loci, explaining a substantial proportion of cancer heritability. Additionally, tumor-specific eRNAQTLs exhibited high responsiveness to the development of cancer. Moreover, the target genes of these eRNAs were associated with dysregulated signaling pathways and immune cell infiltration in cancer, highlighting their potential as therapeutic targets. Furthermore, multiple ethnic population studies have confirmed that an eRNAQTL rs3094296-T variant decreases the risk of CRC in populations from China (OR = 0.91, 95%CI 0.88-0.95, P = 2.92 × 10⁻⁷) and Europe (OR = 0.92, 95%CI 0.88-0.95, P = 4.61 × 10⁻⁶). Mechanistically, rs3094296 had an allele-specific effect on the transcription of the eRNA ENSR00000155786, which functioned as a transcriptional activator promoting the expression of its target gene SENP7. These two genes synergistically suppressed tumor cell proliferation. Our curated list of variants, genes, and drugs has been made available in CancereRNAQTL ( http://canernaqtl.whu.edu.cn/#/ ) to serve as an informative resource for advancing this field.

Conclusion: Our findings underscore the significance of eRNAQTLs in transcriptional regulation and disease heritability, pinpointing the potential of eRNA-based therapeutic strategies in cancers.

Keywords: ENSR00000155786; SENP7; Enhancer RNA; Genome-wide association study (GWAS); eRNA quantitative trait loci (eRNAQTLs).


Conflict of interest statement

The authors declare that they have no competing interests.

Figures

Fig. 1
Fig. 1
Systematic identification and functional characterization of eRNAQTLs across 30 human cancers. a Overview of eRNAQTL mapping in TCGA 30 cancer types. Firstly, RNA-seq reads mapped to enhancer regions and imputed genotypes from 8757 tumor samples were included to identify eRNAQTLs using the FastQTL algorithm. Subsequently, features of eRNAQTLs were characterized based on genomic distribution, functional annotation, and GWAS enrichment. Moreover, pathway analysis, mutation landscape, immune infiltration, and drug response were integrated to analyze the functions of target eRNAs in tumorigenesis and clinical application. Finally, to facilitate the exploration of eRNAQTLs by the wider research community, a database CancereRNAQTL was constructed, which includes three basic modules and extended modules. b Correlation between sample size, eRNA number after quality control, and identified eRNAQTLs number across multiple cancer types. c Enrichment of eRNAQTLs in different categories of genomic locations compared with control SNPs. Control SNPs are selected based on the matching number of variants in LD, MAF, and variant type. P-values were calculated by two-tailed Fisher’s exact test with Bonferroni correction according to the number of genomic regions analyzed. The color indicates log2 transformed OR, with red indicating OR > 1 and blue indicating OR < 1. d Bubble plot shows the enrichment of eRNAQTLs vs. random control SNPs in regulatory elements. The circle color represents log2 OR; the circle size represents the Bonferroni-corrected P-value considering the number of regulatory elements tested (7 elements). e Heatmap displays the enrichment of eRNAQTLs among variants within each TF binding site using ChIP-seq data from ENCODE, only the top significant TF in each cancer type was chosen for representation. P-values were calculated by two-tailed Fisher’s exact test with Bonferroni correction of the total number of TFs (that is 801). *Bonferroni-corrected P < 0.05 and **Bonferroni-corrected P < 0.01. The color indicates log2 OR, with red indicating OR > 1 and blue indicating OR < 1. f Enrichment of eRNAQTLs in individual RBPs using enhanced cross-linking immunoprecipitation sequencing (eCLIP-seq) data from ENCODE. P-values and log2 OR were calculated by two-tailed Fisher’s exact test after Bonferroni corrected the number of RBPs subjected to analyses (150 RBPs in total). g Enrichment of cancer-related GWAS signals by mapping eRNAQTLs to tag SNPs and their extended LD block. Results are calculated by two-tailed Fisher’s exact test with P-values corrected by the number of diseases tested. Error bars represent the 95% confidence intervals (CIs). h LD score regression partitioned heritability analysis for eQTLs and eRNAQTLs with varying FDR thresholds of 5%, 10%, 20%, and 50%. Error bars represent standard errors. *P < 0.05, **P < 0.01. TCGA The Cancer Genome Atlas, SNP single nucleotide polymorphism, LD linkage disequilibrium, MAF minor allele frequency, OR odds ratio, TF transcription factor, RBPs RNA binding proteins, ACC adrenocortical carcinoma, BLCA bladder urothelial carcinoma, BRCA breast invasive carcinoma, CESC cervical squamous cell carcinoma and endocervical adenocarcinoma, CHOL cholangiocarcinoma, CRC colon and rectum adenocarcinoma, DLBC lymphoid neoplasm diffuses large B-cell lymphoma, GBM glioblastoma multiforme, HNSC head and neck squamous cell carcinoma, KICH kidney chromophobe, KIRC kidney renal clear cell carcinoma, KIRP kidney renal papillary cell carcinoma, LGG lower grade glioma, LIHC liver hepatocellular carcinoma, LUAD lung adenocarcinoma, LUSC lung squamous cell carcinoma, MESO mesothelioma, OV ovarian serous cystadenocarcinoma, PAAD pancreatic adenocarcinoma, PCPG pheochromocytoma and paraganglioma, PRAD prostate adenocarcinoma, SARC sarcoma, SKCM skin cutaneous melanoma, STAD stomach adenocarcinoma, TGCT testicular germ cell tumors, THCA thyroid carcinoma, THYM thymoma, UCEC uterine corpus endometrial carcinoma, UCS uterine carcinosarcoma, UVM uveal melanoma, eRNAQTLs eRNA quantitative trait loci, RNA-seq RNA sequencing, ChIP-seq chromatin immunoprecipitation sequencing, ENCODE Encyclopedia of DNA Elements, GWAS genome-wide association study, eQTL expression quantitative trait locus, FDR false discovery rate
Fig. 2
Fig. 2
eRNAQTL-eRNAs play significant roles in tumorigenesis and clinical utility. a Expression profile of eRNAQTL-eRNAs in human cancers. Blue, red, and green bars denote cancer type-specific, intermediately specific, and ubiquitous eRNAs, respectively. Pie charts reflect the percentage of eRNAQTL-eRNAs in each category. b Enrichment analysis of the number of eRNAQTL-eRNAs in 50 hallmark gene sets by GSEA based on the rank score of each eRNA and gene. c Scatter pie plot of the proportion of eRNAQTL-eRNAs enriched in 17 immune-related pathways based on GSEA. d The number of eRNAQTL-eRNAs associated with immune cell infiltration estimated by TIMER in each cancer type (top Y-axis). The bottom Y-axis shows the proportion of these immune-related eRNAQTL-eRNAs. e Mutation landscape for target genes of eRNAQTL-eRNAs among 2243 TCGA samples. The top panel shows individual tumor mutation rates while the middle panel details cancer types for each patient. The bottom panel shows genes with relatively high mutation frequency in multiple cancer types. Mutation types are indicated in the legend at the bottom. f Proportion of eRNAQTL-eRNAs associated with drug response from GDSC dataset among different cancer signaling pathways. g Number of prognostic eRNAQTL-eRNAs in different cancer types. eRNAQTL eRNA quantitative trait locus, GSEA gene set enrichment analysis, TIMER Tumor Immune Estimation Resource, GDSC Genomics of Drug Sensitivity in Cancer, ACC adrenocortical carcinoma, BLCA bladder urothelial carcinoma, BRCA breast invasive carcinoma, CESC cervical squamous cell carcinoma and endocervical adenocarcinoma, CHOL cholangiocarcinoma, CRC colon and rectum adenocarcinoma, DLBC lymphoid neoplasm diffuses large B-cell lymphoma, GBM glioblastoma multiforme, HNSC head and neck squamous cell carcinoma, KICH kidney chromophobe, KIRC kidney renal clear cell carcinoma, KIRP kidney renal papillary cell carcinoma, LGG lower grade glioma, LIHC liver hepatocellular carcinoma, LUAD lung adenocarcinoma, LUSC lung squamous cell carcinoma, MESO mesothelioma, OV ovarian serous cystadenocarcinoma, PAAD pancreatic adenocarcinoma, PCPG pheochromocytoma and paraganglioma, PRAD prostate adenocarcinoma, SARC sarcoma, SKCM skin cutaneous melanoma, STAD stomach adenocarcinoma, TGCT testicular germ cell tumors, THCA thyroid carcinoma, THYM thymoma, UCEC uterine corpus endometrial carcinoma, UCS uterine carcinosarcoma, UVM uveal melanoma, WNT wingless-related integration site, RTK receptor tyrosine kinase, PI3K/mTOR phosphoinositide 3-kinase/mammalian target of rapamycin pathway, JNK and p38 Jun N-terminal kinase and p38 mitogen-activated protein kinase, IGF1R insulin-like growth factor 1 receptor, MAPK/ERK mitogen-activated protein kinase/extracellular signal-regulated kinase, EGFR epidermal growth factor receptor, ABL abelson
Fig. 3
Fig. 3
Validation of eRNAQTL profiles in Chinese colorectal cancer (CRC) samples. a Flowchart of enhancer identification and eRNAQTLs mapping in our CRC discovery set. ATAC-seq and H3K27ac ChIP-seq signals of 10 pairs of CRC tumor and adjacent normal tissues were integrated to identify active enhancer elements. Then, RNA-seq data of 154 pairs of tumor and normal tissues were mapped to these enhancer regions for quantifying eRNA transcription. By combining genotype data, the first Chinese eRNAQTL profiles were established in CRC. b The number of ATAC-seq peaks, H3K27ac ChIP-seq peaks, and active enhancers in 10 pairs of tumor and adjacent normal tissues. c Venn diagram showing the number of eRNAs (top) and eRNAQTLs (bottom) identified in 154 pairs of normal and tumor tissues. d Enrichment analysis of tumor eRNAQTL SNPs in different genomic categories. P-values were calculated by a two-tailed Fisher’s exact test. Bars indicate 95%CI. e Enrichment analysis of tumor eRNAQTLs among variants within regulatory elements. P-values were calculated by a two-tailed Fisher’s exact test. Bars indicate 95%CI. f Plots of -log10 P-value (X-axis) and -log2 OR (Y-axis) were obtained from enrichment analysis of tumor eRNAQTLs among variants within TF binding sites. The red dashed line indicates P = 0.05/801 (6.24 × 10−5) (Bonferroni-corrected P-value threshold, binding sites for a total of 801 TFs were tested). g Enrichment of eRNAQTL SNPs at RBP binding sites by two-tailed Fisher’s exact test. The red dashed line indicates the Bonferroni-corrected P-value threshold according to the number of RBPs tested (150 RBPs). h KEGG pathway analysis for target genes of eRNAQTL-eRNAs in CRC. The circle size represents the number of genes enriched in each pathway, and the color indicates the -log10 P-value of enrichment. i Number of eRNAQTL-eRNAs associated with immune cell fractions, calculated by partial correlation coefficient with tumor purity adjusted. j Circle plot summarized the number of eRNAQTL-eRNAs associated with pharmaceutical targets in different categories. The count numbers are displayed with different colors by the cancer signaling pathway. ATAC-seq assay for transposase-accessible chromatin with high throughput sequencing, ChIP-seq chromatin immunoprecipitation sequencing, CI confidence interval, RBP RNA binding protein, KEGG Kyoto Encyclopedia of Genes and Genomes, OR odds ratio, CRC colorectal cancer, SNP single nucleotide polymorphism, eRNAQTL eRNA quantitative trait locus, MAPK/ERK mitogen-activated protein kinase/extracellular signal-regulated kinase, EGFR epidermal growth factor receptor, RTK receptor tyrosine kinase, PI3K/mTOR phosphoinositide 3-kinase/mammalian target of rapamycin pathway, cAMP cathelicidin antimicrobial peptide, ABC transporters ATP-binding cassette transporters, AMPK adenosine 5’-monophosphate (AMP)-activated protein kinase, mTOR mammalian target of rapamycin
Fig. 4
Fig. 4
Comparison between eRNAQTLs in normal and tumor-derived colorectal tissues. a Effect sizes of eRNAQTLs identified in normal samples vs. tumor samples. b The stacked bar charts indicate the percentage of 10 functional categories for each type of eRNAQTLs. c The enrichment of tumor-specific eRNAQTLs and shared eRNAQTLs in TF binding sites. The bar plot is ordered by the tumor-specific enrichment. The null (frequency and variant type matched) is represented as the black horizontal line. d The ratio of the tumor-specific enrichment to the shared enrichment (in log scale) for significantly differentially expressed transcription factors (TFs) are shown as blue bars. The red line depicts the differential expression fold change of the TFs. e Correlation between the enrichment in TF binding sites and fold change (FC) of differentially expressed TFs. f Enrichment analysis of eRNAQTLs among variants within 4 epigenomic marks, including H3K4me1, H3K4me2, H3K27ac, and DNase I hypersensitive sites. P-values were calculated by a two-tailed Fisher’s exact test. g Manhattan plot of -log10 P-value from the results of three types of eRNAQTLs in our CRC samples (normal-specific eRNAQTLs, shared eRNAQTLs, and tumor-specific eRNAQTLs). The eRNAQTL P-values (-log10) of the SNPs (Y-axis) are presented according to their chromosomal positions (X-axis). h CRC GWAS P-value distributions and statistics for normal-specific, shared, and tumor-specific eRNAQTLs. i Enrichment analysis of tumor-specific eRNAQTL SNPs among CRC risk loci in Asian populations. The P-value was calculated by two-tailed Fisher’s exact tests. OR is depicted on the Y-axis and bars indicate 95%CIs. OR odds ratio, CRC colorectal cancer, CI confidence interval, ASN Asian, eRNAQTL eRNA quantitative trait locus, SNP single nucleotide polymorphism, GWAS genome-wide association study
Fig. 5
Fig. 5
eRNAQTL rs3094296 promotes eRNA ENSR00000155786 expression mediated by TF HOXA5. a Workflow to identify the candidate variant by integrating eRNAQTL analysis and CRC GWAS data, the target gene was selected by combining co-expression analysis and eQTL result in CRC. b Manhattan plot of eRNAQTL results in 154 CRC samples. The red line shows the FDR < 0.05 threshold. c Manhattan plot for associations between eRNAQTLs and CRC risk from the Chinese population consisting of 4293 cases and 7176 controls. d Validation in European populations from GECCO, with a combined sample size of 17,789 cases and 19,951 controls. P-values were calculated by an unconditional logistical regression analysis with an additive model adjusting for gender, age, smoking, and drinking status. P < 0.05 was considered statistically significant (indicated by the red line). e Epigenetic tracks obtained from the Cistrome database show the enrichment of enhancer markers (H3K4me1 and H3K27ac peaks) in the rs3094296 region. f eRNAQTL analysis demonstrates the correlation between the rs3094296 genotype and the expression of ENSR00000155786 in the TCGA CRC samples and our own CRC tissues. Data were shown as the median (minimum to maximum). g Relative reporter gene activity of the vectors containing the rs3094296-T or rs3094296-C allele in HCT116 cell. h The rs3094296-T allele resides within the HOXA5 binding motif. i The effect of HOXA5 knockdown on the relative luciferase activity of vectors containing the rs3094296-T or rs3094296-C allele in HCT116 cell. Data were presented as the median (minimum to maximum) from three repeated experiments, each has three technical replicates. P-values were calculated by a two-sided Student’s t-test. j Scatter plots show the correlations between HOXA5 and ENSR00000155786 expression in our CRC tumor tissues and stratified by SNP rs3094296 genotype. All P-values and correlation coefficients were calculated by Spearman’s correlation analysis. k Histogram displays the effect of HOXA5 knockdown on the expression of ENSR00000155786 in SW480 and HCT116 cells. Data were presented as the mean ± SD from three repeated experiments with three technical replicates. All P-values were calculated using a two-sided Student’s t-test. *P < 0.05, ***P < 0.001. CRC colorectal cancer, FDR false discovery rate, GECCO Genetics and Epidemiology of Colorectal Cancer Consortium, LD linkage disequilibrium, FPKM fragments per kilobase of exon model per million mapped fragments, RPKM reads per kilobase per million mapped reads, HOXA5 homeobox A5, SD standard deviation
Fig. 6
Fig. 6
eRNA ENSR00000155786 inhibits colorectal cancer (CRC) cell proliferation by activating SENP7 expression. a Scatter plots show the correlations between ENSR00000155786 and SENP7 expression, as well as the correlations between HOXA5 and SENP7 expression in our CRC tumor tissues both of them, are stratified by SNP rs3094296 genotype. All P-values and correlation coefficients were calculated by Spearman’s correlation analysis. b eQTL analyses demonstrate the correlation between the rs3094296 genotype and the expression of SENP7 in the TCGA CRC samples and our own CRC tissues. Data were shown as the median (minimum to maximum). ChIRP assay was performed using two different sets of antisense probes (“even group” and “odd group”) that detected ENSR00000155786 or control probes (anti-LacZ) in CRC cell lines. The enrichment of genomic DNA in the ChIRP and input samples was measured by qPCR (c) and agarose gel electrophoresis (d). Data were shown as the mean ± SD. P-values were calculated by a two-sided Student’s t-test. The histogram displays the effect of ENSR00000155786 knockdown on the expression of SENP7 (e) and the effect of HOXA5 knockdown on the expression of SENP7 (f) in SW480 and HCT116 cells. Data were presented as the mean ± SD from three repeated experiments with three technical replicates. All P-values were calculated using a two-sided Student’s t-test. g Western blotting analysis shows that the knockdown of HOXA5 and ENSR00000155786 reduced the protein expression level of SENP7 in SW480 and HCT116 cells. h ENSR00000155786 and SENP7 are significantly decreased in tumor tissues compared with normal tissues from our own CRC tissues. P-values were calculated by a paired two-sided Student’s t-test. i Cell proliferation assay with knockdown of ENSR00000155786 and SENP7 in SW480 and HCT116 cells. Results were shown as the means ± SEM from three experiments, each with six replicates. P-values were calculated from a two-sided Student’s t-test by comparing with controls in 96 h. SENP7 is essential for cell growth with higher CERE scores in COLO205 CRC cell lines from the data of genome-wide CRISPR/Cas9-based loss-of-function screen. Higher CERE scores demonstrate an elevated dependency of cell viability on given genes. k The graph shows the mechanism that eRNAQTL rs3094296 contributes to a decreased risk of CRC by playing allele-specific effect to transcribe eRNA ENSR00000155786, which further exerts a transcriptional activator promoting target gene SENP7 expression, then these two genes display a synergistic effect to inhibit tumor cells proliferation. *P < 0.05, **P < 0.01, ***P < 0.001. FPKM fragments per kilobase of exon model per million mapped fragments, RPKM reads per kilobase per million mapped reads, HOXA5 homeobox A5, SENP7 sentrin-specific protease 7, ChIRP chromatin isolation by RNA purification, CERES CRISPR enrichment-based screening, SEM standard error of the mean
Fig. 7
Fig. 7
Overview and functional modules of CancereRNAQTL database. a Browser bar in CancereRNAQTL. b Three modules in CancereRNAQTL, including eRNAQTLs, survival-eRNAQTLs, and GWAS-eRNAQTLs. c The single and batch search boxes in CancereRNAQTL. d The eRNAQTL search module in CancereRNAQTL. e The survival-eRNAQTL search module in CancereRNAQTL. f An example of eRNAQTL results on the “eRNAQTL” page and the corresponding boxplot. g An example of survival-eRNAQTL results in the “survival-eRNAQTL” page and the corresponding KM plot. BLCA bladder urothelial carcinoma, KIRC kidney renal clear cell carcinoma, KM Kaplan-Meier, eRNAQTL eRNA quantitative trait locus, SNP single nucleotide polymorphism, GWAS genome-wide association study

Similar articles

Cited by

References

    1. Sud A, Kinnersley B, Houlston RS. Genome-wide association studies of cancer: current insights and future perspectives. Nat Rev Cancer. 2017;17(11):692–704. doi: 10.1038/nrc.2017.82. - DOI - PubMed
    1. Yao DW, O’Connor LJ, Price AL, Gusev A. Quantifying genetic effects on disease mediated by assayed gene expression levels. Nat Genet. 2020;52(6):626–33. doi: 10.1038/s41588-020-0625-2. - DOI - PMC - PubMed
    1. Hormozdiari F, Gazal S, van de Geijn B, Finucane HK, Ju CTJ, Loh PR, et al. Leveraging molecular quantitative trait loci to understand the genetic architecture of diseases and complex traits. Nat Genet. 2018;50(7):1041–7. doi: 10.1038/s41588-018-0148-2. - DOI - PMC - PubMed
    1. Murakawa Y, Yoshihara M, Kawaji H, Nishikawa M, Zayed H, Suzuki H, et al. Enhanced identification of transcriptional enhancers provides mechanistic insights into diseases. Trends Genet. 2016;32(2):76–88. doi: 10.1016/j.tig.2015.11.004. - DOI - PubMed
    1. Kim TK, Hemberg M, Gray JM, Costa AM, Bear DM, Wu J, et al. Widespread transcription at neuronal activity-regulated enhancers. Nature. 2010;465(7295):182–7. doi: 10.1038/nature09033. - DOI - PMC - PubMed