The neural representation of body part concepts
- PMID: 38863113
- PMCID: PMC11166504
- DOI: 10.1093/cercor/bhae213
The neural representation of body part concepts
Abstract
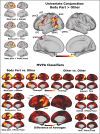
Neuropsychological and neuroimaging studies provide evidence for a degree of category-related organization of conceptual knowledge in the brain. Some of this evidence indicates that body part concepts are distinctly represented from other categories; yet, the neural correlates and mechanisms underlying these dissociations are unclear. We expand on the limited prior data by measuring functional magnetic resonance imaging responses induced by body part words and performing a series of analyses investigating the cortical representation of this semantic category. Across voxel-level contrasts, pattern classification, representational similarity analysis, and vertex-wise encoding analyses, we find converging evidence that the posterior middle temporal gyrus, the supramarginal gyrus, and the ventral premotor cortex in the left hemisphere play important roles in the preferential representation of this category compared to other concrete objects.
Keywords: body representation; categories; functional MRI; representational similarity analysis; semantics.
© The Author(s) 2024. Published by Oxford University Press. All rights reserved. For permissions, please e-mail: journals.permissions@oup.com.
Figures


Similar articles
-
Short-Term Memory Impairment.2024 Jun 8. In: StatPearls [Internet]. Treasure Island (FL): StatPearls Publishing; 2025 Jan–. 2024 Jun 8. In: StatPearls [Internet]. Treasure Island (FL): StatPearls Publishing; 2025 Jan–. PMID: 31424720 Free Books & Documents.
-
Brain-wide decoding of numbers and letters: Converging evidence from multivariate fMRI analysis and probabilistic meta-analysis.Cortex. 2025 Aug;189:256-274. doi: 10.1016/j.cortex.2025.04.017. Epub 2025 Jun 13. Cortex. 2025. PMID: 40580696
-
Concept Representation Reflects Multimodal Abstraction: A Framework for Embodied Semantics.Cereb Cortex. 2016 May;26(5):2018-34. doi: 10.1093/cercor/bhv020. Epub 2015 Mar 5. Cereb Cortex. 2016. PMID: 25750259 Free PMC article.
-
Neural decoding of semantic concepts: a systematic literature review.J Neural Eng. 2022 Apr 13;19(2). doi: 10.1088/1741-2552/ac619a. J Neural Eng. 2022. PMID: 35344941
-
Language and gesture neural correlates: A meta-analysis of functional magnetic resonance imaging studies.Int J Lang Commun Disord. 2024 May-Jun;59(3):902-912. doi: 10.1111/1460-6984.12987. Epub 2023 Nov 16. Int J Lang Commun Disord. 2024. PMID: 37971416 Review.
References
-
- Anderson A, Binder JR, Fernandino L, Humphries CJ, Conant LL, Aguilar M, Wang X, Doko D, Raizada RDS. Predicting neural activity patterns associated with sentences using a neurobiologically motivated model of semantic representation. Cereb Cortex. 2016:27(9):4379–4395. 10.1093/cercor/bhw240. - DOI - PubMed
-
- Benjamini Y, Hochberg Y. Controlling the false discovery rate: a practical and powerful approach to multiple testing. J R Stat Soc Series B Stat Methodology. 1995:57(1):289–300. 10.1111/j.2517-6161.1995.tb02031.x. - DOI
Publication types
MeSH terms
Grants and funding
LinkOut - more resources
Full Text Sources
Medical

