

SAAM II: A general mathematical modeling rapid prototyping environment
- PMID: 38863172
- PMCID: PMC11247119
- DOI: 10.1002/psp4.13181
SAAM II: A general mathematical modeling rapid prototyping environment
Abstract
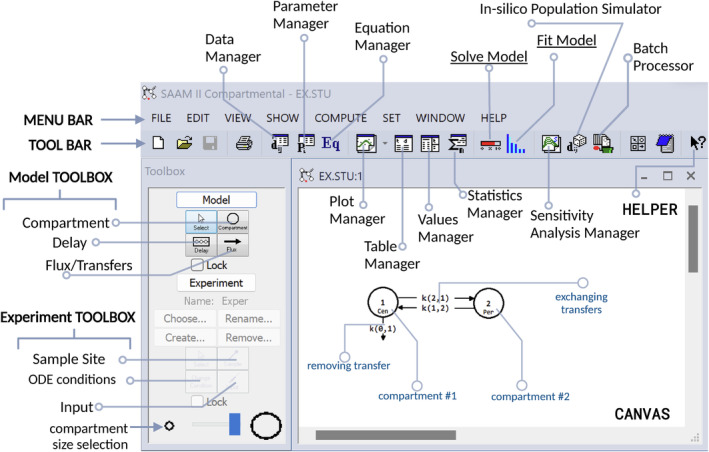
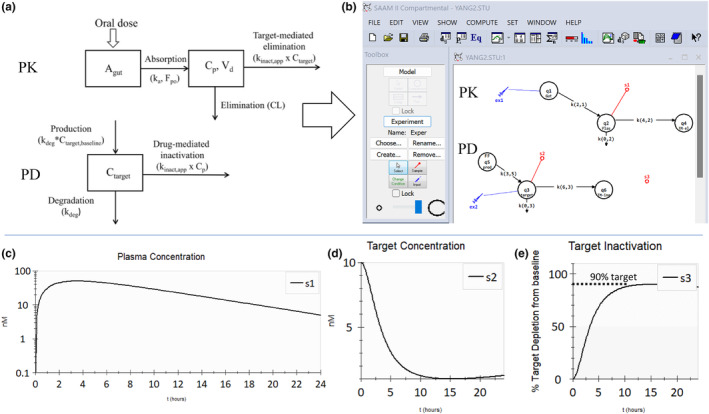
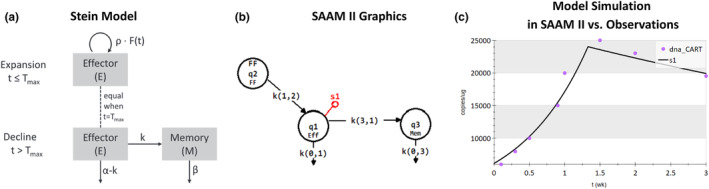
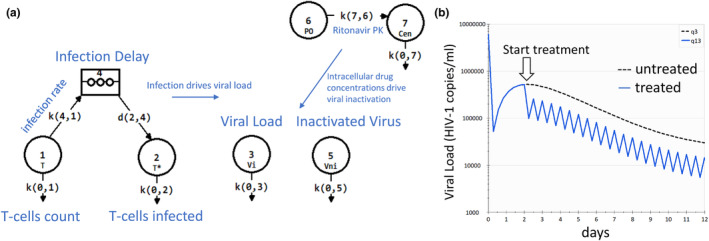
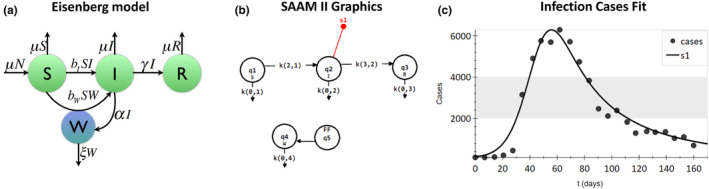
Simulation Analysis and Modeling II (SAAM II) is a graphical modeling software used in life sciences for compartmental model analysis, particularly, but not exclusively, appreciated in pharmacokinetics (PK) and pharmacodynamics (PD), metabolism, and tracer modeling. Its intuitive "circles and arrows" visuals allow users to easily build, solve, and fit compartmental models without the need for coding. It is suitable for rapid prototyping of models for complex kinetic analysis or PK/PD problems, and in educating students and non-modelers. Although it is straightforward in design, SAAM II incorporates sophisticated algorithms programmed in C to address ordinary differential equations, deal with complex systems via forcing functions, conduct multivariable regression featuring the Bayesian maximum a posteriori, perform identifiability and sensitivity analyses, and offer reporting functionalities, all within a single package. After 26 years from the last SAAM II tutorial paper, we demonstrate here SAAM II's updated applicability to current life sciences challenges. We review its features and present four contemporary case studies, including examples in target-mediated PK/PD, CAR-T-cell therapy, viral dynamics, and transmission models in epidemiology. Through such examples, we demonstrate that SAAM II provides a suitable interface for rapid model selection and prototyping. By enabling the fast creation of detailed mathematical models, SAAM II addresses a unique requirement within the mathematical modeling community.
© 2024 The Author(s). CPT: Pharmacometrics & Systems Pharmacology published by Wiley Periodicals LLC on behalf of American Society for Clinical Pharmacology and Therapeutics.
Conflict of interest statement
The author, SP is the Founder and President of Nanomath LLC, a modeling and simulation company that holds the rights to license, develop, and distribute SAAM II, the subject of this tutorial. There are no additional conflicts of interest to declare.
Figures
Similar articles
-
Generalization of map estimation in SAAM II: validation against ADAPT II in a glucose model case study.Ann Biomed Eng. 2002 Jul-Aug;30(7):961-8. doi: 10.1114/1.1507328. Ann Biomed Eng. 2002. PMID: 12398426
-
A pharmacokinetic/pharmacodynamic comparison of SAAM II and PC/WinNonlin modeling software.J Pharm Sci. 1998 Oct;87(10):1255-63. doi: 10.1021/js9603562. J Pharm Sci. 1998. PMID: 9758686
-
A resource facility for kinetic analysis: modeling using the SAAM computer programs.Health Phys. 1989;57 Suppl 1:457-66. doi: 10.1097/00004032-198907001-00063. Health Phys. 1989. PMID: 2606705
-
Pharmacokinetic software for the health sciences: choosing the right package for teaching purposes.Clin Pharmacokinet. 2001;40(6):395-403. doi: 10.2165/00003088-200140060-00001. Clin Pharmacokinet. 2001. PMID: 11475465 Review.
-
A Critique of Computer Simulation Software's Used in Pharmacokinetics and Pharmacodynamics Analysis.Curr Clin Pharmacol. 2018;13(4):216-235. doi: 10.2174/1574884713666181025144845. Curr Clin Pharmacol. 2018. PMID: 30360723 Review.
References
-
- Cobelli C, Foster D. Compartmental models: theory and practice using the SAAM II software. Mathematical Modeling in Experimental Nutrition. Vol 445. Advances in Experimental Medicine and Biology. Springer; 1998:79‐101. - PubMed
-
- Cobelli C, Foster D, Toffolo G. Tracer Kinetics in Biomedical Research: from Data to Model. Springer Science & Business Media; 2007.
-
- Bonate PL. Pharmacokinetic‐Pharmacodynamic Modeling and Simulation. Springer US; 2011.
-
- DiStefano J. Dynamic Systems Biology Modeling and Simulation. Academic Press; 2015.
-
- Jacquez JA. Mones Berman. Math Biosci. 1984;72(2):127‐130.
MeSH terms
LinkOut - more resources
Full Text Sources
