. 2024 Aug;11(30):e2401059.
doi: 10.1002/advs.202401059. Epub 2024 Jun 11.

Burst firing in Output-Defined Parallel Habenula Circuit Underlies the Antidepressant Effects of Bright Light Treatment

Affiliations

Burst firing in Output-Defined Parallel Habenula Circuit Underlies the Antidepressant Effects of Bright Light Treatment

Xianwei Liu et al. Adv Sci (Weinh). 2024 Aug.

Abstract

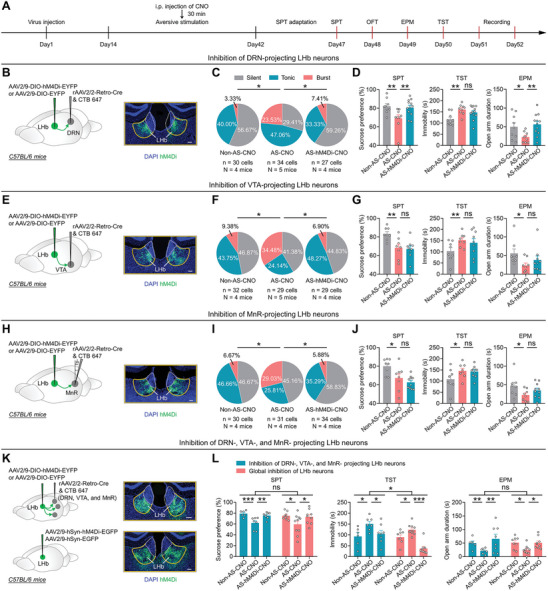
Research highlights the significance of increased bursting in lateral habenula (LHb) neurons in depression and as a focal point for bright light treatment (BLT). However, the precise spike patterns of LHb neurons projecting to different brain regions during depression, their roles in depression development, and BLT's therapeutic action remain elusive. Here, LHb neurons are found projecting to the dorsal raphe nucleus (DRN), ventral tegmental area (VTA), and median raphe nucleus (MnR) exhibit increased bursting following aversive stimuli exposure, correlating with distinct depressive symptoms. Enhanced bursting in DRN-projecting LHb neurons is pivotal for anhedonia and anxiety, while concurrent bursting in LHb neurons projecting to the DRN, VTA, and MnR is essential for despair. Remarkably, reducing bursting in distinct LHb neuron subpopulations underlies the therapeutic effects of BLT on specific depressive behaviors. These findings provide valuable insights into the mechanisms of depression and the antidepressant action of BLT.

Keywords: bright light treatment; burst firing; depression; lateral habenula; neural circuits.


Conflict of interest statement

The authors declare no conflict of interest.

Figures

Figure 1
Figure 1
Long‐term exposure to aversive stimuli increases burst firing in LHb→DRN, LHb→VTA, and LHb→MnR neurons. A) Schematic of the experimental design. B) Depressive‐like and anxiety‐like behaviors of mice in different experimental groups (Non‐AS: n = 12 mice; AS: N = 12 mice). Non‐AS, mice without exposure to AS; AS, mice that exposure to AS. Data presents Mean ± SEM; Two tail unpaired t‐test, *, < 0.05; **, < 0.01; ***, < 0.001; ns, no significant difference. C) Scheme for whole cell patch‐clamp recording of LHb→DRN, LHb→VTA, and LHb→MnR neurons. D) Representative traces showing spontaneous activity of silent, tonic firing, and burst firing LHb neurons. E–G) Scheme for specific infection of LHb→DRN neurons with EYFP. Scale bar: 100 µm E); Pie charts indicate percentages of the three types of LHb→DRN neurons in Non‐AS (n = 28 cells, N = 5 mice) and AS (n = 32 cells, N = 5 mice) groups. Data presents chi‐square test, *, < 0.05 F); RMP of Non‐bursting LHb→DRN neurons (n = 54 cells, N = 10 mice) and bursting LHb→DRN neurons (n = 6 cells, N = 10 mice) (left) and RMP of the LHb→DRN neurons in Non‐AS (n = 28 cells, N = 5 mice) and AS (n = 32 cells, N = 5 mice) groups (right), data presents Mean ± SEM; Two tail unpaired t‐test, *, < 0.05; ns, no significant difference G). All mice received DRN injection of rAAV2/2‐Retro‐Cre and CTB‐647, LHb injection of AAV2/9‐DIO‐EYFP. Non‐AS, mice without exposure to AS; AS, mice that exposure to AS. H‐J) Scheme for specific infection of LHb→VTA neurons with EYFP. Scale bar: 100 µm (H); Pie charts indicate percentages of the three types of LHb→VTA neurons in Non‐AS (n = 26 cells, N = 5 mice) and AS (n = 25 cells, N = 5 mice) groups. Data presents chi‐square test, *, < 0.05 (I); RMP of Non‐bursting LHb→VTA neurons (n = 40 cells, N = 10 mice) and bursting LHb→VTA neurons (n = 11 cells, N = 10 mice) (left), and RMP of the LHb→VTA neurons in Non‐AS (n = 26 cells, N = 5 mice) and AS (n = 25 cells, N = 5 mice) groups (right), data presents Mean ± SEM; Two tail unpaired t‐test, *, < 0.05; ***, < 0.001 J). All mice received VTA injection of rAAV2/2‐Retro‐Cre and CTB‐647, LHb injection of AAV2/9‐DIO‐EYFP. Non‐AS, mice without exposure to AS; AS, mice that exposure to AS. K–M) Scheme for specific infection of LHb→MnR neurons with EYFP. Scale bar: 100 µm K); Pie charts indicate percentages of the three types of LHb→MnR neurons in the Non‐AS (n = 34 cells, N = 5 mice), AS (n = 27 cells, N = 4 mice) groups. Data presents chi‐square test, *, < 0.05 L); RMP of the Non‐bursting LHb→MnR neurons (n = 51 cells, N = 9 mice) and bursting LHb→MnR neurons (n = 10 cells, N = 9 mice) (left), and RMP of LHb→MnR neurons in Non‐AS (n = 34 cells, N = 5 mice) and AS (n = 27 cells, N = 4 mice) groups (right), data presents Mean ± SEM; Two tail unpaired t‐test, *, < 0.05; ***, < 0.001 M). All mice received MnR injection of rAAV2/2‐Retro‐Cre and CTB‐647, LHb injection of AAV2/9‐DIO‐EYFP. Non‐AS, mice without exposure to AS; AS, mice that exposure to AS.
Figure 2
Figure 2
eNpHR3.0‐induced rebound bursting in LHb→DRN, LHb→VTA, and LHb→MnR neurons mediates distinct depressive‐like symptoms. A) Scheme for infection of LHb neurons with eNpHR3.0 and the optetrode implantation in LHb. B) Representative traces showing rebound bursts elicited by pulsed yellow light (1 Hz, 100 ms, 589 nm) in the LHb in vivo from mice infected with eNpHR3.0 (right); Percentage of successfully induced bursts (n = 22 cells, N = 4 mice) (middle); Raster plots (top) and post‐stimulus time histogram (bottom) of an example LHb neuron responding to yellow light stimulation from in vivo optetrode recording (left). C) Schematic of the experimental design. D,E) Scheme for specific infection of LHb→DRN neurons with eNpHR3.0 or mCherry. Scale bar: 100 µm D); Depressive‐like and anxiety‐like behaviors of mice in different experimental groups (mCherry: N = 8 mice; eNpHR3.0: N = 7 mice), data presents Mean ± SEM; Two tail unpaired t‐test, *, < 0.05; **, < 0.01. E); All mice received DRN injection of rAAV2/2‐Retro‐Cre and CTB‐647. mCherry, mice that received LHb injection of AAV2/9‐DIO‐mCherry; eNpHR3.0, mice that received LHb injection of AAV2/9‐DIO‐eNpHR3.0‐mCherry. F,G) Scheme for specific infection of LHb→VTA neurons with eNpHR3.0 or mCherry. Scale bar: 100 µm F); Depressive‐like and anxiety‐like behaviors of mice in different experimental groups (mCherry: N = 7 mice; eNpHR3.0: N = 7 mice), data presents Mean ± SEM; Two tail unpaired t‐test, *, < 0.05; ns, no significant difference G). All mice received VTA injection of rAAV2/2‐Retro‐Cre and CTB‐647. mCherry, mice that received LHb injection of AAV2/9‐DIO‐mCherry; eNpHR3.0, mice that received LHb injection of AAV2/9‐DIO‐eNpHR3.0‐mCherry. H,I) Scheme for specific infection of LHb→MnR neurons with eNpHR3.0 or mCherry. Scale bar: 100 µm H); Depressive‐like and anxiety‐like behaviors of mice in different experimental groups (mCherry: N = 7 mice; eNpHR3.0: N = 8 mice), data presents Mean ± SEM; Two tail unpaired t‐test, *, < 0.05; ns, no significant difference (I). All mice received MnR injection of rAAV2/2‐Retro‐Cre and CTB‐647. mCherry, mice that received LHb injection of AAV2/9‐DIO‐mCherry; eNpHR3.0, mice that received LHb injection of AAV2/9‐DIO‐eNpHR3.0‐mCherry.
Figure 3
Figure 3
Long‐term activation induces burst firing in LHb→DRN, LHb→VTA, and LHb→MnR neurons and mediates distinct depressive‐like symptoms. A) Schematic of the experimental design. B‐D) Scheme for specific infection of LHb→DRN neurons with hM3Dq or EGFP. Scale bar: 100 µm (B); Pie charts indicate percentages of the three types of LHb→DRN neurons in the EGFP‐CNO (n = 27 cells, N = 5 mice) and hM3Dq‐CNO (n = 31 cells, N = 4 mice) groups, data presents chi‐square test, *, < 0.05 C); Depressive‐like and anxiety‐like behaviors of mice in different experimental groups (EGFP‐CNO: N = 7 mice; hM3Dq‐CNO: N = 8 mice), data presents Mean ± SEM; Two tail unpaired t‐test, *, < 0.05. D). All mice received DRN injection of rAAV2/2‐Retro‐Cre and CTB‐647. EGFP‐CNO, mice that received LHb injection of AAV2/9‐DIO‐EGFP and i.p. injection of CNO (1 mg kg−1); hM3Dq‐CNO, mice that received LHb injection of AAV2/9‐DIO‐hM3Dq‐EGFP and i.p. injection of CNO (1 mg kg−1). E–G) Scheme for specific infection of LHb→VTA neurons with hM3Dq or EGFP. Scale bar: 100 µm E); Pie charts indicate percentages of the three types of LHb→VTA neurons in the EGFP‐CNO (n = 34 cells, N = 4 mice) and hM3Dq‐CNO (n = 30 cells, N = 4 mice) groups, data presents chi‐square test, *, < 0.05 F); Depressive‐like and anxiety‐like behaviors of mice in different experimental groups (EGFP‐CNO: N = 7 mice; hM3Dq‐CNO: N = 8 mice), data presents Mean ± SEM; Two tail unpaired t‐test (the SPT and the TST), Mann‐Whitney U test (the EPM), **, < 0.01; ns, no significant difference. G). All mice received VTA injection of rAAV2/2‐Retro‐Cre and CTB‐647. EGFP‐CNO, mice that received LHb injection of AAV2/9‐DIO‐EGFP and i.p. injection of CNO (1 mg kg−1); hM3Dq‐CNO, mice that received LHb injection of AAV2/9‐DIO‐hM3Dq‐EGFP and i.p. injection of CNO (1 mg kg−1). H–J) Scheme for specific infection of LHb→MnR neurons with hM3Dq or EGFP. Scale bar: 100 µm H); Pie charts indicate percentages of the three types of LHb→MnR neurons in the EGFP‐CNO (n = 30 cells, N = 5 mice) and hM3Dq‐CNO (n = 25 cells, N = 4 mice) groups, data presents chi‐square test, *, < 0.05 I); Depressive‐like and anxiety‐like behaviors of mice in different experimental groups (EGFP‐CNO: N = 8 mice; hM3Dq‐CNO: N = 9 mice), data presents Mean ± SEM; Two tail unpaired t‐test, *, < 0.05; ns, no significant difference J). All mice received MnR injection of rAAV2/2‐Retro‐Cre and CTB‐647. EGFP‐CNO, mice that received LHb injection of AAV2/9‐DIO‐EGFP and i.p. injection of CNO (1 mg kg−1); hM3Dq‐CNO, mice that received LHb injection of AAV2/9‐DIO‐hM3Dq‐EGFP and i.p. injection of CNO (1 mg kg−1).
Figure 4
Figure 4
Long‐term exposure to aversive stimuli induces depressive‐like symptoms, which require burst firing in LHb→DRN, LHb→VTA, and LHb→MnR neurons. A) Schematic of the experimental design. B–D) Scheme for specific infection of LHb→DRN neurons with hM4Di or EYFP. Scale bar: 100 µm B); Pie charts indicate percentages of the three types of LHb→DRN neurons in Non‐AS‐CNO (n = 30 cells, N = 4 mice), AS‐CNO (n = 34 cells, N = 5 mice) and AS‐hM4Di‐CNO (n = 27 cells, N = 4 mice) groups, data presents chi‐square test, *, < 0.05C); Depressive‐like and anxiety‐like behaviors of mice in different experimental groups (Non‐AS‐CNO: N = 9 mice; AS‐CNO: N = 9 mice; AS‐hM4Di‐CNO: N = 12 mice), data presents Mean ± SEM; One‐way ANOVA with post hoc LSD test, *, < 0.05; **, < 0.01; ns, no significant difference D). All mice received DRN injection of rAAV2/2‐Retro‐Cre and CTB‐647. Non‐AS‐CNO, mice that received LHb injection of AAV2/9‐DIO‐EYFP, i.p. injection of CNO (1 mg kg−1), and no exposure to AS; AS‐CNO, mice that received LHb injection of AAV2/9‐DIO‐EYFP, i.p. injection of CNO (1 mg kg−1), and exposure to AS; AS‐hM4Di‐CNO: mice that received LHb injection of AAV2/9‐DIO‐hM4Di‐EYFP, i.p. injection of CNO (1 mg kg−1), and exposure to AS. E–G) Scheme for specific infection of LHb→VTA neurons with hM4Di or EYFP. Scale bar: 100 µm E); Pie charts indicate percentages of the three types of LHb→VTA neurons in Non‐AS‐CNO (n = 32 cells, N = 4 mice), AS‐CNO (n = 29 cells, N = 5 mice), and AS‐hM4Di‐CNO (n = 29 cells, N = 4 mice) groups, data presents chi‐square test, *, < 0.05 F); Depressive‐like and anxiety‐like behaviors of mice in different experimental groups (Non‐AS‐CNO: N = 8 mice; AS‐CNO: N = 8 mice; AS‐hM4Di‐CNO: N = 9 mice), data presents Mean ± SEM; One‐way ANOVA with post hoc LSD test, *, < 0.05; **, < 0.01; ns, no significant difference G). All mice received VTA injection of rAAV2/2‐Retro‐Cre and CTB‐647. Non‐AS‐CNO, mice that received LHb injection of AAV2/9‐DIO‐EYFP, i.p. injection of CNO (1 mg kg−1), and no exposure to AS; AS‐CNO, mice that received LHb injection of AAV2/9‐DIO‐EYFP, i.p. injection of CNO (1 mg kg−1), and exposure to AS; AS‐hM4Di‐CNO, mice that received LHb injection of AAV2/9‐DIO‐hM4Di‐EYFP, i.p. injection of CNO (1 mg kg−1), and exposure to AS. H–J) Scheme for specific infection of LHb→MnR neurons with hM4Di or EYFP. Scale bar: 100 µm H); Pie charts indicate percentages of the three types of LHb→MnR neurons in Non‐AS‐CNO (n = 30 cells, N = 4 mice), AS‐CNO (n = 31 cells, N = 4 mice), and AS‐hM4Di‐CNO (n = 34 cells, N = 4 mice) groups, data presents chi‐square test, *, < 0.05 I); Depressive‐like and anxiety‐like behaviors of mice in different experimental groups (Non‐AS‐CNO: N = 8 mice; AS‐CNO: N = 8 mice; AS‐hM4Di‐CNO: N = 10 mice), data presents Mean ± SEM; One‐way ANOVA with post hoc LSD test, *, < 0.05; ns, no significant difference J). All mice received MnR injection of rAAV2/2‐Retro‐Cre and CTB‐647. Non‐AS‐CNO, mice that received LHb injection of AAV2/9‐DIO‐EYFP, i.p. injection of CNO (1 mg kg−1), and no exposure to AS; AS‐CNO, mice that received LHb injection of AAV2/9‐DIO‐EYFP, i.p. injection of CNO (1 mg kg−1), and exposure to AS; AS‐hM4Di‐CNO, mice that received LHb injection of AAV2/9‐DIO‐hM4Di‐EYFP, i.p. injection of CNO (1 mg kg−1), and exposure to AS. K,L) Scheme for simultaneous infection of LHb→DRN, LHb→VTA, and LHb→MnR neurons with hM4Di or EYFP (top); Scheme for global infection of LHb neurons with hM4Di or EGFP. Scale bar: 100 µm (bottom) (K); Depressive‐like and anxiety‐like behaviors of mice in different experimental groups (blue label: Non‐AS‐CNO: N = 6 mice; AS‐CNO: N = 7 mice; AS‐hM4Di‐CNO: N = 8 mice) (red label: Non‐AS‐CNO: N = 8 mice; AS‐CNO: N = 10 mice; AS‐hM4Di‐CNO: N = 9 mice), data presents Mean ± SEM; One‐way ANOVA with post hoc LSD test and Two‐way ANOVA with Sidak's multiple‐comparisons test, *, < 0.05; **, <0.01; ***, <0.001; ns, no significant difference L). For simultaneous inhibition of LHb→DRN, LHb→VTA, and LHb→MnR neurons, all mice received DRN, VTA and MnR injection of rAAV2/2‐Retro‐Cre and CTB‐647, and LHb injection of AAV2/9‐DIO‐EYFP or AAV2/9‐DIO‐hM4Di‐EYFP. For global inhibition of LHb neurons, all mice received LHb injection of AAV2/9‐hSyn‐EGFP or AAV2/9‐hSyn‐hM4Di‐EGFP. Non‐AS‐CNO, mice with EYFP or EGFP expressed in LHb, received i.p. injection of CNO (1 mg kg−1), and no exposure to AS; AS‐CNO, mice with EYFP or EGFP expressed in LHb, received i.p. injection of CNO (1 mg kg−1), and exposure to AS; AS‐hM4Di‐CNO: mice with hM4Di expressed in LHb, received i.p. injection of CNO (1 mg kg−1), and exposure to AS.
Figure 5
Figure 5
BLT decreases aversive stimuli‐induced burst firing in LHb→DRN, LHb→VTA, and LHb→MnR neurons. A) Scheme for specific infection of LHb neurons receiving vLGN/IGL inputs with EYFP (right); Representative images of axons in the DRN, VTA and MnR from LHb postsynaptic neurons receiving vLGN/IGL inputs (left). Scale bar: 100 µm. B) Schematic of the experimental design. C) Depressive‐like behaviors of mice in different experimental groups (Non‐AS: N = 10 mice; AS: N = 10 mice; BLT‐AS: N = 10 mice), data presents Mean ± SEM; One‐way ANOVA with post hoc LSD test, **, < 0.01; ***, < 0.001. Non‐AS, mice that without exposure to AS; AS, mice that exposure to AS; BLT‐AS, mice that exposure to AS and received BLT. D‐F) Scheme for specific infection of LHb→DRN neurons with EYFP D); Pie charts indicate percentages of the three types of LHb→DRN neurons in Non‐AS (n = 27 cells, N = 5 mice), AS (n = 35 cells, N = 6 mice) and BLT‐AS (n = 32 cells, N = 5 mice) groups, data presents chi‐square test, *, < 0.05 E); RMP of Non‐bursting LHb→DRN neurons (n = 85 cells, N = 16 mice) and bursting LHb→DRN neurons (n = 9 cells, N = 16 mice) (left), and RMP of the LHb→DRN neurons in Non‐AS (n = 27 cells, N = 5 mice), AS (n = 35 cells, N = 6 mice) and BLT‐AS (n = 32 cells, N = 5 mice) groups (right), data presents Mean ± SEM; Two tail unpaired t‐test and One‐way ANOVA with post hoc LSD test, ***, < 0.001; ns, no significant difference F). All mice received DRN injection of rAAV2/2‐Retro‐Cre and LHb injection of AAV2/9‐DIO‐EYFP. Non‐AS, mice without exposure to AS; AS, mice that exposure to AS; BLT‐AS, mice that exposure to AS and received BLT. G–I) Scheme for specific infection of LHb→VTA neurons with EYFP G); Pie charts indicate percentages of the three types of LHb→VTA neurons in Non‐AS (n = 23 cells, N = 5 mice), AS (n = 23 cells, N = 4 mice) and BLT‐AS (n = 27 cells, N = 4 mice) groups, data presents chi‐square test, *, < 0.05 (H); RMP of Non‐bursting LHb→VTA neurons (n = 62 cells, N = 13 mice) and bursting LHb→VTA neurons (n = 11 cells, N = 13 mice) (left), and RMP of the LHb→VTA neurons in Non‐AS (n = 23 cells, N = 5 mice), AS (n = 23 cells, N = 4 mice) and BLT‐AS (n = 27 cells, N = 4 mice) groups (right), data presents Mean ± SEM; Two tail unpaired t‐test and One‐way ANOVA with post hoc LSD test, *, < 0.05; **, < 0.01; ***, < 0.001 I). All mice received VTA injection of rAAV2/2‐Retro‐Cre and LHb injection of AAV2/9‐DIO‐EYFP. Non‐AS, mice without exposure to AS; AS, mice that exposure to AS; BLT‐AS, mice that exposure to AS and received BLT. J–L) Scheme for specific infection of LHb→MnR neurons with EYFP (J); Pie charts indicate percentages of the three types of LHb→MnR neurons in Non‐AS (n = 35 cells, N = 5 mice), AS (n = 29 cells, N = 5 mice) and BLT‐AS (n = 28 cells, N = 4 mice) groups, data presents chi‐square test, *, < 0.05 K); RMP of Non‐bursting LHb→MnR neurons (n = 79 cells, N = 14 mice) and bursting LHb→MnR neurons (n = 13 cells, N = 14 mice) (left), and RMP of the LHb→MnR neurons in Non‐AS (n = 35 cells, N = 5 mice), AS (n = 29 cells, N = 5 mice) and BLT‐AS (n = 28 cells, N = 4 mice) groups (right), data presents Mean ± SEM; Two tail unpaired t‐test and One‐way ANOVA with post hoc LSD test, *, < 0.05; ***, < 0.001 L). All mice received MnR injection of rAAV2/2‐Retro‐Cre and LHb injection of AAV2/9‐DIO‐EYFP. Non‐AS, mice without exposure to AS; AS, mice that exposure to AS; BLT‐AS, mice that exposure to AS and received BLT.
Figure 6
Figure 6
The antidepressant effect of BLT requires the inhibition of burst firing in LHb→DRN, LHb→VTA, and LHb→MnR neurons. A) Schematic of the experimental design. B,C) Scheme for specific infection of LHb→DRN neurons with hM3Dq or EGFP, Scale bar: 100 µm B); Depressive‐like behaviors of mice in different experimental groups (Non‐AS‐CNO: N = 7 mice; AS‐CNO: N = 7 mice; BLT‐AS‐CNO: N = 9 mice; BLT‐AS‐hM3Dq‐CNO: N = 8 mice), data presents Mean ± SEM; One‐way ANOVA with post hoc LSD test, *, < 0.05; ***, < 0.001; ns, no significant difference C). All mice received DRN injection of rAAV2/2‐Retro‐Cre and CTB‐647. Non‐AS‐CNO, mice that received LHb injection of AAV2/9‐DIO‐EGFP, i.p. injection of CNO (1 mg kg−1), and no exposure to AS; AS‐CNO, mice that received LHb injection of AAV2/9‐DIO‐EGFP, i.p. injection of CNO (1 mg kg−1), and exposure to AS; BLT‐AS‐CNO, mice that received LHb injection of AAV2/9‐DIO‐EGFP, i.p. injection of CNO (1 mg kg−1), BLT, and exposure to AS; BLT‐AS‐hM3Dq‐CNO, mice that received LHb injection of AAV2/9‐DIO‐hM3Dq‐EGFP, i.p. injection of CNO (1 mg kg−1), BLT, and exposure to AS. D,E) Scheme for specific infection of LHb→VTA neurons with hM3Dq or EGFP, Scale bar: 100 µm D); Depressive‐like behaviors of mice in different experimental groups (Non‐AS‐CNO: N = 6 mice; AS‐CNO: N = 6 mice; BLT‐AS‐CNO: N = 8 mice; BLT‐AS‐hM3Dq‐CNO: N = 8 mice), data presents Mean ± SEM; One‐way ANOVA with post hoc LSD test, *, < 0.05; **, < 0.01; ***, < 0.001; ns, no significant difference E). All mice received VTA injection of rAAV2/2‐Retro‐Cre and CTB‐647. Non‐AS‐CNO, mice that received LHb injection of AAV2/9‐DIO‐EGFP, i.p. injection of CNO (1 mg kg−1), and no exposure to AS; AS‐CNO, mice that received LHb injection of AAV2/9‐DIO‐EGFP, i.p. injection of CNO (1 mg kg−1), and exposure to AS; BLT‐AS‐CNO, mice that received LHb injection of AAV2/9‐DIO‐EGFP, i.p. injection of CNO (1 mg kg−1), BLT, and exposure to AS; BLT‐AS‐hM3Dq‐CNO, mice that received LHb injection of AAV2/9‐DIO‐hM3Dq‐EGFP, i.p. injection of CNO (1 mg kg−1), BLT, and exposure to AS. F,G) Scheme for specific infection of LHb→MnR neurons with hM3Dq or EGFP, Scale bar: 100 µm F); Depressive‐like behaviors of mice in different experimental groups (Non‐AS‐CNO: N = 6 mice; AS‐CNO: N = 6 mice; BLT‐AS‐CNO: N = 8 mice; BLT‐AS‐hM3Dq‐CNO: N = 8 mice), data presents Mean ± SEM; One‐way ANOVA with post hoc LSD test, *, < 0.05; **, < 0.01; ns, no significant difference G). All mice received MnR injection of rAAV2/2‐Retro‐Cre and CTB‐647. Non‐AS‐CNO, mice that received LHb injection of AAV2/9‐DIO‐EGFP, i.p. injection of CNO (1 mg kg−1), and no exposure to AS; AS‐CNO, mice that received LHb injection of AAV2/9‐DIO‐EGFP, i.p. injection of CNO (1 mg kg−1), and exposure to AS; BLT‐AS‐CNO, mice that received LHb injection of AAV2/9‐DIO‐EGFP, i.p. injection of CNO (1 mg kg−1), BLT, and exposure to AS; BLT‐AS‐hM3Dq‐CNO, mice that received LHb injection of AAV2/9‐DIO‐hM3Dq‐EGFP, i.p. injection of CNO (1 mg kg−1), BLT, and exposure to AS. H‐I) Scheme for simultaneous infection of LHb→DRN, LHb→VTA, and LHb→MnR neurons with hM3Dq or EGFP. Scale bar: 100 µm (H); Depressive‐like behaviors of mice in different experimental groups (Non‐AS‐CNO: N = 7 mice; AS‐CNO: N = 8 mice; BLT‐AS‐CNO: N = 9 mice; BLT‐AS‐hM3Dq‐CNO: N = 10 mice), data presents Mean ± SEM; One‐way ANOVA with post hoc LSD test, **, < 0.01; ***, < 0.001 I). All mice received DRN, VTA, and MnR injection of rAAV2/2‐Retro‐Cre and CTB‐647. Non‐AS‐CNO, mice that received LHb injection of AAV2/9‐DIO‐EGFP, i.p. injection of CNO (1 mg kg−1), and no exposure to AS; AS‐CNO, mice that received LHb injection of AAV2/9‐DIO‐EGFP, i.p. injection of CNO (1 mg kg−1), and exposure to AS; BLT‐AS‐CNO, mice that received LHb injection of AAV2/9‐DIO‐EGFP, i.p. injection of CNO (1 mg kg−1), BLT, and exposure to AS; BLT‐AS‐hM3Dq‐CNO, mice that received LHb injection of AAV2/9‐DIO‐hM3Dq‐EGFP, i.p. injection of CNO (1 mg kg−1), BLT, and exposure to AS.

Similar articles

Cited by

References

    1. a) Collins P. Y., Patel V., Joestl S. S., March D., Insel T. R., Daar A. S., Board S. A., Gl E. C. G. C., Nature 2011, 475, 27; - PMC - PubMed
    2. b) Kessler R. C., Berglund P., Demler O., Jin R., Koretz D., Merikangas K. R., Rush A. J., Walters E. E., Wang P. S., Jama‐J Am Med Assoc 2003, 289, 3095; - PubMed
    3. c) Lépine J. P., Briley M., Neuropsychiatr Dis Treat 2011, 7, 3; - PMC - PubMed
    4. d) Pizzagalli D. A., Annu Rev Clin Psychol 2014, 10, 393. - PMC - PubMed
    1. a) Krishnan V., Nestler E. J., Am J Psychiat 2010, 167, 1305; - PMC - PubMed
    2. b) Kaufman J., Charney D., Depress Anxiety 2000, 12, 69; - PubMed
    3. c) Kennedy S. H., Dialogues Clin Neurosci 2008, 10, 271; - PMC - PubMed
    4. d) Ressler K. J., Mayberg H. S., Nat. Neurosci. 2007, 10, 1116,. - PMC - PubMed
    1. a) Huang L., Xi Y., Peng Y. F., Yang Y., Huang X. D., Fu Y. W., Tao Q., Xiao J., Yuan T. F., An K., Zhao H., Pu M. L., Xu F. Q., Xue T., Luo M. M., So K. F., Ren C. R., Neuron 2019, 102, 128; - PubMed
    2. b) Hu H. L., Cui Y. H., Yang Y., Nat. Rev. Neurosci. 2020, 21, 277; - PubMed
    3. c) Yang Y., Wang H., Hu J., Hu H. L., Curr. Opin. Neurobiol. 2018, 48, 90; - PubMed
    4. d) Matsumoto M., Hikosaka O., Nature 2007, 447, 1111; - PubMed
    5. e) Proulx C. D., Hikosaka O., Malinow R., Nat. Neurosci. 2014, 17, 1146; - PMC - PubMed
    6. f) Lecca S., Pelosi A., Tchenio A., Moutkine I., Lujan R., Hervé D., Mameli M., Nat. Med. 2016, 22, 254,. - PubMed
    1. a) Stamatakis A. M., Stuber G. D., Nat. Neurosci. 2012, 15, 1105; - PMC - PubMed
    2. b) Baker P. M., Jhou T., Li B., Matsumoto M., Mizumori S. J., Stephenson‐Jones M., Vicentic A., J. Neurosci. 2016, 36, 11482,. - PMC - PubMed
    1. a) Lin S., Huang L., Luo Z. C., Li X., Jin S. Y., Du Z. J., Wu D. Y., Xiong W. C., Huang L., Luo Z. Y., Song Y. L., Wang Q., Liu X. W., Ma R. J., Wang M. L., Ren C. R., Yang J. M., Gao T. M., Biol. Psychiatry 2022, 92, 179; - PubMed
    2. b) Matsumoto M., Hikosaka O., Nat. Neurosci. 2009, 12, 77; - PMC - PubMed
    3. c) Ullsperger M., von Cramon D. Y., J. Neurosci. 2003, 23, 4308,. - PMC - PubMed

LinkOut - more resources