. 2024 Aug 1;132(2):322-334.
doi: 10.1152/jn.00177.2024. Epub 2024 Jun 12.

Oxygen fluctuations in the brain and periphery induced by intravenous fentanyl: effects of dose and drug experience

Affiliations

Oxygen fluctuations in the brain and periphery induced by intravenous fentanyl: effects of dose and drug experience

Shinbe Choi et al. J Neurophysiol. .

Abstract

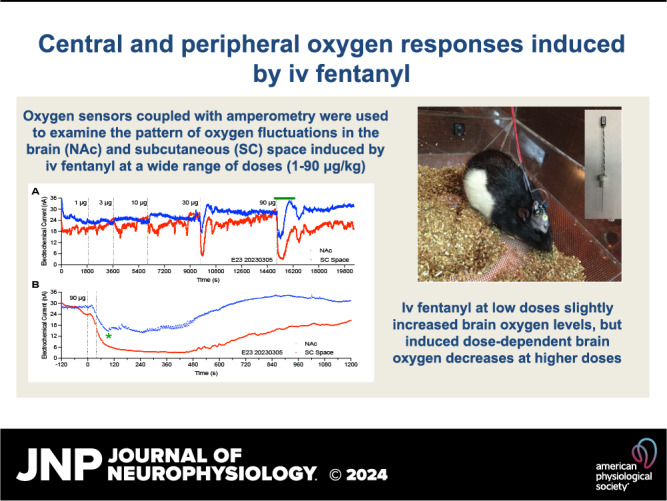
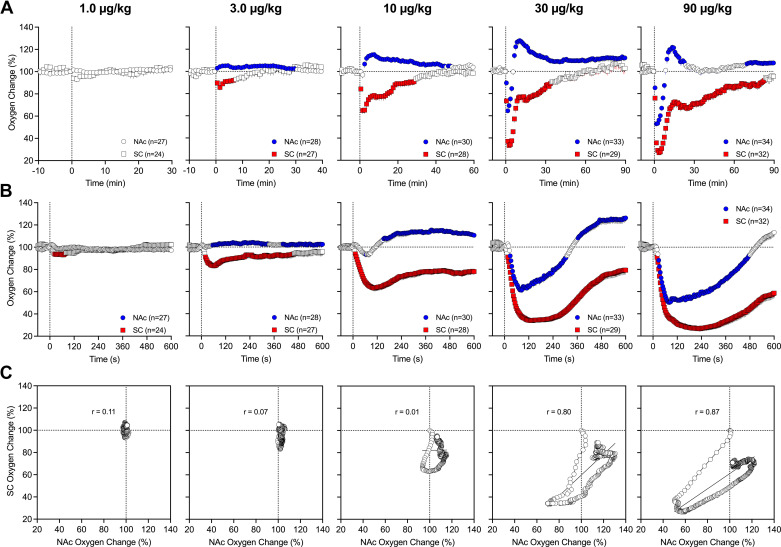
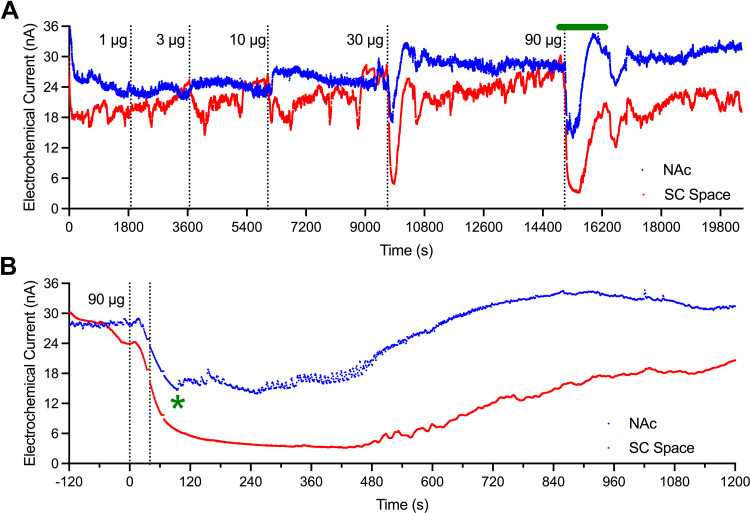
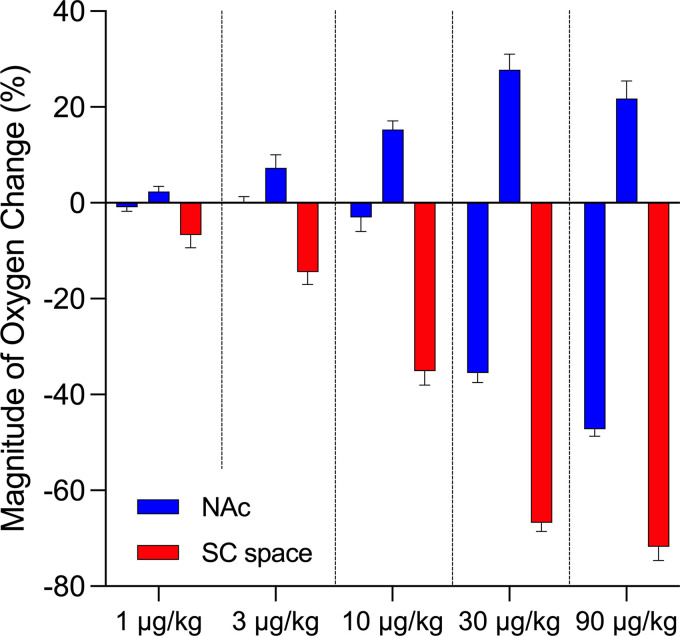
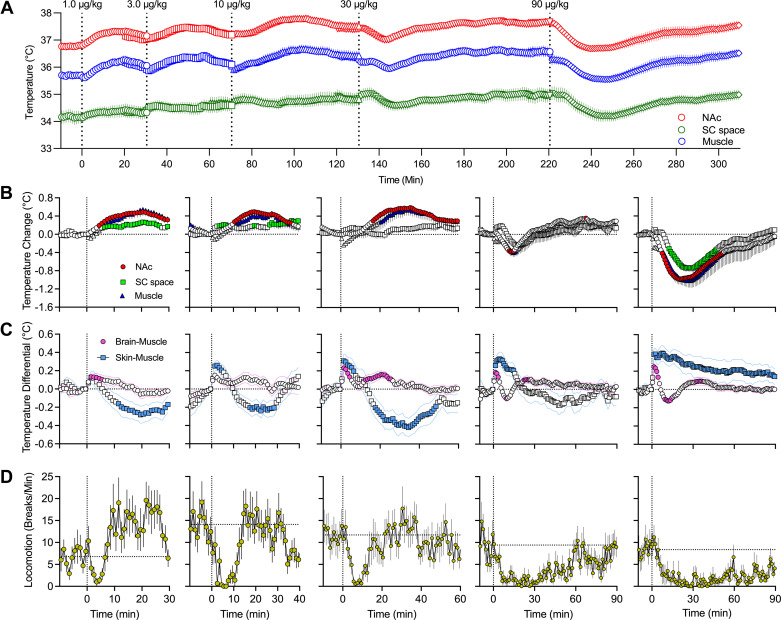
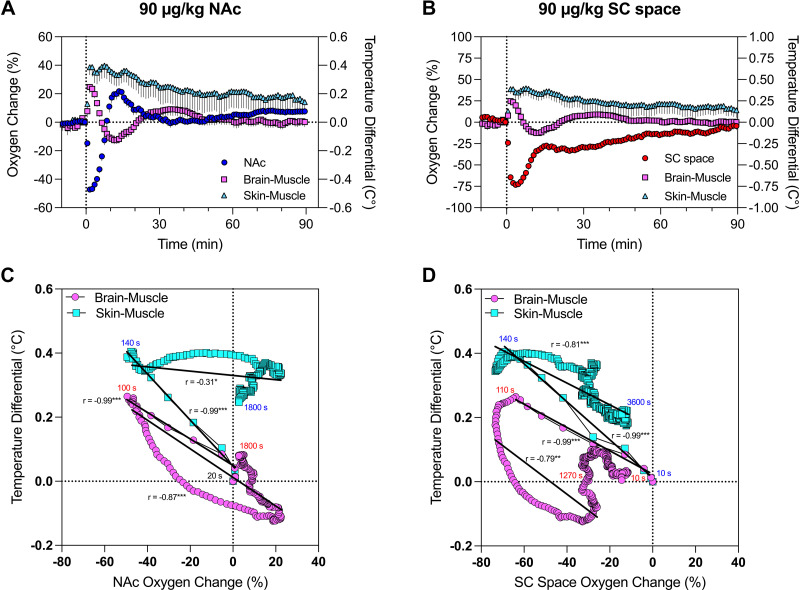
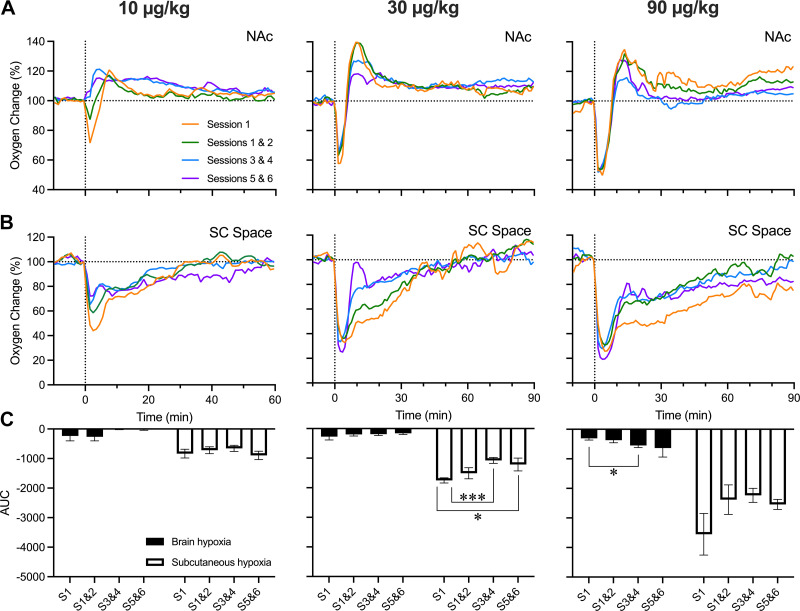
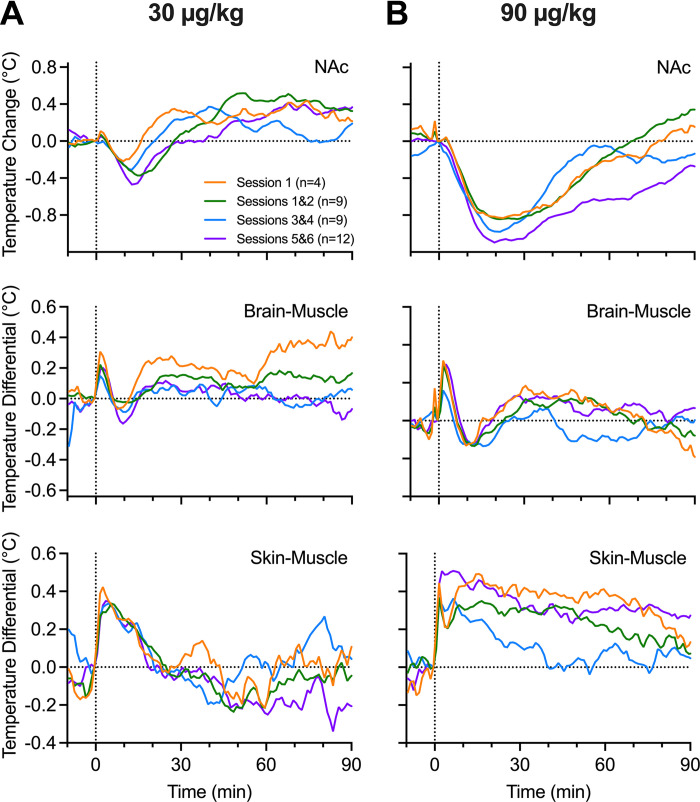
Fentanyl is the leading contributor to drug overdose deaths in the United States. Its potency, rapid onset of action, and lack of effective reversal treatment make the drug much more lethal than other opioids. Although it is understood that fentanyl is dangerous at higher doses, the literature surrounding fentanyl's physiological effects remains contradictory at lower doses. To explore this discrepancy, we designed a study incorporating electrochemical assessment of oxygen in the brain (nucleus accumbens) and subcutaneous space, multisite thermorecording (brain, skin, muscle), and locomotor activity at varying doses of fentanyl (1.0, 3.0, 10, 30, and 90 µg/kg) in rats. In the nucleus accumbens, lower doses of fentanyl (3.0 and 10 µg/kg) led to an increase in oxygen levels while higher doses (30 and 90 µg/kg) led to a biphasic pattern, with an initial dose-dependent decrease followed by an increase. In the subcutaneous space, oxygen decreases started to appear at relatively lower doses (>3 µg/kg), had shorter onset latencies, and were stronger and prolonged. In the temperature experiment, lower doses of fentanyl (1.0, 3.0, and 10 µg/kg) led to an increase in brain, skin, and muscle temperatures, while higher doses (30 and 90 µg/kg) resulted in a dose-dependent biphasic temperature change, with an increase followed by a prolonged decrease. We also compared oxygen and temperature responses induced by fentanyl over six consecutive days and found no evidence of tolerance in both parameters. In conclusion, we report that fentanyl's effects are highly dose-dependent, drawing attention to the importance of better characterization to adequately respond in emergent cases of illicit fentanyl misuse.NEW & NOTEWORTHY By using electrochemical oxygen sensors in freely moving rats, we show that intravenous fentanyl induces opposite changes in brain oxygen at varying doses, increasing at lower doses (<10 µg/kg) and inducing a biphasic response, decrease followed by increase, at higher doses (>10-90 µg/kg). In contrast, fentanyl-induced dose-dependent oxygen decreases in the subcutaneous space. We consider the mechanisms underlying distinct oxygen responses in the brain and periphery and discuss naloxone's role in alleviating fentanyl-induced brain hypoxia.

Keywords: brain hyperoxia; central vasodilation; hyperthermia; hypothermia; peripheral vasoconstriction.


Conflict of interest statement

No conflicts of interest, financial or otherwise, are declared by the authors.

Figures

None
Graphical abstract
Figure 1.
Figure 1.
Mean ± SE changes in oxygen levels in the nucleus accumbens (NAc) and subcutaneous (SC) space induced by intravenous fentanyl: dose dependence. A: slow (1-min bins) changes in oxygen levels calculated in percent vs. the preinjection baseline (100%). B: rapid (4-s bins) changes vs. the preinjection baseline (100%). Filled symbols show values significantly different from the preinjection baseline; n, number of averaged oxygen responses. C: correlative relationships in oxygen dynamics between the 2 recording locations. Each graph depicts a regression line and a coefficient of correlation between NAc and subcutaneous space oxygen change. Vertical dashed lines in A and B show moments of drug injections.
Figure 2.
Figure 2.
Representative single-session record of changes in reduction currents recorded from the nucleus accumbens (NAc; blue) and subcutaneous (SC) space (red) with repeated injections of fentanyl at different doses (A). Original data (1-s bins) were transported from the recording software into the Prism program, then inverted. The bolded green line above A represents the time interval that is magnified and shown in B. Vertical dashed lines show the timing of drug injections. Green asterisk in B shows the time of the first breath after apnea. Subsequent fluctuations in NAc current were associated with individual breaths. These fluctuations were absent in currents recorded from the subcutaneous space.
Figure 3.
Figure 3.
Fentanyl-induced changes in oxygen responses in the brain and peripheral tissue: dose dependance. Bar graphs show mean ± SE changes in amplitude of oxygen responses induced by fentanyl at 1, 3, 10, 30, and 90 μg/kg doses. Red graphs show changes in subcutaneous (SC) space and blue graphs show mean amplitude for both the initial decrease and subsequent increase in nucleus accumbens (NAc). Mean amplitudes of oxygen decreases and increases were calculated as an average of maximal increases and decreases in individual tests. Vertical dashed lines separate effects at different doses.
Figure 4.
Figure 4.
Mean ± SE changes of different temperature parameters induced by intravenous fentanyl: dose dependence. A: slow absolute changes in temperature in the nucleus accumbens (NAc), temporal muscle, and subcutaneous (SC) space. B: relative temperature responses for each dose of fentanyl. C: changes in NAc-muscle and subcutaneous space-muscle temperature differentials. D: changes in locomotion for each fentanyl dose. Filled symbols in B and C show values significantly different from preinjection baseline. Vertical dashed lines in all graphs show the timings of fentanyl injections. Horizonal dashed lines in AC show basal levels (level of no change = 0°C) and in D show mean basal locomotion for 10 min before fentanyl injections. Locomotor activity was measured using four photobeams located at the chamber’s walls and quantified in photobeam breaks per minute.
Figure 5.
Figure 5.
Correlative relationships between fentanyl-induced changes in brain and peripheral oxygen and temperature parameters. A and B: mean ± SE oxygen changes in nucleus accumbens (NAc; A) and subcutaneous (SC) space (B) assessed in relation to the 2 temperature differentials induced by intravenous fentanyl at a 90 μg/kg dose. C and D: correlative relationships between changes in NAc oxygen (C) and subcutaneous space (D) and the 2 temperature differentials. Each curve has coefficient of correlation (r) and regression lines (*P < 0.05; **P < 0.01; ***P < 0.001). Note that data shown in A and C have different y-axis scales.
Figure 6.
Figure 6.
Changes in oxygen responses in the nucleus accumbens (NAc; A) and subcutaneous (SC) space (B) across grouped daily sessions. Data are shown for 3 doses of fentanyl: 10, 30, and 90 μg/kg. C: mean changes in fentanyl-induced oxygen decreases (area under the curve) in the brain and subcutaneous space for 3 doses of fentanyl. Vertical dashed lines in all graphs show the timings of fentanyl injections and horizonal dashed lines show basal levels (level of no change = 0°C). AUC, area under the curve; S, session. *P < 0.05; ***P < 0.001, statistical significance of between-session oxygen responses.
Figure 7.
Figure 7.
Mean changes in nucleus accumbens (NAc) oxygen, brain-muscle differentials, and skin-muscle differentials across grouped treatment sessions for fentanyl at 30 μg/kg (A) and 90 μg/kg (B). Vertical dashed lines in all graphs show the timing of fentanyl injections and horizonal dashed lines show basal levels (level of no change = 0°C). S, session.

Comment in

Similar articles

Cited by

References

    1. Friedman J, Montero F, Bourgois P, Wahbi R, Dye D, Goodman-Meza D, Shover C. Xylazine spreads across the US: a growing component of the increasingly synthetic and polysubstance overdose crisis. Drug Alcohol Depend 233: 109380, 2022. doi: 10.1016/j.drugalcdep.2022.109380. - DOI - PMC - PubMed
    1. Han Y, Yan W, Zheng Y, Khan Z, Yan K, Lu L. The rising crisis of elicit fentanyl use, overdose, and potential therapeutic strategies. Transl Psychiatry 9: 282, 2019. doi: 10.1038/s41398-019-0625-0. - DOI - PMC - PubMed
    1. Compton VM, Valentino RJ, DuPont RL. Polysubstance use in the U.S. opioid crisis. Mol Psychiatry 26: 41–50, 2021. doi: 10.1038/s41380-020-00949-3. - DOI - PMC - PubMed
    1. Skolnick P. Treatment of overdose in the synthetic opioid era. Pharmacol Ther 233: 108019, 2022. doi: 10.1016/j.pharmthera.2021.108019. - DOI - PubMed
    1. Jaffe JH, Knapp CM, Ciraulo DA. Opiates: clinical aspects. In: Substance Abuse (3rd ed.), edited by Lowinson JH, Ruiz P, Millman RB, Langrod JG. Baltimore, MD: Williams & Wilkins, 2005, p. 158–166.

Publication types

LinkOut - more resources