Bioprocess monitoring applications of an innovative ATR-FTIR spectroscopy platform
- PMID: 38863496
- PMCID: PMC11165065
- DOI: 10.3389/fbioe.2024.1349473
Bioprocess monitoring applications of an innovative ATR-FTIR spectroscopy platform
Abstract
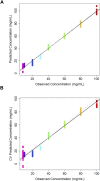
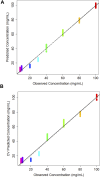
Pharmaceutical manufacturing is reliant upon bioprocessing approaches to generate the range of therapeutic products that are available today. The high cost of production, susceptibility to process failure, and requirement to achieve consistent, high-quality product means that process monitoring is paramount during manufacturing. Process analytic technologies (PAT) are key to ensuring high quality product is produced at all stages of development. Spectroscopy-based technologies are well suited as PAT approaches as they are non-destructive and require minimum sample preparation. This study explored the use of a novel attenuated total reflection Fourier transform infrared (ATR-FTIR) spectroscopy platform, which utilises disposable internal reflection elements (IREs), as a method of upstream bioprocess monitoring. The platform was used to characterise organism health and to quantify cellular metabolites in growth media using quantification models to predict glucose and lactic acid levels both singularly and combined. Separation of the healthy and nutrient deficient cells within PC space was clearly apparent, indicating this technique could be used to characterise these classes. For the metabolite quantification, the binary models yielded R 2 values of 0.969 for glucose, 0.976 for lactic acid. When quantifying the metabolites in tandem using a multi-output partial least squares model, the corresponding R 2 value was 0.980. This initial study highlights the suitability of the platform for bioprocess monitoring and paves the way for future in-line developments.
Keywords: bioprocess monitoring; bioprocessing; fourier transform infrared spectroscopy (FTIR); metabolite quantification; process analytical technology (PAT).
Copyright © 2024 Christie, Rutherford, Palmer, Baker and Butler.
Conflict of interest statement
Authors LC, DP, MB, and HB were employed by the Dxcover Ltd. The remaining authors declare that the research was conducted in the absence of any commercial or financial relationships that could be construed as a potential conflict of interest.
Figures


Similar articles
-
FTIR spectroscopy as a unified method for simultaneous analysis of intra- and extracellular metabolites in high-throughput screening of microbial bioprocesses.Microb Cell Fact. 2017 Nov 13;16(1):195. doi: 10.1186/s12934-017-0817-3. Microb Cell Fact. 2017. PMID: 29132358 Free PMC article.
-
Into the Groove: Analytical Applications of ATR-FTIR Microstructured Internal Reflection Elements.Anal Chem. 2025 May 27;97(20):10521-10534. doi: 10.1021/acs.analchem.4c05431. Epub 2025 May 1. Anal Chem. 2025. PMID: 40310698 Review.
-
ATR-FTIR spectroscopy and spectroscopic imaging for the analysis of biopharmaceuticals.Spectrochim Acta A Mol Biomol Spectrosc. 2020 Nov 5;241:118636. doi: 10.1016/j.saa.2020.118636. Epub 2020 Jun 22. Spectrochim Acta A Mol Biomol Spectrosc. 2020. PMID: 32610215 Free PMC article. Review.
-
Nondestructive assessment of tissue engineered cartilage based on biochemical markers in cell culture media: application of attenuated total reflection Fourier transform infrared (ATR-FTIR) spectroscopy.Analyst. 2022 Apr 11;147(8):1730-1741. doi: 10.1039/d1an02351a. Analyst. 2022. PMID: 35343541 Free PMC article.
-
Aluminum Phosphate Vaccine Adjuvant: Analysis of Composition and Size Using Off-Line and In-Line Tools.Comput Struct Biotechnol J. 2019 Aug 21;17:1184-1194. doi: 10.1016/j.csbj.2019.08.003. eCollection 2019. Comput Struct Biotechnol J. 2019. PMID: 31528298 Free PMC article.
Cited by
-
CGT 4.0: a distant dream or inevitable future? Smart process automation is critical to make efficient scalability of CGT manufacturing a reality.Front Bioeng Biotechnol. 2025 Mar 19;13:1563878. doi: 10.3389/fbioe.2025.1563878. eCollection 2025. Front Bioeng Biotechnol. 2025. PMID: 40177621 Free PMC article. No abstract available.
-
Time-Resolved Hierarchical Modeling Highlights Metabolites Influencing Productivity and Cell Death in Chinese Hamster Ovary Cells.Biotechnol J. 2025 Mar;20(3):e202400624. doi: 10.1002/biot.202400624. Biotechnol J. 2025. PMID: 40065671 Free PMC article.
References
-
- Alimagham F., Winterburn J., Dolman B., Domingues P. M., Everest F., Platkov M., et al. (2021). Real-time bioprocess monitoring using a mid-infrared fibre-optic sensor. Biochem. Eng. J. 167, 107889. 10.1016/j.bej.2020.107889 - DOI
-
- Clavaud M., Roggo Y., Von Daeniken R., Liebler A., Schwabe J.-O. (2013). Chemometrics and in-line near infrared spectroscopic monitoring of a biopharmaceutical Chinese hamster ovary cell culture: prediction of multiple cultivation variables. Talanta 111, 28–38. 10.1016/j.talanta.2013.03.044 - DOI - PubMed
-
- Crowley J., Arnold S. A., Wood N., Harvey L. M., McNeil B. (2005). Monitoring a high cell density recombinant Pichia pastoris fed-batch bioprocess using transmission and reflectance near infrared spectroscopy. Enzyme Microb. Technol. 36 (5), 621–628. 10.1016/j.enzmictec.2003.12.016 - DOI
LinkOut - more resources
Full Text Sources
Miscellaneous

