. 2024 May 28:18:1404987.
doi: 10.3389/fncel.2024.1404987. eCollection 2024.

Coenzyme Q10 eyedrops conjugated with vitamin E TPGS alleviate neurodegeneration and mitochondrial dysfunction in the diabetic mouse retina

Affiliations

Coenzyme Q10 eyedrops conjugated with vitamin E TPGS alleviate neurodegeneration and mitochondrial dysfunction in the diabetic mouse retina

Christie Hang-I Lam et al. Front Cell Neurosci. .

Abstract

Diabetic retinopathy (DR) is a leading cause of blindness and vision impairment worldwide and represents one of the most common complications among diabetic patients. Current treatment modalities for DR, including laser photocoagulation, intravitreal injection of corticosteroid, and anti-vascular endothelial growth factor (VEGF) agents, target primarily vascular lesions. However, these approaches are invasive and have several limitations, such as potential loss of visual function, retinal scars and cataract formation, and increased risk of ocular hypertension, vitreous hemorrhage, retinal detachment, and intraocular inflammation. Recent studies have suggested mitochondrial dysfunction as a pivotal factor leading to both the vascular and neural damage in DR. Given that Coenzyme Q10 (CoQ10) is a proven mitochondrial stabilizer with antioxidative properties, this study investigated the effect of CoQ10 eyedrops [in conjunction with vitamin E d-α-tocopheryl poly(ethylene glycol) 1000 succinate (TPGS)] on DR-induced neurodegeneration using a type 2 diabetes mouse model (C57BLKsJ-db/db mice). Utilizing a comprehensive electroretinography protocol, supported by immunohistochemistry, our results revealed that topical application of CoQ10 eyedrops conjugated with vitamin E TPGS produced a neuroprotective effect against diabetic-induced neurodegeneration by preserving the function and histology of various retinal neural cell types. Compared to the control group, mice treated with CoQ10 exhibited thicker outer and inner nuclear layers, higher densities of photoreceptor, cone cell, and rod-bipolar cell dendritic boutons, and reduced glial reactivity and microglial cell density. Additionally, the CoQ10 treatment significantly alleviated retinal levels of MMP-9 and enhanced mitochondrial function. These findings provide further insight into the role of mitochondrial dysfunction in the development of DR and suggest CoQ10 eyedrops, conjugated with vitamin E TPGS, as a potential complementary therapy for DR-related neuropathy.

Keywords: Coenzyme Q10; diabetic retinopathy; electroretinography; mitochondrial dysfunction; neurodegeneration.


Conflict of interest statement

The authors declare that the research was conducted in the absence of any commercial or financial relationships that could be construed as a potential conflict of interest.

Figures

FIGURE 1
FIGURE 1
Effect of CoQ10 eyedrops conjugated with vitamin E TPGS on scotopic ERG b-wave at different experimental timepoints. (A–D) Stimulus-response plots showing the amplitude of scotopic ERG pSTR (–4.32 to –3.9 log cd s /m2) and b-wave response (–3.3 to +1.3 log cd s /m2) recorded from control db/db mice (n = 11) and CoQ10 treated mice (n = 12) at different experimental timepoints. The responses within the rod operative range (i.e., ≤ –0.3 log cd s /m2) were fitted with sigmoidal curves using the Naka-Ruston function to deduce the maximum b-wave response (Bmax) value. (E) The Bmax value of the two groups of mice over the experimental period (Data presented as mean ± SEM. Simple main effect analysis: *p < 0.05, **p < 0.01, ***p < 0.001). (F) Representative scotopic ERG waveform at +1.3 log cd s/m2 of the db/db control mice (gray) and CoQ10 treated mice (red) at 4-month.
FIGURE 2
FIGURE 2
Effect of CoQ10 eyedrops conjugated vitamin E TPGS on photopic ERG b-wave at different experimental timepoints. (A) The photopic ERG responses of the control (n = 5) and CoQ10 treated db/db mice (n = 5) were measured at +0.47 log cd s/m2 (Data presented as means ± SEM. Simple main effect analysis: *p < 0.05). (B) Representative photopic ERG waveform at +0.47 log cd s/m2 of control mice (gray) and CoQ10 treated mice (red) at 4-month.
FIGURE 3
FIGURE 3
Effect of CoQ10 eyedrops conjugated vitamin E TPGS on inner retinal function at different experimental timepoints. (A) Representative waveform showing scotopic threshold response (STR) at –3.9 log cd s/m2 of the db/db control mice (gray) and CoQ10 treated mice (red) at 4-month. Arrow shows the positive STR (pSTR) of the CoQ10 treated db/db mice. (B,C) Bar charts showing the mean amplitude of pSTR measured at different stimulus intensities of the control db/db mice (n = 11) and CoQ10 treated mice (n = 12) at baseline and 4-month. The oscillatory potentials (OPs) were isolated by digitally filtering the raw ERG signals recorded at +1.3 log cd s/m2. (D) The representative OPs waveforms of the db/db mice in control (gray) and CoQ10 treated (red) group at 4-month. Arrows indicating the peaks of OP1 to OP4 of the CoQ10 treated db/db mice. (E,F) Bar charts showing the mean amplitudes of OP1 to OP4 and of the control mice (n = 11) and CoQ10 treated mice (n = 12) at baseline and 4-month (Data presented as mean ± SEM. Simple main effect analysis: *p < 0.05).
FIGURE 4
FIGURE 4
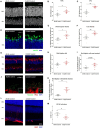
The effect of CoQ10 eyedrops conjugated vitamin E TPGS on preserving the retinal structure of db/db mice. (A) Representative confocal images of the retinal sections of the two groups of mice processed for DAPI (white). White scale bar: 20 μm. Dot plots comparing the thickness of the (B) outer nuclear layer (ONL) and (C) inner nuclear layer (INL) of the control db/db mice (n = 6) and CoQ10 treated mice (n = 7). (D) Representative confocal images of the retinal sections focusing on the ONL of the two groups of mice. Bar charts comparing the number of (E) photoreceptors and (F) cone cells of the control db/db mice (n = 6) and CoQ10 treated mice (n = 7). The number of photoreceptors was assessed by counting the DAPI stained nuclei (blue), and the number of cones by counting the soma co-labeled by GNAT2 (green) over an 80 μm- and a 160 μm-segment, respectively. (G) Representative confocal images of the retinal sections of the control db/db mice and CoQ10 treated db/db mice processed for PKCα (red) and DAPI (blue). White scale bar: 20 μm. Dot plots comparing the (H) rod bipolar cell density and (I) number of rod bipolar cell axon terminals of control (n = 6) and CoQ10 treated db/db mice (n = 7). (J) Representative confocal images of the retina sections of the control and CoQ10 treated mice processed for PKCα (red) and bassoon (green). White scale bar: 10 μm. (K) Dot plots comparing the rod bipolar cell dendritic boutons of control (n = 5) and CoQ10 treated db/db mice (n = 7). (L) The representative confocal images of the retinal sections processed with GFAP (red), which reflects the extend of glial reactivity from the two groups of mice. White scale bar: 20 μm. (M) Dot plots showing the GFAP score of the control (n = 5) and CoQ10 treated mice (n = 6) (Data presented as mean ± SEM. Independent sample t-test: **p < 0.05). ONL, outer nuclear layer; INL, inner nuclear layer; GCL, ganglion cell layer.
FIGURE 5
FIGURE 5
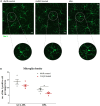
The effect of CoQ10 eyedrops conjugated vitamin E TPGS on retinal microglial cells in db/db mice. (A) Representative confocal images of the flat mount retina of the db/db mice in the treatment and control group processed for iba-1 (green) with that of heterozygous non-diabetic control (db/+ mice) included as reference. The morphology of the iba-1 positive cells in the CoQ10 treated group appeared to be more ramified than that of the db/db control. White scale bar: 20 μm. (B) Dot plots comparing the number of iba-1 positive cell per imaged area of the control db/db mice (n = 4) and CoQ10 treated mice (n = 5) at GCL-IPL and OPL (Data presented as mean ± SEM. Independent sample t-test: *p < 0.05). OPL, outer plexiform layer; IPL, inner plexiform layer; GCL, ganglion cell layer.
FIGURE 6
FIGURE 6
The effect of CoQ10 eyedrops conjugated vitamin E TPGS on mitochondrial bioenergetics and MMP-9 levels of the retinas of db/db mice. (A) The oxygen consumption rate (OCR) curve measured from the retina of the two groups of mice with the Seahorse Mito Stress assay. The value was normalized to the protein concentration. (B) Bar charts comparing the key mitochondrial function parameters of the control (n = 4) and CoQ10 treated mice (n = 4) (Data presented as means ± SEM. Independent sample t-test, *p < 0.05, **p < 0.01). (C) Representative confocal images of the retinal sections processed with MMP-9 (red). DAPI (blue) was used to counterstain the cell nucleus to indicate different retinal layers of the two groups of mice. Negative control retinal sections (primary antibody omitted) from wild type mice show only trace fluorescence. White scale bar: 20 μm. (D) Dot plots showing the mean fluorescence levels of the images, which reflect the levels of MMP-9 in the retina of the control (n = 5) and CoQ10 treated mice (n = 7). MMP-9 has been detected in various retinal cell types, including vascular cells, glial cells, and neural cells, in different disease models. The immunoreactivity of MMP-9 was found more prominent in vessel, inner nuclear layer, inner plexiform layer, and ganglion cell layer in db/db mice retina, while CoQ10 eyedrops conjugated with vitamin E TPGS attenuated the increase in fluorescence intensity (Data presented as means ± SEM. Independent sample t-test, *p < 0.05). ONL, outer nuclear layer; INL, inner nuclear layer; GCL, ganglion cell layer.

Similar articles

Cited by

References

    1. Abcouwer S. F., Gardner T. W. (2014). Diabetic retinopathy: Loss of neuroretinal adaptation to the diabetic metabolic environment. Ann. N. Y. Acad. Sci. 1311 174–190. 10.1111/nyas.12412 - DOI - PMC - PubMed
    1. Ahmadvand H., Tavafi M., Khosrowbeygi A. (2012). Amelioration of altered antioxidant enzymes activity and glomerulosclerosis by coenzyme Q10 in alloxan-induced diabetic rats. J. Diabetes Compl. 26 476–482. 10.1016/j.jdiacomp.2012.06.004 - DOI - PubMed
    1. Anderson P. J., Watts H., Hille C., Philpott K., Clark P., Gentleman M. C. S., et al. (2008). Glial and endothelial blood-retinal barrier responses to amyloid-β in the neural retina of the rat. Clin. Ophthalmol. 2:801. - PMC - PubMed
    1. Antonetti D. A., Barber A. J., Bronson S. K., Freeman W. M., Gardner T. W., Jefferson L. S., et al. (2006). Diabetic retinopathy. Diabetes 55 2401–2411. - PubMed
    1. Barber A. J. (2003). A new view of diabetic retinopathy: A neurodegenerative disease of the eye. Prog. Neuropsychopharmacol. Biol. Psychiatry 27 283–290. - PubMed