

Genome-wide association study and genomic selection of flax powdery mildew in Xinjiang Province
- PMID: 38863531
- PMCID: PMC11165360
- DOI: 10.3389/fpls.2024.1403276
Genome-wide association study and genomic selection of flax powdery mildew in Xinjiang Province
Abstract
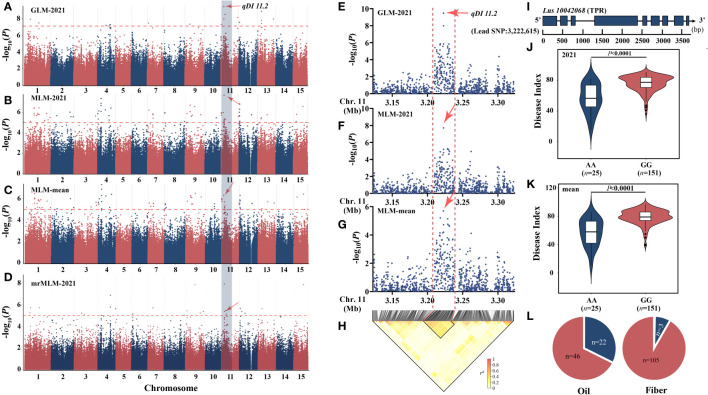
Flax powdery mildew (PM), caused by Oidium lini, is a globally distributed fungal disease of flax, and seriously impairs its yield and quality. To data, only three resistance genes and a few putative quantitative trait loci (QTL) have been reported for flax PM resistance. To dissect the resistance mechanism against PM and identify resistant genetic regions, based on four years of phenotypic datasets (2017, 2019 to 2021), a genome-wide association study (GWAS) was performed on 200 flax core accessions using 674,074 SNPs and 7 models. A total of 434 unique quantitative trait nucleotides (QTNs) associated with 331 QTL were detected. Sixty-four loci shared in at least two datasets were found to be significant in haplotype analyses, and 20 of these sites were shared by multiple models. Simultaneously, a large-effect locus (qDI 11.2) was detected repeatedly, which was present in the mapping study of flax pasmo resistance loci. Oil flax had more QTL with positive-effect or favorable alleles (PQTL) and showed higher PM resistance than fiber flax, indicating that effects of these QTL were mainly additive. Furthermore, an excellent resistant variety C120 was identified and can be used to promote planting. Based on 331 QTLs identified through GWAS and the statistical model GBLUP, a genomic selection (GS) model related to flax PM resistance was constructed, and the prediction accuracy rate was 0.96. Our results provide valuable insights into the genetic basis of resistance and contribute to the advancement of breeding programs.
Keywords: flax; genome-wide association study (GWAS); genomic selection (GS); powdery mildew (PM); quantitative trait loci (QTL).
Copyright © 2024 Zhu, Li, Guo, Li, Xue, Jiang, Yan, Xie, Ning and Xie.
Conflict of interest statement
The authors declare that the research was conducted in the absence of any commercial or financial relationships that could be construed as a potential conflict of interest.
Figures


Similar articles
-
Insights into the Genetic Architecture and Genomic Prediction of Powdery Mildew Resistance in Flax (Linum usitatissimum L.).Int J Mol Sci. 2022 Apr 29;23(9):4960. doi: 10.3390/ijms23094960. Int J Mol Sci. 2022. PMID: 35563347 Free PMC article.
-
Genome-Wide Association Studies for Pasmo Resistance in Flax (Linum usitatissimum L.).Front Plant Sci. 2019 Jan 14;9:1982. doi: 10.3389/fpls.2018.01982. eCollection 2018. Front Plant Sci. 2019. PMID: 30693010 Free PMC article.
-
Genomic Prediction Accuracy of Seven Breeding Selection Traits Improved by QTL Identification in Flax.Int J Mol Sci. 2020 Feb 25;21(5):1577. doi: 10.3390/ijms21051577. Int J Mol Sci. 2020. PMID: 32106624 Free PMC article.
-
History and prospects of flax genetic markers.Front Plant Sci. 2025 Jan 15;15:1495069. doi: 10.3389/fpls.2024.1495069. eCollection 2024. Front Plant Sci. 2025. PMID: 39881731 Free PMC article. Review.
-
Integrated omics approaches for flax improvement under abiotic and biotic stress: Current status and future prospects.Front Plant Sci. 2022 Jul 25;13:931275. doi: 10.3389/fpls.2022.931275. eCollection 2022. Front Plant Sci. 2022. PMID: 35958216 Free PMC article. Review.
Cited by
-
Can the molecular and transgenic breeding of crops be an alternative and sustainable technology to meet food demand?Funct Integr Genomics. 2025 Apr 9;25(1):83. doi: 10.1007/s10142-025-01594-1. Funct Integr Genomics. 2025. PMID: 40205022 Review.
References
-
- Aly A. A., Mansour M., Mohamed H. I., Abd-Elsalam K. A. (2012). Examination of correlations between several biochemical components and powdery mildew resistance of flax cultivars. Plant Pathol. J. 28, 149–155. doi: 10.5423/PPJ.2012.28.2.149 - DOI
-
- Asgarinia P., Cloutier S., Duguid S., Rashid K., Mirlohi A., Banik M., et al. . (2013). Mapping quantitative trait loci for powdery mildew resistance in flax (Linum usitatissimum L.). Crop Sci. 53, 2462–2472. doi: 10.2135/cropsci2013.05.0298 - DOI
LinkOut - more resources
Full Text Sources