

Potential for in vivo visualization of intracellular pH gradient in the brain using PET imaging
- PMID: 38863573
- PMCID: PMC11166174
- DOI: 10.1093/braincomms/fcae172
Potential for in vivo visualization of intracellular pH gradient in the brain using PET imaging
Abstract
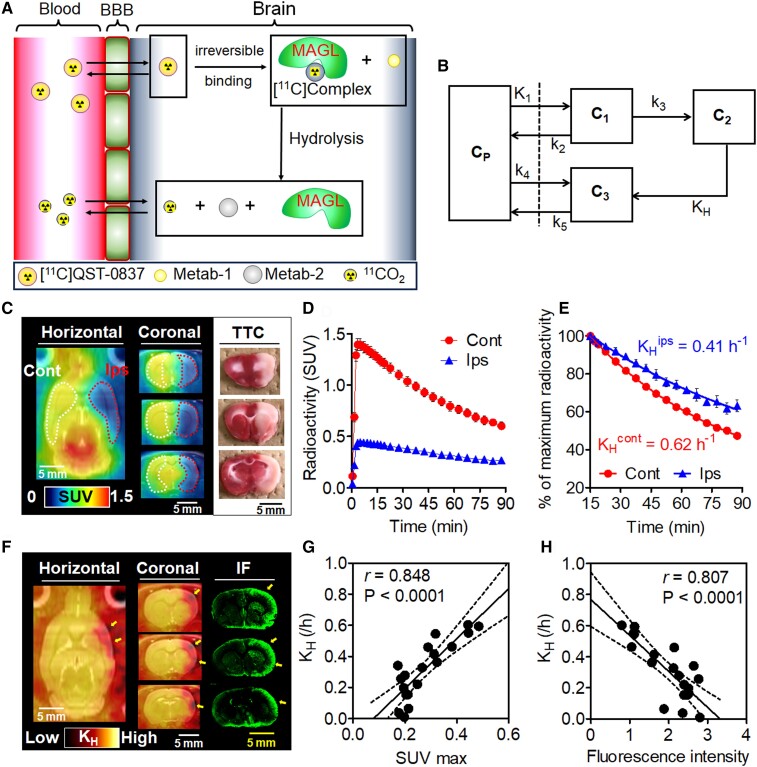
Intracellular pH is a valuable index for predicting neuronal damage and injury. However, no PET probe is currently available for monitoring intracellular pH in vivo. In this study, we developed a new approach for visualizing the hydrolysis rate of monoacylglycerol lipase, which is widely distributed in neurons and astrocytes throughout the brain. This approach uses PET with the new radioprobe [11C]QST-0837 (1,1,1,3,3,3-hexafluoropropan-2-yl-3-(1-phenyl-1H-pyrazol-3-yl)azetidine-1-[11C]carboxylate), a covalent inhibitor containing an azetidine carbamate skeleton for monoacylglycerol lipase. The uptake and residence of this new radioprobe depends on the intracellular pH gradient, and we evaluated this with in silico, in vitro and in vivo assessments. Molecular dynamics simulations predicted that because the azetidine carbamate moiety is close to that of water molecules, the compound containing azetidine carbamate would be more easily hydrolyzed following binding to monoacylglycerol lipase than would its analogue containing a piperidine carbamate skeleton. Interestingly, it was difficult for monoacylglycerol lipase to hydrolyze the azetidine carbamate compound under weakly acidic (pH 6) conditions because of a change in the interactions with water molecules on the carbamate moiety of their complex. Subsequently, an in vitro assessment using rat brain homogenate to confirm the molecular dynamics simulation-predicted behaviour of the azetidine carbamate compound showed that [11C]QST-0837 reacted with monoacylglycerol lipase to yield an [11C]complex, which was hydrolyzed to liberate 11CO2 as a final product. Additionally, the 11CO2 liberation rate was slower at lower pH. Finally, to indicate the feasibility of estimating how the hydrolysis rate depends on intracellular pH in vivo, we performed a PET study with [11C]QST-0837 using ischaemic rats. In our proposed in vivo compartment model, the clearance rate of radioactivity from the brain reflected the rate of [11C]QST-0837 hydrolysis (clearance through the production of 11CO2) in the brain, which was lower in a remarkably hypoxic area than in the contralateral region. In conclusion, we indicated the potential for visualization of the intracellular pH gradient in the brain using PET imaging, although some limitations remain. This approach should permit further elucidation of the pathological mechanisms involved under acidic conditions in multiple CNS disorders.
Keywords: PET; hydrolysis; hypoxia; intracellular pH; monoacylglycerol lipase.
© The Author(s) 2024. Published by Oxford University Press on behalf of the Guarantors of Brain.
Conflict of interest statement
The authors report no competing interests.
Figures


Similar articles
-
Radiosynthesis and evaluation of a novel monoacylglycerol lipase radiotracer: 1,1,1,3,3,3-hexafluoropropan-2-yl-3-(1-benzyl-1H-pyrazol-3-yl)azetidine-1-[11C]carboxylate.Bioorg Med Chem. 2019 Aug 15;27(16):3568-3573. doi: 10.1016/j.bmc.2019.06.037. Epub 2019 Jun 29. Bioorg Med Chem. 2019. PMID: 31278005
-
Azetidine and Piperidine Carbamates as Efficient, Covalent Inhibitors of Monoacylglycerol Lipase.J Med Chem. 2017 Dec 14;60(23):9860-9873. doi: 10.1021/acs.jmedchem.7b01531. Epub 2017 Dec 5. J Med Chem. 2017. PMID: 29148769
-
Radiosynthesis and ex vivo evaluation of [(11)C-carbonyl]carbamate- and urea-based monoacylglycerol lipase inhibitors.Nucl Med Biol. 2014 Sep;41(8):688-94. doi: 10.1016/j.nucmedbio.2014.05.001. Epub 2014 May 10. Nucl Med Biol. 2014. PMID: 24969632 Free PMC article.
-
Synthesis and evaluation of carbamate derivatives as fatty acid amide hydrolase and monoacylglycerol lipase inhibitors.Arch Pharm (Weinheim). 2022 Nov;355(11):e2200081. doi: 10.1002/ardp.202200081. Epub 2022 Aug 3. Arch Pharm (Weinheim). 2022. PMID: 35924298
-
Efficiency gains in tracer identification for nuclear imaging: can in vivo LC-MS/MS evaluation of small molecules screen for successful PET tracers?ACS Chem Neurosci. 2014 Dec 17;5(12):1154-63. doi: 10.1021/cn500073j. Epub 2014 Oct 13. ACS Chem Neurosci. 2014. PMID: 25247893 Review.
Cited by
-
Efficient one-pot radiosynthesis of the 11C-labeled aquaporin-4 inhibitor TGN-020.EJNMMI Radiopharm Chem. 2025 Apr 5;10(1):17. doi: 10.1186/s41181-025-00338-7. EJNMMI Radiopharm Chem. 2025. PMID: 40186669 Free PMC article.
References
-
- Freeman RS, Barone MC. Targeting hypoxia-inducible factor (HIF) as a therapeutic strategy for CNS disorders. Curr Drug Targets CNS Neurol Disord. 2005;4:85–92. - PubMed
-
- Bădescu GM, Fîlfan M, Ciobanu O, Dumbravă DA, Popa-Wagner A. Age-related hypoxia in CNS pathology. Rom J Morphol Embryol. 2016;57:33–43. - PubMed
-
- Bouzat P, Oddo M. Lactate and the injured brain: Friend or foe? Curr Opin Crit Care. 2014;20:133–140. - PubMed
LinkOut - more resources
Full Text Sources