. 2024 May 21;6(3):fcae178.
doi: 10.1093/braincomms/fcae178. eCollection 2024.

Single-molecule characterization of salivary protein aggregates from Parkinson's disease patients: a pilot study

Affiliations

Single-molecule characterization of salivary protein aggregates from Parkinson's disease patients: a pilot study

Martin Furlepa et al. Brain Commun. .

Abstract

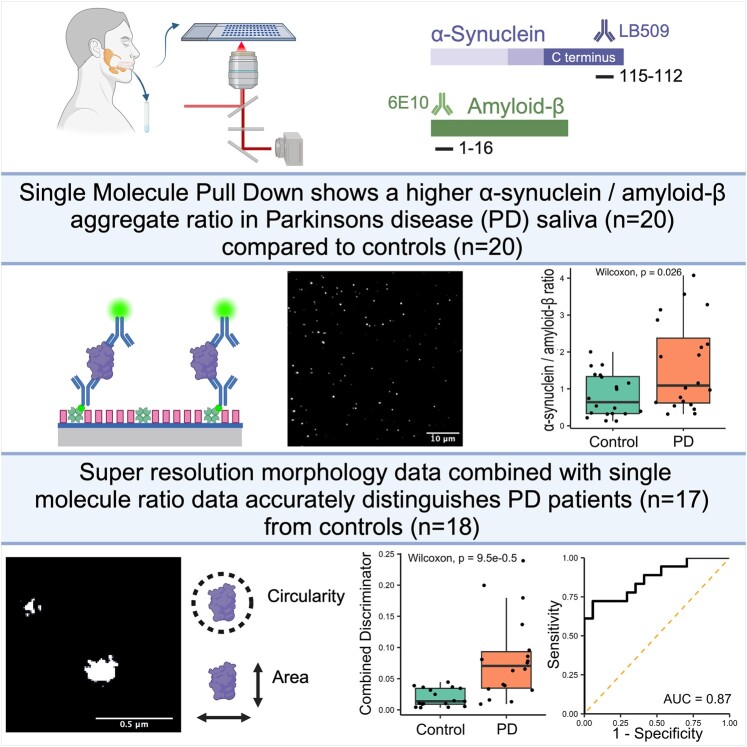
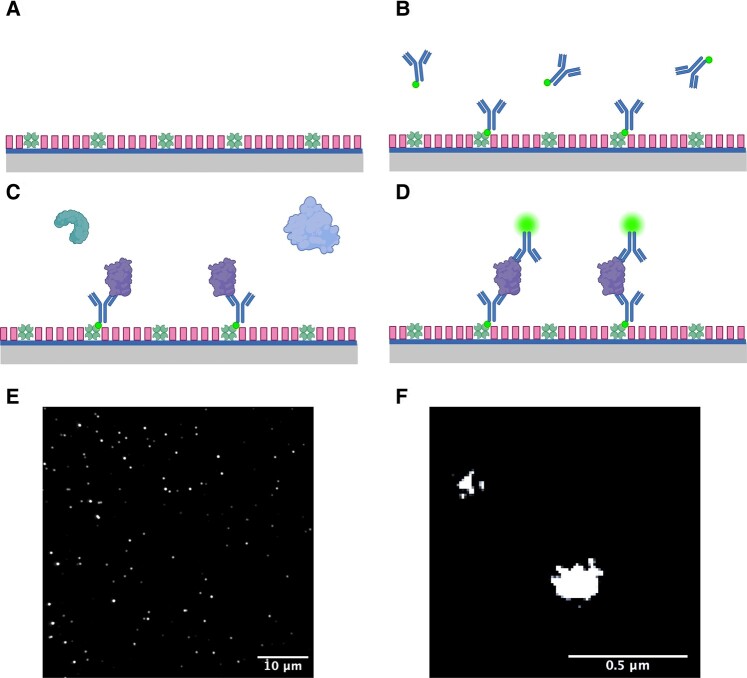
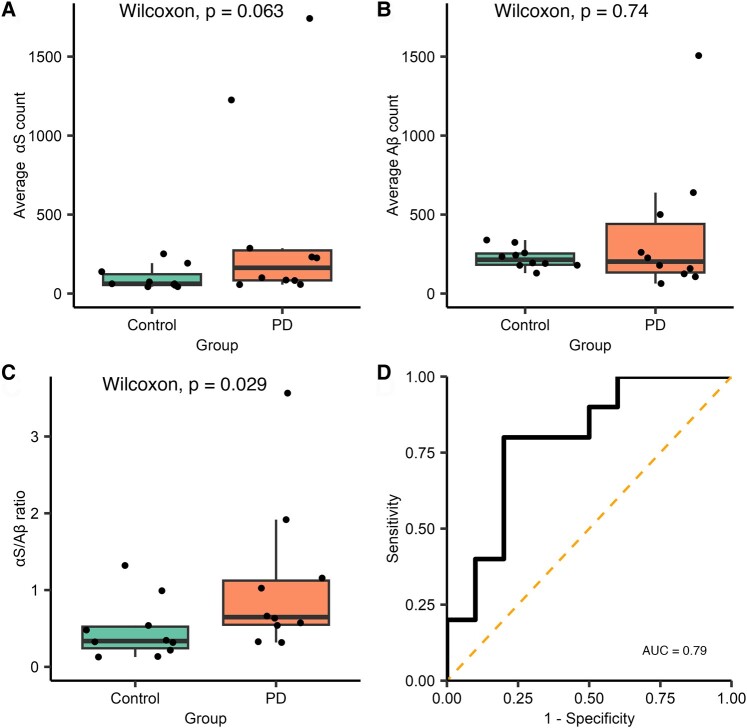
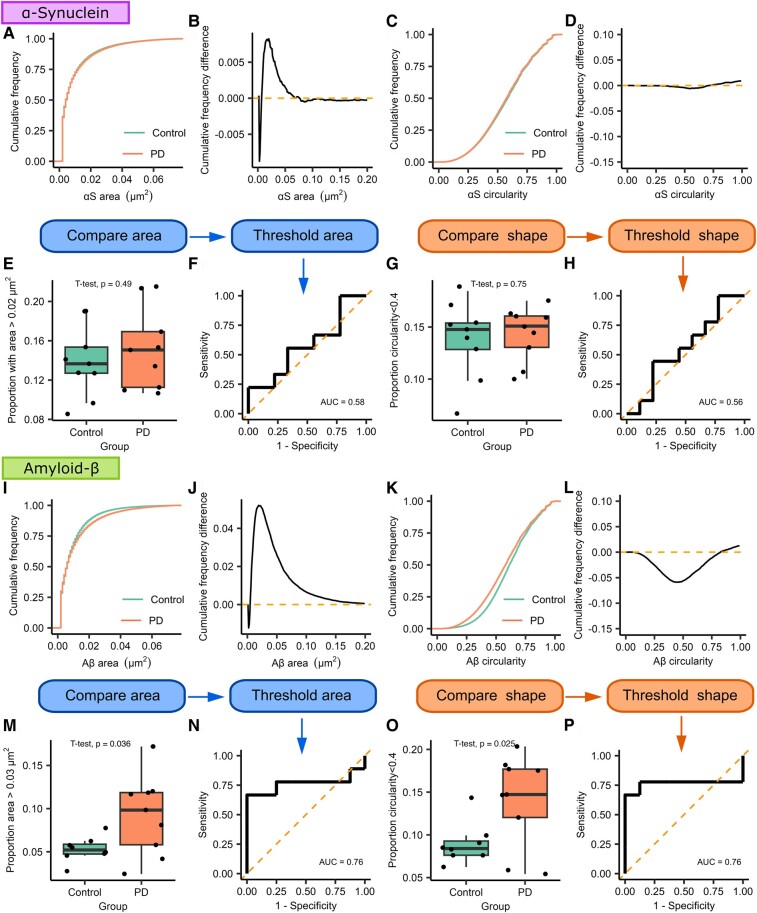
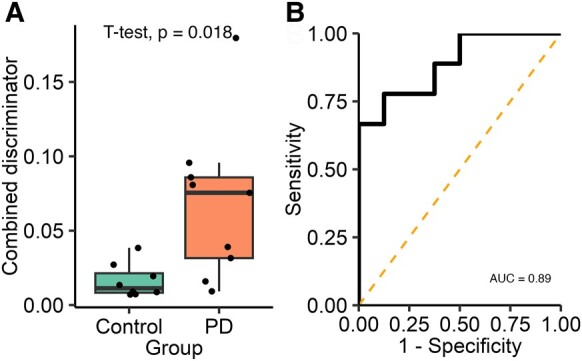
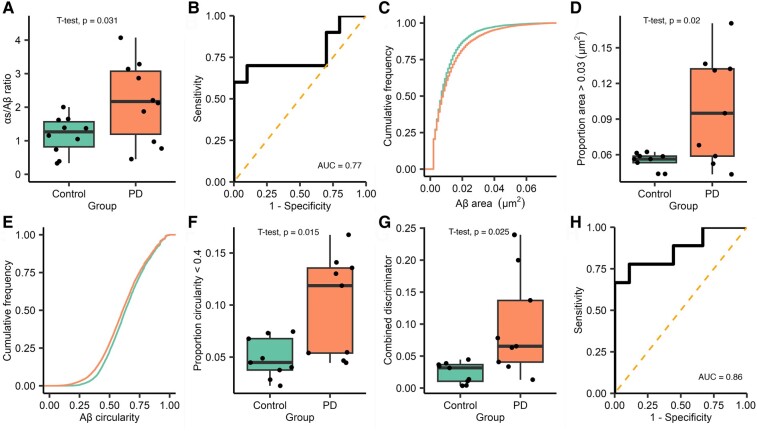
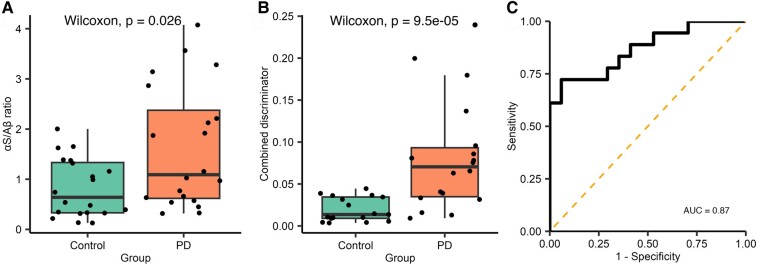
Saliva is a convenient and accessible biofluid that has potential as a future diagnostic tool for Parkinson's disease. Candidate diagnostic tests for Parkinson's disease to date have predominantly focused on measurements of α-synuclein in CSF, but there is a need for accurate tests utilizing more easily accessible sample types. Prior studies utilizing saliva have used bulk measurements of salivary α-synuclein to provide diagnostic insight. Aggregate structure may influence the contribution of α-synuclein to disease pathology. Single-molecule approaches can characterize the structure of individual aggregates present in the biofluid and may, therefore, provide greater insight than bulk measurements. We have employed an antibody-based single-molecule pulldown assay to quantify salivary α-synuclein and amyloid-β peptide aggregate numbers and subsequently super-resolved captured aggregates using direct Stochastic Optical Reconstruction Microscopy to describe their morphological features. We show that the salivary α-synuclein aggregate/amyloid-β aggregate ratio is increased almost 2-fold in patients with Parkinson's disease (n = 20) compared with controls (n = 20, P < 0.05). Morphological information also provides insight, with saliva from patients with Parkinson's disease containing a greater proportion of larger and more fibrillar amyloid-β aggregates than control saliva (P < 0.05). Furthermore, the combination of count and morphology data provides greater diagnostic value than either measure alone, distinguishing between patients with Parkinson's disease (n = 17) and controls (n = 18) with a high degree of accuracy (area under the curve = 0.87, P < 0.001) and a larger dynamic range. We, therefore, demonstrate for the first time the application of highly sensitive single-molecule imaging techniques to saliva. In addition, we show that aggregates present within saliva retain relevant structural information, further expanding the potential utility of saliva-based diagnostic methods.

Keywords: Parkinson’s disease; amyloid-β; saliva; single-molecule imaging; α-synuclein.


Conflict of interest statement

The authors report no competing interests.

Figures

Graphical Abstract
Graphical Abstract
Figure 1
Figure 1
Illustration of the SiMPull method. (A) Prepared glass coverslip with NeutrAvidin bound to its surface and F-127 passivation. (B) Application of biotinylated capture antibodies, either LB509 or 6E10 antibody is used for the detection of α-synuclein- or Aβ-containing aggregates, respectively. (C) Application of saliva biofluid to the coverslip; Aβ- or α-synuclein-containing aggregates are specifically captured by the relevant immobilized antibodies on the coverslip surface. (D) Alexa-647-labelled LB509 and 6E10 antibodies are applied to the surface for aggregate detection. (E) Representative diffraction-limited image captured using Total Internal Reflection Fluorescence (TIRF) microscope set-up. (F) Representative super-resolved aggregates.
Figure 2
Figure 2
Analysis of diffraction-limited single-aggregate counting for Subgroup 1. Each FoV is 2500 µm2 and 16 fields of view were measured for each participant, Parkinson’s disease n = 10 and control n = 10. (A) A non-significant increase in the number of α-synuclein-containing aggregates was observed in the saliva of people with Parkinson’s disease compared with controls (W = 75, P = 0.063), and there was no difference in the number of Aβ-containing aggregates (W = 45, P = 0.74) (B). (C) The ratio of the number of α-synuclein to Aβ aggregates is significantly increased 2.2-fold in people with Parkinson’s disease compared with controls (W = 79, P = 0.029, r = 0.49). (D) ROC analysis of ratio values (AUC = 0.79). αS, α-synuclein; Aβ, amyloid-β; AUC, area under the curve; PD, Parkinson’s disease.
Figure 3
Figure 3
Morphological analysis of α-synuclein and Aβ-containing aggregates from Subgroup 1 using dSTORM super-resolution imaging. For both types of aggregates, we compare the cumulative frequency curves for the morphological feature of interest. The two distributions are subtracted from each other to demonstrate how the two curves differ; the point of maximum difference is then used as a threshold to distinguish groups of morphologically distinct aggregates. (A–H) α-Synuclein. We find no difference in the size (area, A, B, E) or shape (circularity, C, D, G) of α-synuclein-containing aggregates (Parkinson’s disease n = 9, control n = 9). For Aβ-containing aggregates (I–P, Parkinson’s disease n = 9, control n = 8), we show that the area distribution differs between the two groups and that the two groups maximally differ from each other at 0.03 µm2 (I, J, M). Using this value as a cut-off, we show that saliva from patient with Parkinson’s disease contains a greater proportion of aggregates >0.03 µm2 (t(9.75) = 2.43, P = 0.036, d = 1.15). ROC analysis demonstrates that aggregate size can distinguish between Parkinson’s disease and controls (N, AUC = 0.76). Shape data analysis shows a visible difference between circularity distributions (K, L, O), we find that the two distributions are maximally different from each other at a circularity value of 0.4 (t(15) = 2.48, P = 0.025, d = 1.23), and ROC analysis shows that shape data can distinguish Parkinson’s disease from controls (P, AUC = 0.76). αS, α-synuclein; Aβ, amyloid-β; AUC, area under the curve; PD, Parkinson’s disease.
Figure 4
Figure 4
Analysis of the combined single-aggregate count and super-resolution morphological data for Subgroup 1. A combined discriminator is calculated for each participant by multiplying the α-synuclein/Aβ aggregate ratio by the proportion of Aβ-containing aggregates satisfying both morphological feature thresholds (area >0.03 µm2 and circularity <0.4, Parkinson’s disease n = 9, control n = 8). (A) The combined discriminator is significantly higher in the PD group (4.3-fold increase, t(8.83) = 2.88, P = 0.018, d = 1.36), (B) applying ROC analysis demonstrates that this metric can accurately distinguish between Parkinson’s disease and control participants (AUC = 0.89). AUC, area under the curve; PD, Parkinson’s disease.
Figure 5
Figure 5
Analysis of diffraction-limited single-molecule aggregate counting, super-resolution morphological data and combined discriminator data for Subgroup 2. For diffraction-limited data, each FoV is 2500 µm2 and 16 fields of view a captured for each participant, n = 10 Parkinson’s disease and 10 control. (A) The ratio of the number of α-synuclein to Aβ aggregates is significantly higher in patients with Parkinson’s disease (1.9-fold increase, t(12.68) = 2.42, P = 0.031, d = 1.08). (B) ROC analysis of diffraction-limited ratio values (AUC = 0.77). For super-resolution data, analysis was completed as described in Fig. 3 (Subgroup 2 Parkinson’s disease n = 9 and control n = 9). (C) For Aβ-containing aggregates, we show that there is a different area distribution between the two groups, applying the threshold values identified in Subgroup 1 and (D) we show that there is significantly more Aβ aggregates >0.03 µm2 in the Parkinson’s disease group (t(8.365) = 2.852, P = 0.02, d = 1.345). (E) For Aβ shape data, analysis shows a visible difference between circularity distributions, the Parkinsons disease group has more Aβ with a circularity <0.4 (F, t(10.43) = 2.901, P = 0.015, d = 1.367). Full analysis, including α-synuclein data, is shown in Supplementary Fig. 4. A combined discriminator was calculated as previously described in Fig. 4. (G) The combined discriminator is significantly higher in the Parkinson’s disease group (4-fold increase, t(10.43) = 2.901, P = 0.025, d = 1.367), (H) applying ROC analysis demonstrate that this metric can accurately distinguish between Parkinson’s disease and controls (AUC = 0.86). Aβ, amyloid-β; AUC, area under the curve; PD, Parkinson’s disease.
Figure 6
Figure 6
Analysis of combined single-molecule aggregate count data and super-resolution morphological data for data combined across Subgroups 1 and 2. (A) The α-synuclein/Aβ aggregate ratio was significantly higher in when the subgroups were combined. (B) The combined discriminator was calculated, as previously described (Parkinson’s disease n = 18, control n = 17), the combined discriminator was increased 5-fold in the Parkinson’s disease group (W = 41, P < 0.001). (C) Applying ROC analysis demonstrated that this metric can accurately distinguish between Parkinson’s disease and controls (AUC = 0.86). αS, α-synuclein; Aβ, amyloid-β; AUC, area under the curve; PD, Parkinson’s disease.

Similar articles

Cited by

References

    1. Tysnes OB, Storstein A. Epidemiology of Parkinson’s disease. J Neural Transm. 2017;124(8):901–905. - PubMed
    1. Postuma RB, Berg D, Adler CH, et al. The new definition and diagnostic criteria of Parkinson’s disease. Lancet Neurol. 2016;15(6):546–548. - PubMed
    1. Spillantini MG, Schmidt ML, Lee VMY, Trojanowski JQ, Jakes R, Goedert M. α-Synuclein in Lewy bodies. Nature. 1997;388(6645):839–840. - PubMed
    1. Spillantini MG, Crowther RA, Jakes R, Hasegawa M, Goedert M. α-Synuclein in filamentous inclusions of Lewy bodies from Parkinson’s disease and dementia with Lewy bodies. Proc Natl Acad Sci U S A. 1998;95(11):6469–6473. - PMC - PubMed
    1. Wong YC, Krainc D. α-synuclein toxicity in neurodegeneration: Mechanism and therapeutic strategies. Nat Med. 2017;23(2):1–13. - PMC - PubMed

LinkOut - more resources