. 2024 May 28:4:1351815.
doi: 10.3389/fnetp.2024.1351815. eCollection 2024.

Coordinated reset stimulation of plastic neural networks with spatially dependent synaptic connections

Affiliations

Coordinated reset stimulation of plastic neural networks with spatially dependent synaptic connections

Justus A Kromer et al. Front Netw Physiol. .

Abstract

Background: Abnormal neuronal synchrony is associated with several neurological disorders, including Parkinson's disease (PD), essential tremor, dystonia, and epilepsy. Coordinated reset (CR) stimulation was developed computationally to counteract abnormal neuronal synchrony. During CR stimulation, phase-shifted stimuli are delivered to multiple stimulation sites. Computational studies in plastic neural networks reported that CR stimulation drove the networks into an attractor of a stable desynchronized state by down-regulating synaptic connections, which led to long-lasting desynchronization effects that outlasted stimulation. Later, corresponding long-lasting desynchronization and therapeutic effects were found in animal models of PD and PD patients. To date, it is unclear how spatially dependent synaptic connections, as typically observed in the brain, shape CR-induced synaptic downregulation and long-lasting effects.

Methods: We performed numerical simulations of networks of leaky integrate-and-fire neurons with spike-timing-dependent plasticity and spatially dependent synaptic connections to study and further improve acute and long-term responses to CR stimulation.

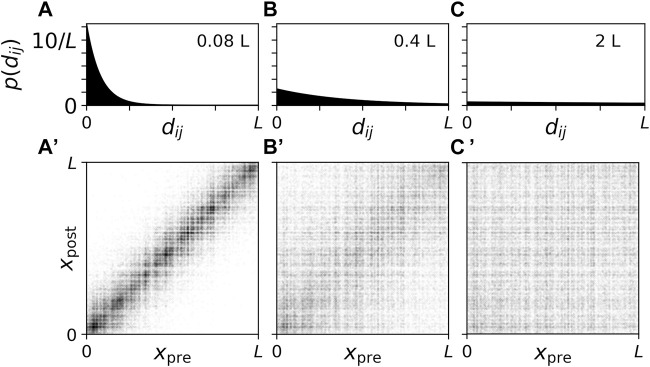
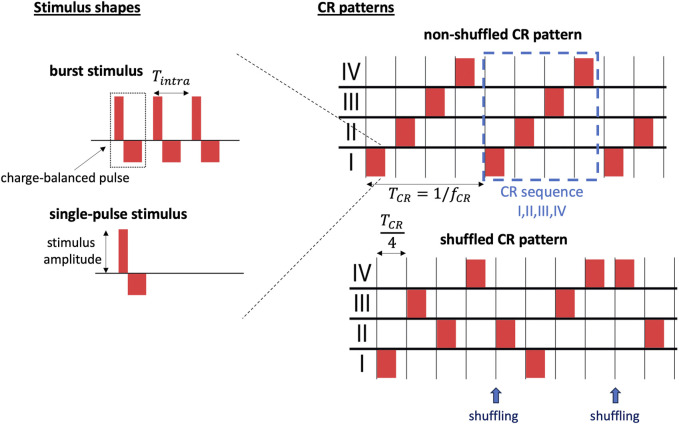
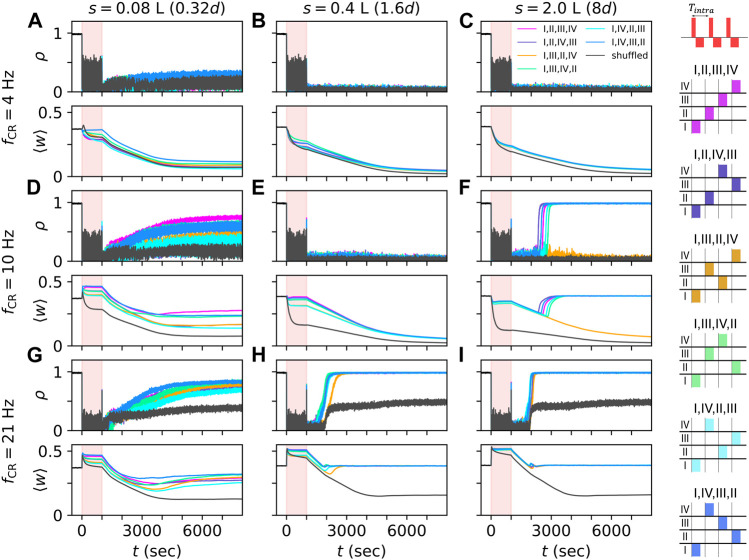
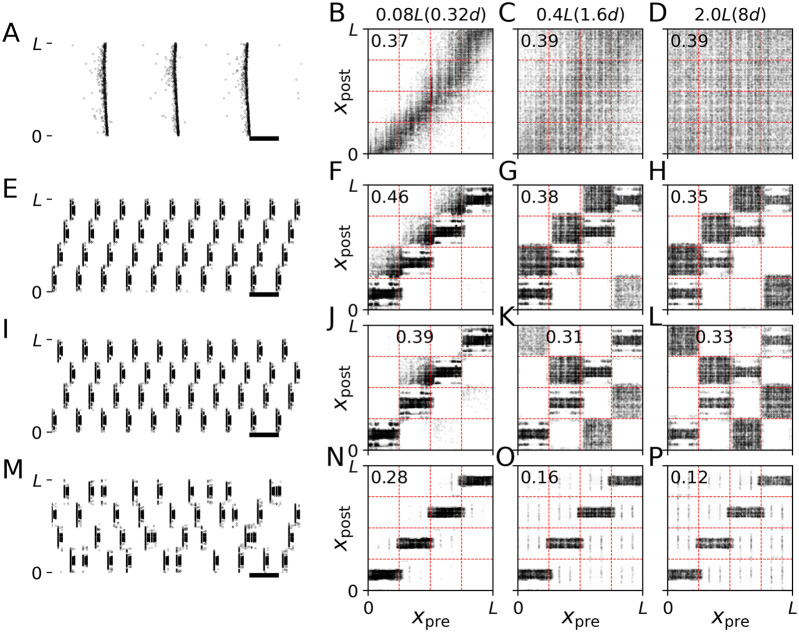
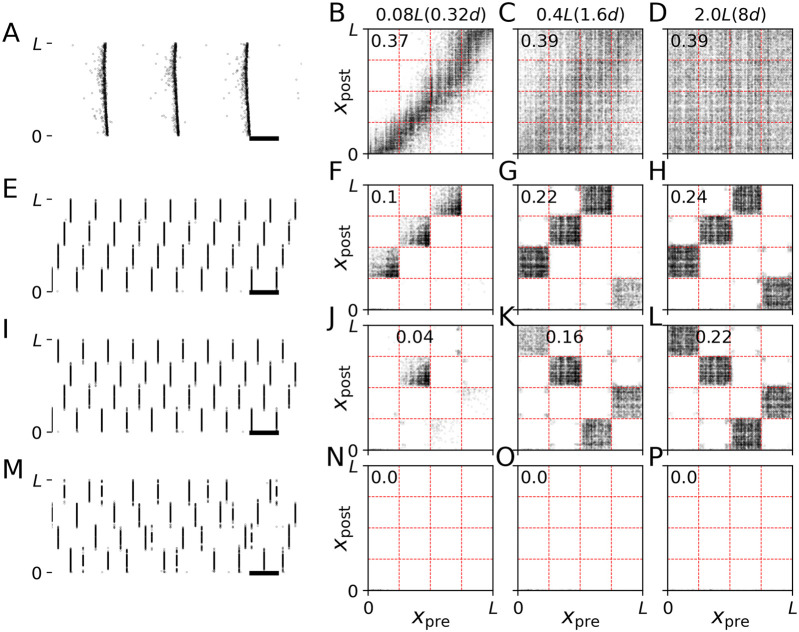
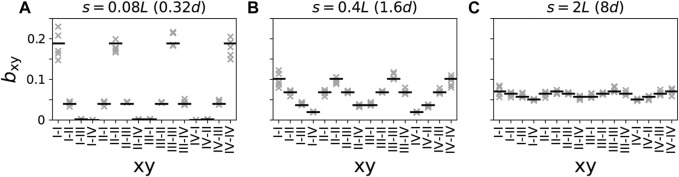
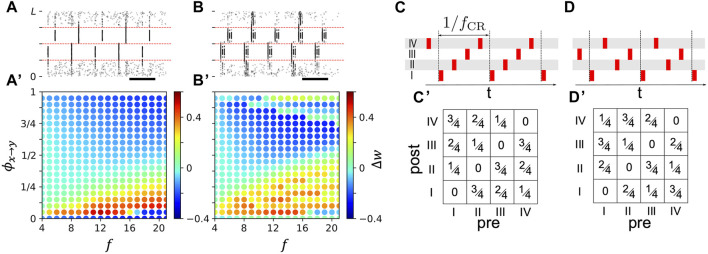
Results: The characteristic length scale of synaptic connections relative to the distance between stimulation sites plays a key role in CR parameter adjustment. In networks with short synaptic length scales, a substantial synaptic downregulation can be achieved by selecting appropriate stimulus-related parameters, such as the stimulus amplitude and shape, regardless of the employed spatiotemporal pattern of stimulus deliveries. Complex stimulus shapes can induce local connectivity patterns in the vicinity of the stimulation sites. In contrast, in networks with longer synaptic length scales, the spatiotemporal sequence of stimulus deliveries is of major importance for synaptic downregulation. In particular, rapid shuffling of the stimulus sequence is advantageous for synaptic downregulation.

Conclusion: Our results suggest that CR stimulation parameters can be adjusted to synaptic connectivity to further improve the long-lasting effects. Furthermore, shuffling of CR sequences is advantageous for long-lasting desynchronization effects. Our work provides important hypotheses on CR parameter selection for future preclinical and clinical studies.

Keywords: coordinated reset stimulation; desynchronization; networks of spiking neurons; spatial neural networks; spike-timing-dependent plasticity; synchronization.


Conflict of interest statement

JK and PT filed a Stanford-owned provisional patent related to the presented results. The author(s) declared that they were an editorial board member of Frontiers, at the time of submission. This had no impact on the peer review process and the final decision.

Figures

FIGURE 1
FIGURE 1
Connection probability and connectivity diagrams for network realizations with different synaptic length scales. (A–C): Plots of the connection probability as a function of the distance, d ij , between two neurons. We normalized p (d ij ) such that 0dup(u)=1 . Labels indicate synaptic length scales. (A’–C’) Corresponding connectivity diagrams. Black dots indicate a synaptic connection between a presynaptic neuron at location x pre and a postsynaptic neuron at location x post. Panels show results for synaptic length scales s =0.08L (A, A′), 0.4L (B, B′), and 2.0L (C, C′). Here, L is the system’s length scale. In units of the distance between adjacent stimulation sites, d, the synaptic lengths scales are s =0.32 d (A), 1.6 d (B), and 8.0 d (C) (see below).
FIGURE 2
FIGURE 2
Coexistence of strongly connected synchronized and weakly connected desynchronized states for different synaptic length scales. Simulated traces of the Kuramoto order parameter ρ, Eq. 7, (A–C) for networks with different synaptic length scales, s (columns). Panels in the bottom row show corresponding traces of the mean synaptic weight, ⟨w⟩ obtained by averaging the weights of all synapses in the network. Gray tones mark trajectories for different initial mean synaptic weights. At t = 0 individual synaptic weights were randomly set to either zero or one such that a given mean synaptic weight was realized. Synaptic length scales were the same as in Figure 1, i.e., s = 0.08L (A,A ), s = 0.4L (B,B ), s =2L (C,C ).
FIGURE 3
FIGURE 3
Illustration of stimuli and CR pattern-related parameters. We distinguish between individual stimuli and the spatio-temporal pattern of stimulus deliveries (CR pattern). Individual stimuli are characterized by the stimulus shape (left). Two different stimulus shapes are considered throughout the present paper: burst stimuli consisting of three charge-balanced pulses separated by T intra = 1/f intra (top left) and single-pulse stimuli (bottom left). Stimulus-related parameters include the stimulus amplitude, the number of pulses per stimulus, the intraburst frequency, f intra, and the waveform during individual charge-balanced pulses, here characterized by the widths of the excitatory and the inhibitory rectangular pulses (left). Several CR patterns are used throughout the present paper (right). In the right panels, red rectangles mark individual stimuli. We distinguish between non-shuffled CR patterns in which the same CR sequence is repeated for the entire stimulation period (top right) and shuffled CR patterns in which a new CR sequence of stimulus deliveries to the stimulation sites (Roman numerals) is generated after each cycle period, T CR, by shuffling the M = 4 Roman numerals, referring to individual sites, and randomly drawing M Roman numerals without replacement (bottom right). The shuffled CR pattern shown in the bottom right consists of the CR sequences “I,III,II,IV”, and before the first shuffling, and “II,I,III,IV”, after the first shuffling. After the second shuffling, only the first half of a CR sequence is shown with stimulus deliveries to sites IV and II.
FIGURE 4
FIGURE 4
CR stimulation-induced dynamics depend on network structure. Simulated traces of the Kuramoto order parameter ρ, Eq. 7, for networks with different synaptic length scales. s = 0.08 L (A,D,G), 0.4 L (B,E,H), and 2.0 L (C,F,I), and for different stimulation frequencies, f CR = 4 Hz (A–C), 10 Hz (D–F), and 21 Hz (G–I). Individual stimuli consisted of bursts of three stimulus pulses and an intraburst frequency of 130 Hz, the corresponding time between subsequent pulses within a burst, T intra, is 1/130 s (see schematic on the top right). Black traces show results for shuffled CR, often referred to as CR with rapidly varying sequence (Tass and Majtanik, 2006; Zeitler and Tass, 2015)). The stimulation period of 1000 s is marked in light red. Colored traces show results for non-shuffled CR with CR sequences “I,II,III,IV”,“I,II,IV,III”,“I,III,II,IV”,“I,III,IV,II”,“I,IV,II,III”, and “I,IV,III,II”. The corresponding sequences of stimulation site activations within a CR cycle are illustrated on the right-hand side. Parameters: A stim = 2.5 and σ = d s/4 Π.
FIGURE 5
FIGURE 5
Synaptic pathways induced by CR stimulation with burst stimuli. Results of simulations of the LIF network model prior to stimulation (A–D), and during stimulation with non-shuffled CR with CR sequences “I,II,III,IV” (E–H) and “I,IV,II,III” (I–L) and shuffled CR (M–P) are shown. Left panels show raster plots of neuronal spiking activity. Black horizontal bars mark a time interval of 100 ms. The other panels show connectivity diagrams with dark colors marking strong connections and light gray marking weak connections between presynaptic neurons at locations x pre and postsynaptic neurons at locations x post. Different columns show results for networks with different synaptic length scales, s (see labels at the top of respective columns). In the brackets, we give synaptic length scales in units of the distance between adjacent stimulation sites, d. The labels inside individual panels show the mean synaptic weight ⟨w⟩. Parameters: A = 2.5, f CR = 10 Hz and σ = d/4 Π. Raster plots in panels (A,E,I, M) are shown for s = 0.08L. Connectivity diagrams (F–H,J–L, N–P) were recorded at the end of the 1000 s stimulation period. Raster plots (E,I,M) show the last second of this period.
FIGURE 6
FIGURE 6
Synaptic pathways induced by CR stimulation with single-pulse stimuli. Results of stimulation of the LIF network model prior to stimulation (A–D), and during simulation with non-shuffled CR with CR sequences “I,II,III,IV” (E–H) and “I,IV,II,III” (I–L) and shuffled CR (M–P) are shown. In contrast to Figure 5, we used single-pulse stimuli. The raster plots on the left show neuronal spiking activity. Black horizontal bars mark a time interval of 100 ms. The other panels show connectivity diagrams with dark colors marking strong connections and light gray marking weak connections between presynaptic neurons at locations x pre and postsynaptic neurons at locations x post. Different columns show results for networks with different synaptic length scales, s (see labels at the top of respective columns). Labels inside the panels show the value of the mean synaptic weight. Parameters: A = 2.5 and σ = d/4 Π. Raster plots in panels (A,E,I, M) are shown for s = 0.08L. Connectivity diagrams were recorded at the end of the 1000 s stimulation period. The raster plots on the left show the last second before stimulation onset (A) and the last second of the 1000 s of CR stimulation period (E,I,M).
FIGURE 7
FIGURE 7
Relative numbers of connections between neuronal subpopulations closest to different combinations of stimulation sites for different synaptic length scales (A–C). Black horizontal lines represents analytical estimates (Eq. 10) and crosses show data from five network realizations. Presynaptic and postsynaptic neuronal subpopulations are denoted by the Roman numeral of the closest stimulation site, i.e., “I-II” refers to the presynaptic subpopulation of all neurons within distance d/2 of stimulation site “I” and postsynaptic subpopulation of all neurons within distance d/2 of stimulation site “II”.
FIGURE 8
FIGURE 8
Stimulation-induced change of mean synaptic weight depends on phase lag between stimuli delivered to postsynaptic and presynaptic neuronal subpopulation. (A): Raster plot of neuronal spiking activity during two-site stimulation with single-pulse stimuli for ϕ xy = 0.3. Phase lags were normalized to one, i.e., ϕ xy ∈ [0, 1), such that ϕ xy /f is the time lag between the onsets of stimuli delivered to population y and x, respectively. (A)’: Change of mean synaptic weight of synapses between postsynaptic neurons closest to a site located at 5L/8 and presynaptic neurons closest to a site located at 3L/8 in the first 20 s of stimulation (enclosed by red dashed lines in (A) as function of ϕ xy and stimulation frequency, f. (B) and (B)’: Same as (A) and (A′) but for stimulation with burst stimuli with three pulses per burst and an intraburst frequency of 130 Hz. (C, D): Examples of CR sequences (top). Roman numerals denote stimulation sites. Bottom panels show corresponding matrices of resulting phase lags between stimuli delivered to postsynaptic and presynaptic neurons affected by respective stimulation sites.
FIGURE 9
FIGURE 9
Mean synaptic weights of intra- (A–C) and (D–F) and inter-population synapses (A’–C’) and (D’–F’) after long stimulation with non-shuffled CR with different CR sequences and shuffled CR. Approximations from Eq. 14 (lines) for t = 3000 s are compared to simulation results after 3000 s of stimulation (symbols) for networks with different synaptic length scales, s, (columns) and for single-pulse (A–C) and (A’–C’) and burst stimuli (D–F) and (D'-F'). Colors mark different CR patterns (see legend in panel (A) and Figure 4). Parameters: A stim = 2.5, σ = d/4 Π.

Similar articles

Cited by

References

    1. Adamchic I., Hauptmann C., Barnikol U. B., Pawelczyk N., Popovych O., Barnikol T. T., et al. (2014). Coordinated reset neuromodulation for Parkinson’s disease: proof-of-concept study. Mov. Disord. 29, 1679–1684. 10.1002/mds.25923 - DOI - PMC - PubMed
    1. Afsharpour S. (1985). Light microscopic analysis of golgi-impregnated rat subthalamic neurons. J. Comp. Neurol. 236, 1–13. 10.1002/cne.902360102 - DOI - PubMed
    1. Anil S., Lu H., Rotter S., Vlachos A. (2023). Repetitive transcranial magnetic stimulation (rTMS) triggers dose-dependent homeostatic rewiring in recurrent neuronal networks. PLoS Comput. Biol. 19, e1011027. 10.1371/journal.pcbi.1011027 - DOI - PMC - PubMed
    1. Barnikol U. B., Popovych O. V., Hauptmann C., Sturm V., Freund H.-J., Tass P. A. (2008). Tremor entrainment by patterned low-frequency stimulation. Phil. Trans. R. Soc. A 366, 3545–3573. 10.1098/rsta.2008.0104 - DOI - PubMed
    1. Bartsch R. P., Liu K. K. L., Bashan A., Ivanov P. C. (2015). Network physiology: how organ systems dynamically interact. PLoS ONE 10, e0142143. 10.1371/journal.pone.0142143 - DOI - PMC - PubMed

LinkOut - more resources