

The characteristics of brain atrophy prior to the onset of Alzheimer's disease: a longitudinal study
- PMID: 38863784
- PMCID: PMC11165148
- DOI: 10.3389/fnagi.2024.1344920
The characteristics of brain atrophy prior to the onset of Alzheimer's disease: a longitudinal study
Abstract
Objective: We aimed to use the onset time of Alzheimer's disease (AD) as the reference time to longitudinally investigate the atrophic characteristics of brain structures prior to the onset of AD.
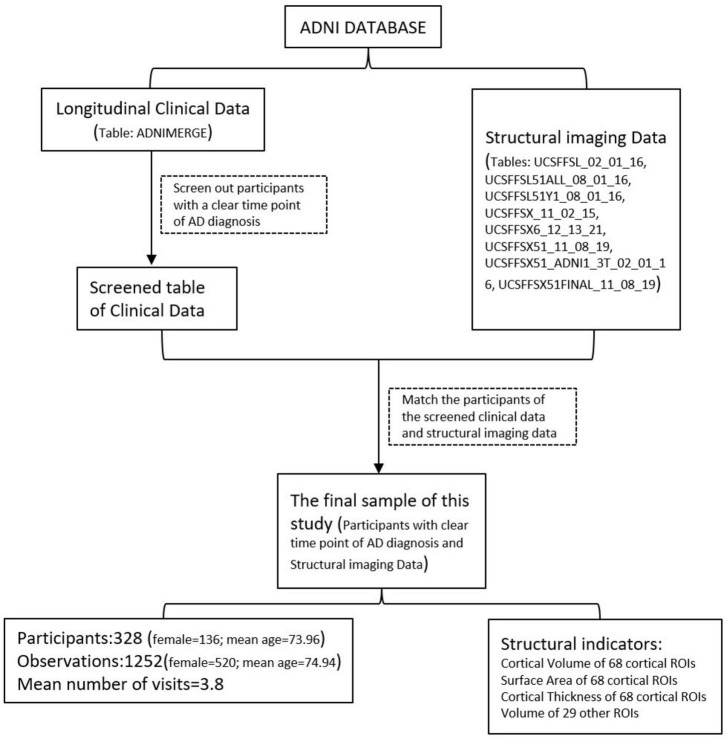
Materials and methods: A total of 328 participants from the ADNI database with clear onset of AD and structural imaging data were included in our study. The time before the onset of AD (abbreviated as BAD) was calculated. We investigated the longitudinal brain changes in 97 regions using multivariate linear mixed effects regression models.
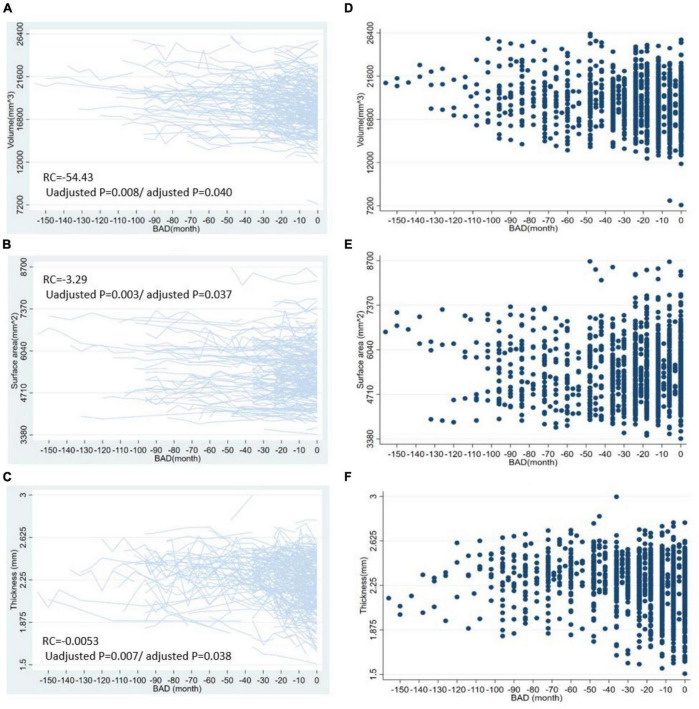
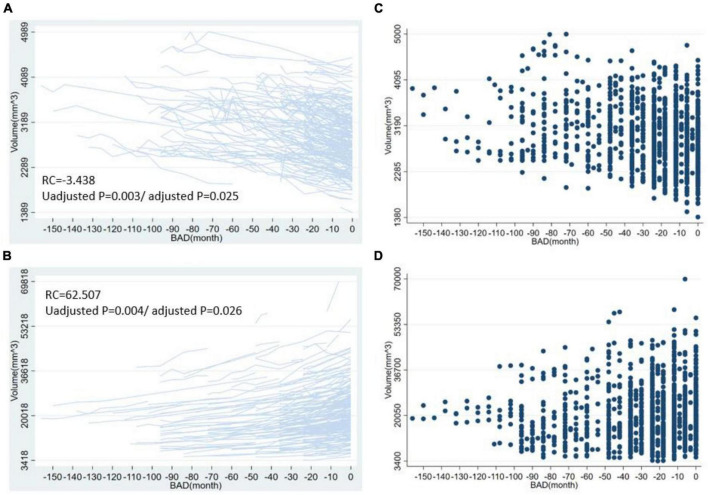
Results: The average BAD was -28.15 months, with a range from -156 to 0 months. The 54 brain regions showed significant atrophy prior to the onset of AD, and these regions were mainly distributed in the frontal and temporal lobes. The parietal and occipital lobe exhibited relatively less atrophy than the other brain lobes. Sex, age, and magnetic field strength had greater direct impacts on structural indicators than APOE genotype and education. The analysis of interaction effects revealed that the APOE ε4 mutation carriers exhibited more severe structural changes in specific brain regions as the BAD increased. However, sex, age, and education had minimal regulatory influence on the structural changes associated with BAD.
Conclusion: Longitudinal analysis, with the onset time point of AD as the reference, can accurately describe the features of structural changes preceding the onset of AD and provide a comprehensive understanding of AD development.
Keywords: 3D T1; Alzheimer’s disease; brain atrophy; dementia; longitudinal study.
Copyright © 2024 Hu, Zhu and Zhang.
Conflict of interest statement
The authors declare that the research was conducted in the absence of any commercial or financial relationships that could be construed as a potential conflict of interest.
Figures
References
-
- Apostolova L. G., Zarow C., Biado K., Hurtz S., Boccardi M., Somme J., et al. (2015). Relationship between hippocampal atrophy and neuropathology markers: A 7T MRI validation study of the EADC-ADNI harmonized hippocampal segmentation protocol. Alzheimers Dement. 11 139–150. 10.1016/j.jalz.2015.01.001 - DOI - PMC - PubMed
-
- Arenaza-Urquijo E. M., Landeau B., La Joie R., Mevel K., Mézenge F., Perrotin A., et al. (2013). Relationships between years of education and gray matter volume, metabolism and functional connectivity in healthy elders. Neuroimage 83 450–457. - PubMed
LinkOut - more resources
Full Text Sources
Research Materials
Miscellaneous