

Instrumental variable estimation for functional concurrent regression models
- PMID: 38863803
- PMCID: PMC11163992
- DOI: 10.1080/02664763.2023.2229968
Instrumental variable estimation for functional concurrent regression models
Abstract
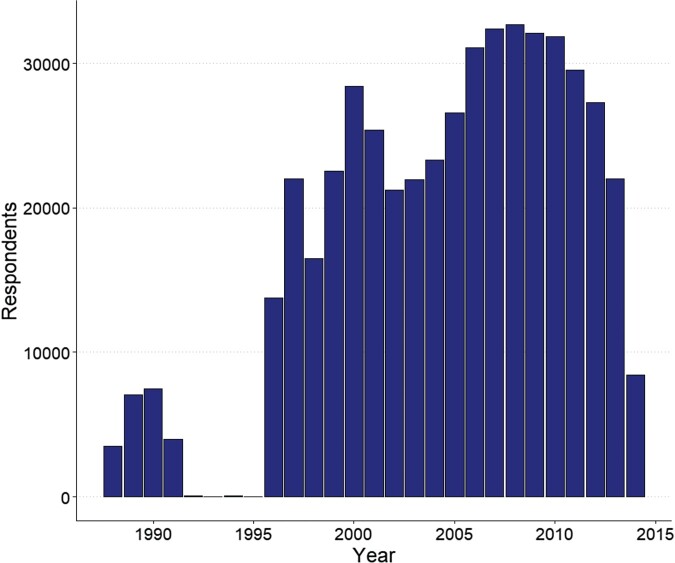
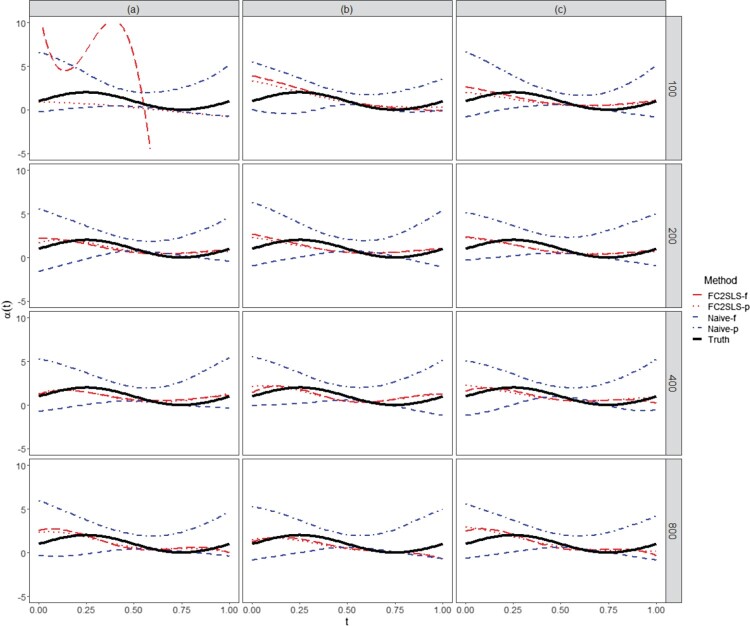
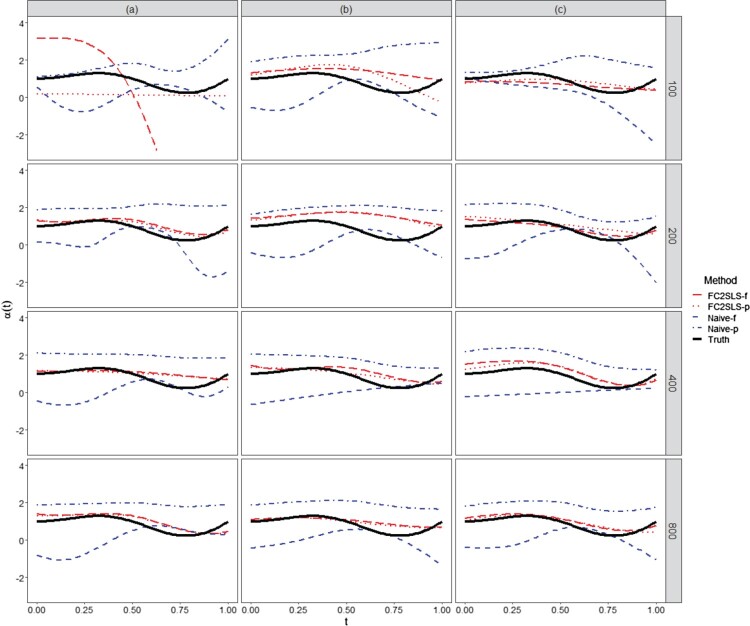
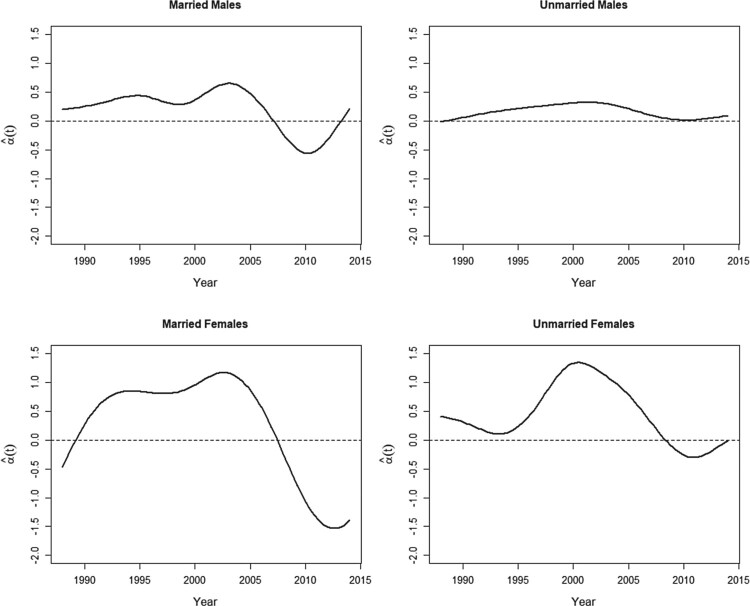
In this work we propose a functional concurrent regression model to estimate labor supply elasticities over the years 1988 through 2014 using Current Population Survey data. Assuming, as is common, that individuals' wages are endogenous, we introduce instrumental variables in a two-stage least squares approach to estimate the desired labor supply elasticities. Furthermore, we tailor our estimation method to sparse functional data. Though recent work has incorporated instrumental variables into other functional regression models, to our knowledge this has not yet been done in the functional concurrent regression model, and most existing literature is not suited for sparse functional data. We show through simulations that this two-stage least squares approach greatly eliminates the bias introduced by a naive model (i.e. one that does not acknowledge endogeneity) and produces accurate coefficient estimates for moderate sample sizes.
Keywords: Functional concurrent regression; instrumental variable; labor supply elasticity; sparse functional data.
© 2023 Informa UK Limited, trading as Taylor & Francis Group.
Conflict of interest statement
No potential conflict of interest was reported by the author(s).
Figures
References
-
- Aaronson D. and French E., The effects of progressive taxation on labor supply when hours and wages are jointly determined, J. Hum. Resour. 4 (2009), pp. 386–408.
-
- Altonji J.G., Intertemporal substitution in labor supply: evidence from micro data, J. Political Econ. 94 (1986), pp. S176–S215.
-
- Angrist J.D., Grouped-data estimation and testing in simple labor-supply models, J. Econom. 47 (1991), pp. 243–266.
-
- Angrist J.D., Imbens G.W., and Rubin D.B., Identification of causal effects using instrumental variables, J. Am. Stat. Assoc. 91 (1996), pp. 444–455.
-
- Angrist J.D. and Krueger A.B., Instrumental variables and the search for identification: from supply and demand to natural experiments, J. Econ. Perspectives 15 (2001), pp. 69–85.
LinkOut - more resources
Full Text Sources