. 2024 May 28:12:1382960.
doi: 10.3389/fcell.2024.1382960. eCollection 2024.

Single cell RNA-sequencing and RNA-tomography of the avian embryo extending body axis

Affiliations

Single cell RNA-sequencing and RNA-tomography of the avian embryo extending body axis

G F Mok et al. Front Cell Dev Biol. .

Abstract

Introduction: Vertebrate body axis formation initiates during gastrulation and continues within the tail bud at the posterior end of the embryo. Major structures in the trunk are paired somites, which generate the musculoskeletal system, the spinal cord-forming part of the central nervous system, and the notochord, with important patterning functions. The specification of these different cell lineages by key signalling pathways and transcription factors is essential, however, a global map of cell types and expressed genes in the avian trunk is missing. Methods: Here we use high-throughput sequencing approaches to generate a molecular map of the emerging trunk and tailbud in the chick embryo. Results and Discussion: Single cell RNA-sequencing (scRNA-seq) identifies discrete cell lineages including somites, neural tube, neural crest, lateral plate mesoderm, ectoderm, endothelial and blood progenitors. In addition, RNA-seq of sequential tissue sections (RNA-tomography) provides a spatially resolved, genome-wide expression dataset for the avian tailbud and emerging body, comparable to other model systems. Combining the single cell and RNA-tomography datasets, we identify spatially restricted genes, focusing on somites and early myoblasts. Thus, this high-resolution transcriptome map incorporating cell types in the embryonic trunk can expose molecular pathways involved in body axis development.

Keywords: RNA-tomography; axis extension; chick embryo; single cell RNA-sequencing; somites.


Conflict of interest statement

The authors declare that the research was conducted in the absence of any commercial or financial relationships that could be construed as a potential conflict of interest. The author(s) declared that they were an editorial board member of Frontiers, at the time of submission. This had no impact on the peer review process and the final decision.

Figures

FIGURE 1
FIGURE 1
Cell population composition and signatures of the HH14 chicken embryo trunk. (A) Trunk regions, indicated by stippled lines, of five stage HH14 chicken embryos were collected for scRNA-seq using 10X Genomics Chromium. (B) Illustration of developing tissues captured: pre-somitic mesoderm (psm), epithelial somites, maturing somites, lateral plate mesoderm (lpm), surface ectoderm, neural tube and neural crest cells, and notochord. (C) Unsupervised UMAP subdivides cells within the trunk into 10 clusters—lateral plate mesoderm, neural progenitors, early somite, maturing somite, pre-somitic mesoderm, ectoderm, blood progenitors, endothelial progenitors and neural crest. (D) Heatmap of the top 10 genes significantly enriched in each cluster; representative genes are shown. (E) UMAPs show log normalised counts of a representative gene for each cluster. Colour intensity is proportional to expression level of each gene. (F) Distribution of cell cycle phases visualised using Seurat cell cycle scoring.
FIGURE 2
FIGURE 2
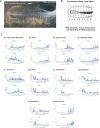
RNA-tomography reveals distinct gene expression profiles along the embryonic axis. (A) Stage HH14 chick embryo trunk was sectioned along the anterior-to-posterior axis, from extraembryonic tissue at the posterior end, through the tailbud and pre-somitic mesoderm towards maturing somites. (B) Individual sections were collected in wells followed by RNA isolation and cDNA preparation using section specific barcodes. After that, samples were pooled for linear amplification and sequence library preparation. (C) Spatial expression traces are shown as line plots, left to right represent the posterior to anterior positions. The representative genes shown correspond to the tissue types identified from the scRNA-seq clustering.
FIGURE 3
FIGURE 3
K-means clustering identifies biological components along the posterior-to-anterior axis. (A) Hierarchical cluster analysis of gene expression per section (total 180). Distinct gene expression clusters correspond to different regions along the axis, characterised by extraembryonic tissue, tailbud, pre-somitic mesoderm and epithelial somites—indicated by boxed areas. RNA sequencing reads per gene were normalised against the total read count per section. (B) Spatial expression traces for representative genes in each corresponding cluster, left to right represent the posterior to anterior positions. Cluster 1 represents extraembryonic tissue, cluster 2 tailbud and psm, cluster 3 epithelial somites. (C) Gene ontology on genes enriched in the extraembryonic tissue, tailbud and pre-somitic mesoderm, and epithelial somites and neural tube. (D) Spatial expression traces for signalling pathways associated with anterior-posterior patterning such as WNT (Wnt5A), FGF (Fgf8) and retinoic acid (Aldh1A2), which are expressed in opposing gradients. Spatial expression traces for genes associated with paraxial mesoderm differentiation (Meox1, Tcf15, and Mesp1), with Mesp1 highlighting a discreet region in the psm. Spatial expression traces for Hox genes involved in anterior-posterior patterning (Hoxd11, Hoxc9, and Hoxb1). Expression of Hoxd11 and Hoxc9 displays a clear boundary within the axial region sectioned, while Hoxb1 expression remains high. Line plots for the other Hox genes are in Supplementary Figure S1. (E) Dot plot showing average expression of genes and percentage expressed in each cell cluster associated with the WNT, FGF, NOTCH, and BMP signalling pathways.
FIGURE 4
FIGURE 4
Transcriptome map of the embryonic trunk with high spatial resolution. (A–C) UMAP plot and violin plot of representative genes for different tissues, with comparison to Spatial expression trace along the posterior-to-anterior axis. The colour coding in the violin plots corresponds to the clusters identified in the scRNA-seq. Corresponding in situ hybridisation are shown for (A) Hbm—blood islands, (B) Wnt5A—tailbud, (C) Tbx22—caudal somite halves. This provides a visual point of reference when comparing with the spatial expression along the axis shown by the line plots. See also published gene expression patterns in the data base: http://geisha.arizona.edu/geisha/.
FIGURE 5
FIGURE 5
Differentially expressed genes in pre-somitic mesoderm and somites. (A) Sub-clustering identifies specific genes within the psm, early somites and maturing somites. Psm is characterised by MSGN1 expression while Tcf15, Meox1 and Tbx22 markers represent somites. Restricted Fst expression may correlate with epaxial myoblasts. (B–D) UMAP, violin plots and spatial expression traces show expression for Foxd1, Olfml3 and Lrig3, not previously identified in somites. The colour coding in the violin plots corresponds to the clusters identified in the scRNA-seq. Violin plots show higher levels of expression in maturing somites for Foxd1 and Olfml3 and a broader distribution for Lrig3. Whole mount in situ hybridisation confirmed the spatially restricted expression of Foxd1 and Olfml3 in epithelial and maturing somites and of Lrig3 in the psm and somites.

Similar articles

Cited by

References

    1. Abraira V. E., Del Rio T., Tucker A. F., Slonimsky J., Keirnes H. L., Goodrich L. V. (2008). Cross-repressive interactions between Lrig3 and netrin 1 shape the architecture of the inner ear. Development 135, 4091–4099. 10.1242/dev.029330 - DOI - PMC - PubMed
    1. Anderson C., Hill B., Lu H. C., Moverley A., Yang Y., Oliveira N. M. M., et al. (2019). A 3D molecular atlas of the chick embryonic heart. Dev. Biol. 456, 40–46. 10.1016/j.ydbio.2019.07.003 - DOI - PubMed
    1. Baranski M., Berdougo E., Sandler J. S., Darnell D. K., Burrus L. W. (2000). The dynamic expression pattern of frzb-1 suggests multiple roles in chick development. Dev. Biol. 217, 25–41. 10.1006/dbio.1999.9516 - DOI - PubMed
    1. Bell G. W., Yatskievych T. A., Antin P. B. (2004). GEISHA, a whole-mount in situ hybridization gene expression screen in chicken embryos. Dev. Dyn. 229, 677–687. 10.1002/dvdy.10503 - DOI - PubMed
    1. Benazeraf B., Pourquie O. (2013). Formation and segmentation of the vertebrate body axis. Annu. Rev. Cell. Dev. Biol. 29, 1–26. 10.1146/annurev-cellbio-101011-155703 - DOI - PubMed

LinkOut - more resources