. 2024 May 28:15:1389550.
doi: 10.3389/fphar.2024.1389550. eCollection 2024.

Integrated transcriptomic and immunological profiling reveals new diagnostic and prognostic models for cutaneous melanoma

Affiliations

Integrated transcriptomic and immunological profiling reveals new diagnostic and prognostic models for cutaneous melanoma

Changchang Li et al. Front Pharmacol. .

Abstract

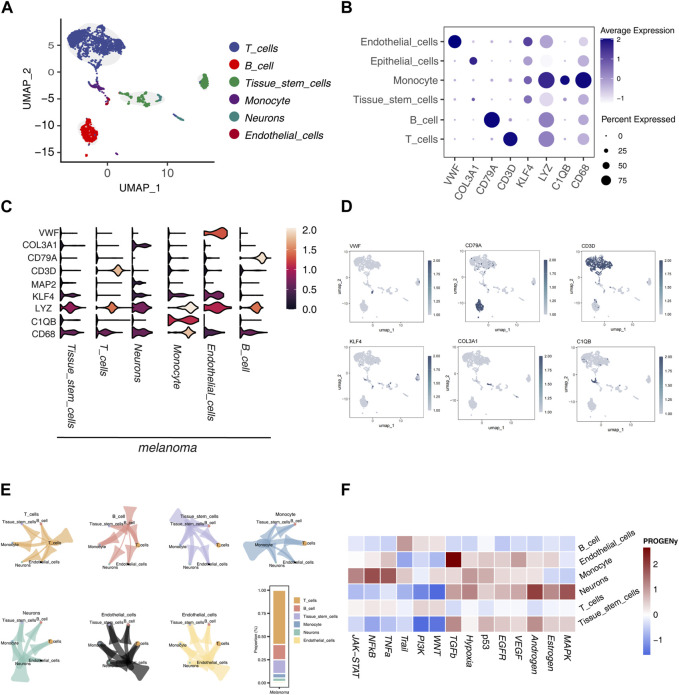
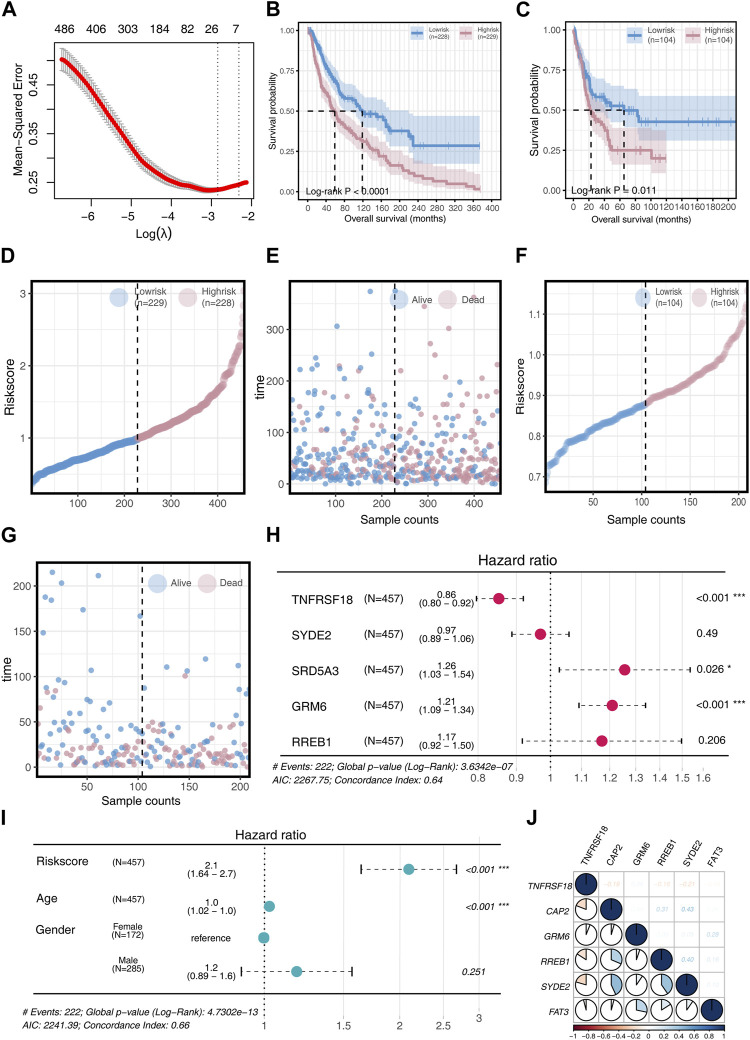
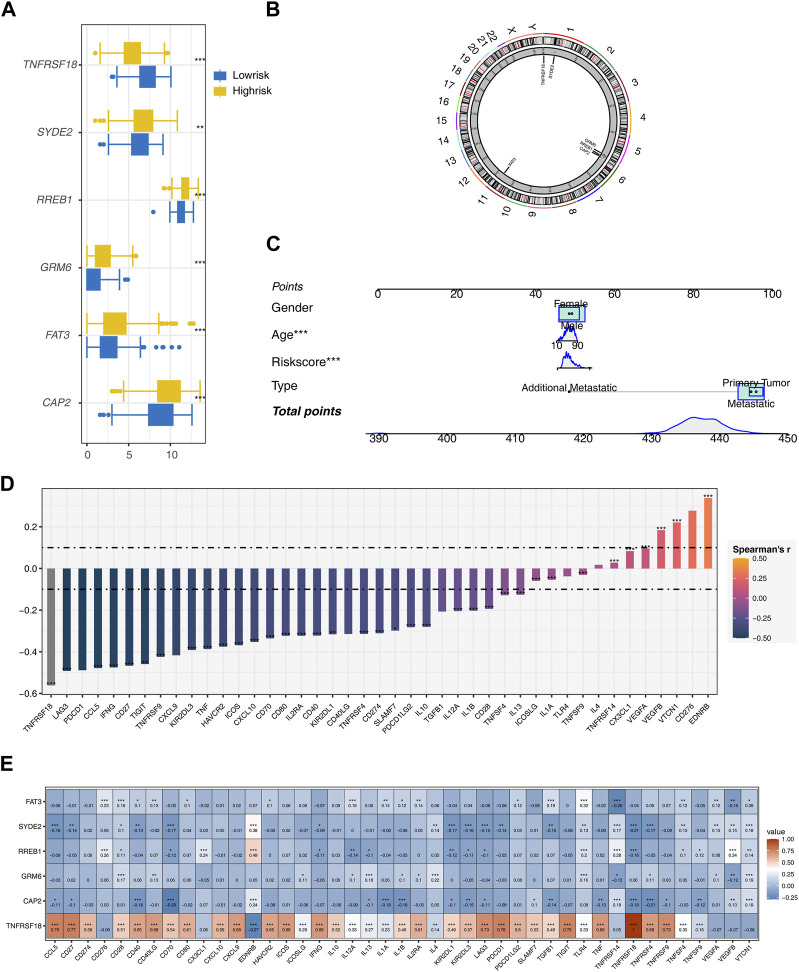
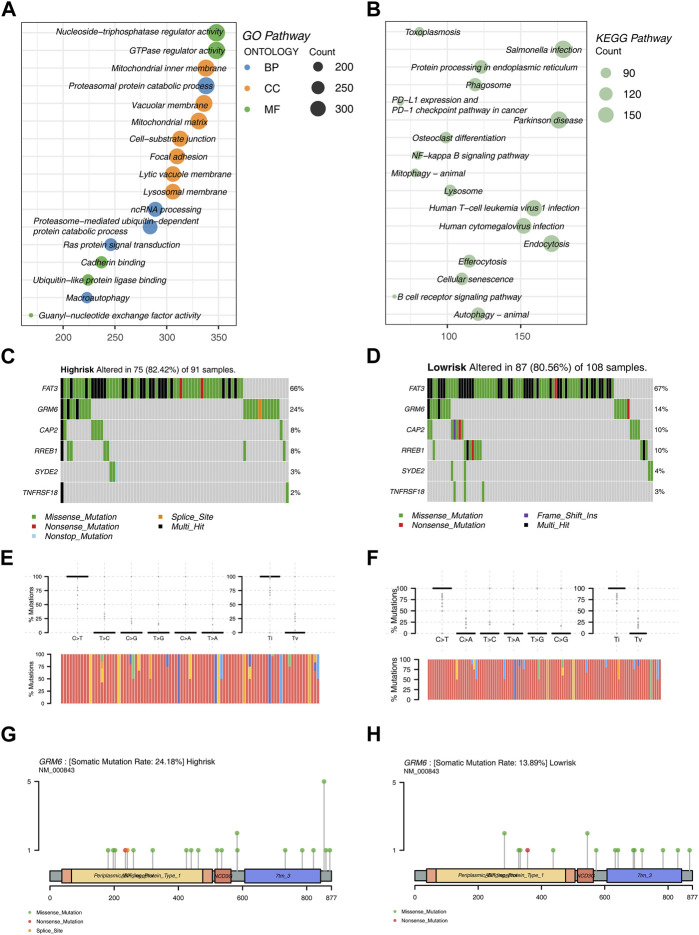
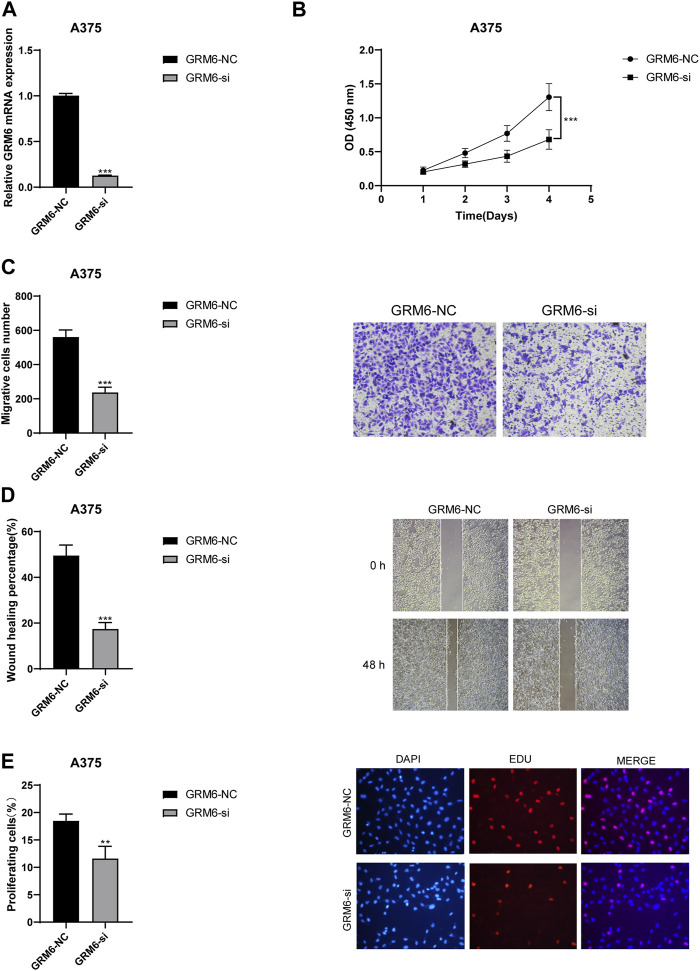
The mortality rate associated with cutaneous melanoma (SKCM) remains alarmingly high, highlighting the urgent need for a deeper understanding of its molecular underpinnings. In our study, we leveraged bulk transcriptome sequencing data from the SKCM cohort available in public databases such as TCGA and GEO. We utilized distinct datasets for training and validation purposes and also incorporated mutation and clinical data from TCGA, along with single-cell sequencing data from GEO. Through dimensionality reduction, we annotated cell subtypes within the single-cell data and analyzed the expression of tumor-related pathways across these subtypes. We identified differentially expressed genes (DEGs) in the training set, which were further refined using the Least Absolute Shrinkage and Selection Operator (LASSO) machine learning algorithm, employing tenfold cross-validation. This enabled the construction of a prognostic model, whose diagnostic efficacy we subsequently validated. We conducted Gene Ontology (GO) and Kyoto Encyclopedia of Genes and Genomes (KEGG) analyses on the DEGs, and performed immunological profiling on two risk groups to elucidate the relationship between model genes and the immune responses relevant to SKCM diagnosis, treatment, and prognosis. We also knocked down the GMR6 expression level in the melanoma cells and verified its effect on cancer through multiple experiments. The results indicate that the GMR6 gene plays a role in promoting the proliferation, invasion, and migration of cancer cells in human melanoma. Our findings offer novel insights and a theoretical framework that could enhance prognosis, treatment, and drug development strategies for SKCM, potentially leading to more precise therapeutic interventions.

Keywords: LASSO machine learning algorithm; SKCM; differential gene expression; immune infiltration analysis; melanoma.


Conflict of interest statement

The authors declare that the research was conducted in the absence of any commercial or financial relationships that could be construed as a potential conflict of interest.

Figures

FIGURE 1
FIGURE 1
Single-Cell Sequencing Data Analysis (A) UMAP dimensionality reduction and annotation of single-cell sequencing data GSE72056, categorizing cell subgroups into 6 classes. (B) Dot plot illustrating the differential expression of marker genes in different subgroups. (C) Violin plot displaying the differential expression of marker genes in different subgroups. (D) Coloring and marking marker gene expression distribution in UMAP visualization. (E) Analysis of communication relationships between cell subgroups using the “cellchat” package, visualized. (F) Heatmap displaying the score differences of each tumor-related pathway calculated by the “PROGENy” package in each cell.
FIGURE 2
FIGURE 2
Model Construction and Validation (A) Acquisition of DEGs for univariate COX regression analysis and implementation of LASSO machine learning to construct a prognostic model. (B) Survival differences in two risk groups in the training set. (C) Survival differences in two risk groups in the validation set. (D) Risk score changes in two risk groups in the training set. (E) Survival time comparison in two risk groups in the training set. (F) Risk score changes in two risk groups in the validation set. (G) Survival time comparison in two risk groups in the validation set. (H) Univariate COX regression analysis to determine if model genes can serve as prognostic factors, visualized through a forest plot. (I) Univariate COX regression analysis to determine if Risk score, Age, and Gender can serve as prognostic factors, visualized through a forest plot. (J) Analysis of inter-gene correlations in the model.
FIGURE 3
FIGURE 3
Further Analysis of the Model (A) Expression differences of model genes between two risk groups. (B) Chromosome circular plot displaying the genomic locations of model genes. (C) Construction of a nomogram prognostic model incorporating Risk score, Age, Gender, and Type. (D) Calculation of the correlation between the riskscore model and 43 immune checkpoint genes using Spearman’s correlation method. (E) Heatmap presenting the expression correlations between model genes and immune checkpoint genes.
FIGURE 4
FIGURE 4
Enrichment Analysis and Mutation Analysis (A) Bubble plot illustrating enriched functional pathways in GO analysis of DEGs. (B) Bubble plot illustrating enriched functional pathways in KEGG analysis of DEGs. (C) Mutation analysis in the high-risk group of the training set. (D) Mutation analysis in the low-risk group of the training set. (E) Top 6 genes and the proportion of nucleotide transitions and transversions in the high-risk group. (F) Top 6 genes and the proportion of nucleotide transitions and transversions in the low-risk group. (G) Mutation sites and types of GRM6 in the high-risk group. (H) Mutation sites and types of GRM6 in the low-risk group.
FIGURE 5
FIGURE 5
Analysis Based on ssGSEA Immune Algorithm (A) Immunocell scoring using the ssGSEA algorithm for two risk groups. (B) Correlation between Risk score and Macrophage. (C) Correlation between Risk score and Activated CD8 T cell. (D) Correlation between Risk score and Monocyte. (E) Correlation between Risk score and CD56dim natural killer cell. (F) Correlation between Risk score and Gamma delta cell. (G) Correlation between Risk score and Immature dendritic cell. (H) Correlation between TNFRSF18 and Monocyte. (I) Correlation between CAP2 and Monocyte. (J) Correlation between SYDE2 and Monocyte. (K) Correlation between FAT3 and Monocyte. (L) Heatmap of the correlation between risk score and immune cells. Significance levels are denoted as follows: *p < 0.05, **p < 0.01, and ***p < 0.001.
FIGURE 6
FIGURE 6
Analysis Based on MCPcounter Immune Algorithm (A) Boxplot showing differences in the scores of 10 immune cell types between two risk groups. (B) Correlation between FAT3 and Monocyte lineage. (C) Correlation between FAT3 and Myeloid dendritic cells. (D) Correlation between TNFRSF18 and Myeloid dendritic cells. (E) Correlation between TNFRSF18 and Fibroblasts. (F) Correlation between TNFRSF18 and Endothelial cells. (G) Correlation between RREB1 and Monocyte lineage. (H) Correlation between ERM6 and Monocyte lineage. (I) Correlation between Endothelial cells and Risk score. (J) Correlation between Cytotoxic lymphocytes and Risk score. (K) Correlation between B lineage and Risk score. (L) Correlation between Myeloid dendritic cells and Risk score. (M) Heatmap representing the correlation between model genes and immune cells. (N) Heatmap representing the correlation between Risk score and immune cells.
FIGURE 7
FIGURE 7
Analysis Based on xCELL Immune Algorithm (A) Boxplot illustrating differences in immune cell infiltration between two risk groups. (B) Heatmap showing the correlation between Risk score and immune cells.
FIGURE 8
FIGURE 8
Drug Sensitivity Analysis (A) Volcano plot illustrating differences in drug sensitivity between two risk groups. (B) Heatmap depicting the correlation between model genes and 61 different drugs. (C) Boxplot showing the sensitivity difference of RO-3306_1052 between two risk groups. (D) Boxplot showing the sensitivity difference of BI-2536_1086 between two risk groups. (E) Boxplot showing the sensitivity difference of AZ960_1250 between two risk groups. (F) Boxplot showing the sensitivity difference of Entospletinib_1630 between two risk groups. (G) Boxplot showing the sensitivity difference of Navitoclax_1011 between two risk groups. (H) Boxplot showing the sensitivity difference of XAV939_1268 between two risk groups. (I) Boxplot showing the sensitivity difference of WEHI-539_1997 between two risk groups. (J) Boxplot showing the sensitivity difference of 5-Fluorouracil1073 between two risk groups.
FIGURE 9
FIGURE 9
Functional consequences of GRM6 knockdown in A375 melanoma cells. (A) RT-qPCR results showing effective knockdown of GRM6 expression in the “GRM6-si” group compared to the control “GRM6-NC” group. (B) CCK8 assay results indicating a significant reduction in cell proliferation ability following GRM6 gene silencing. (C) Transwell assay results demonstrating decreased invasion ability in A375 cells after GRM6 knockdown. (D) Wound healing assay data revealing reduced migration ability of cells in the si-GRM6 group. (E) EdU assay results confirming a significant decrease in proliferation rates in GRM6-silenced A375 cells.

Similar articles

Cited by

References

    1. Cui Y., Wu J., Zhou Z., Ma J., Dong L. (2022). Two novel lncRNAs AF111167.2 and AL162377.1 targeting miR-21-5p mediated down expression of SYDE2 correlates with poor prognosis and tumor immune infiltration of ccRCC. Heliyon 8 (10), e11079. 10.1016/j.heliyon.2022.e11079 - DOI - PMC - PubMed
    1. Date S., Nibu Y., Yanai K., Hirata J., Yagami K., Fukamizu A. (2004). Finb, a multiple zinc finger protein, represses transcription of the human angiotensinogen gene. Int. J. Mol. Med. 13 (5), 637–642. 10.3892/ijmm.13.5.637 - DOI - PubMed
    1. Davey M. G., Miller N., McInerney N. M. (2021). A review of epidemiology and cancer biology of malignant melanoma. Cureus 13 (5), e15087. 10.7759/cureus.15087 - DOI - PMC - PubMed
    1. Davis L. E., Shalin S. C., Tackett A. J. (2019). Current state of melanoma diagnosis and treatment. Cancer Biol. Ther. 20 (11), 1366–1379. 10.1080/15384047.2019.1640032 - DOI - PMC - PubMed
    1. Dhingra A., Fina M. E., Neinstein A., Ramsey D. J., Xu Y., Fishman G. A., et al. (2011). Autoantibodies in melanoma-associated retinopathy target TRPM1 cation channels of retinal ON bipolar cells. J. Neurosci. official J. Soc. Neurosci. 31 (11), 3962–3967. 10.1523/JNEUROSCI.6007-10.2011 - DOI - PMC - PubMed

LinkOut - more resources