

Quantifying fetal heart health in gestational diabetes: a new approach with fetal heart quantification technology
- PMID: 38863981
- PMCID: PMC11165031
- DOI: 10.3389/fphar.2024.1394885
Quantifying fetal heart health in gestational diabetes: a new approach with fetal heart quantification technology
Abstract
Objective: This study aimed to assess the impact of gestational diabetes mellitus (GDM) on fetal heart structure and function using a technique called fetal heart quantification (Fetal HQ), with a focus on mitochondrial dynamics, which employs advanced imaging technology for comprehensive analysis.
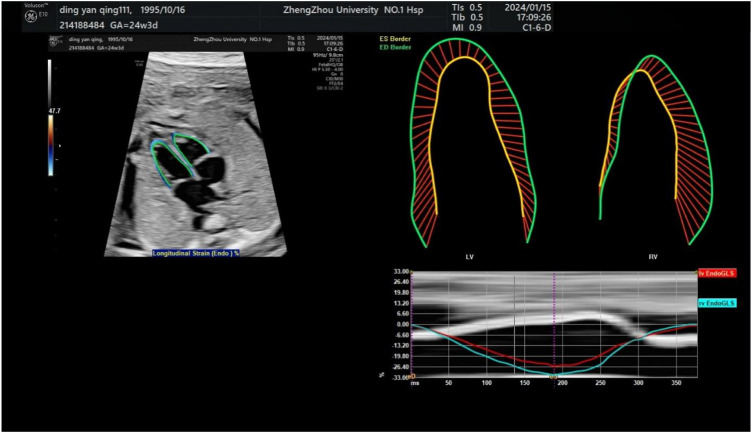
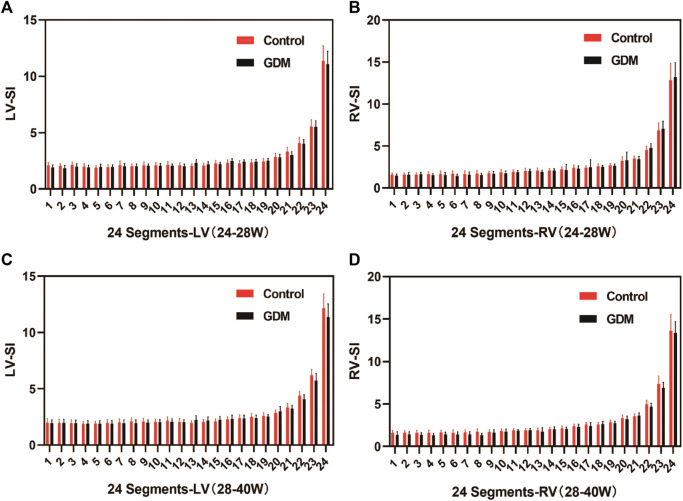
Methods: A total of 180 fetuses with normal heart structures, aged 24-40 weeks of gestation, were examined. A 2-3 s cine loop in the standard four-chamber oblique view was captured and analyzed using the speckle-tracking technique with Fetal HQ. Various echocardiographic parameters were evaluated, including four-chamber view (4CV), global spherical index (GSI), global longitudinal strain (GLS), 24-segment spherical index (SI), ventricular fractional area change (FAC), cardiac output (CO), and stroke volume (SV). These parameters were compared between the GDM group and the control group during two gestational periods: 24+0 to 28+0 weeks and 28+1 to 40+1 weeks. Statistical analysis was performed using independent samples t-tests and Mann-Whitney U tests to identify significant differences.
Results: Twenty fetuses from mothers with GDM and 40 from the control group were recruited at 24+0 to 28+0 weeks. At 28+1 to 40+1 weeks, 40 fetuses from mothers with GDM and 80 from the control group were recruited. The fetal left ventricular global longitudinal function was similar between the GDM and control groups. However, compared to the controls, right ventricular function in the GDM group was lower only at 28+1 to 40+1 weeks. In the GDM group, the global spherical index (GSI) was lower than in the control group at 28+1 to 40+1 weeks (1.175 vs. 1.22; p = 0.001). There were significant decreases in ventricular FAC (38.74% vs. 42.83%; p < 0.0001) and 4CV GLS for the right ventricle (-22.27% vs. -26.31%; p = 0.005) at 28+1 to 40+1 weeks.
Conclusion: Our findings suggest that GDM is associated with decreased right ventricular function in the fetal heart, particularly during the later stages of pregnancy (28+1 to 40+1 weeks), compared to fetuses from healthy pregnancies. The Fetal HQ technique represents a valuable tool for evaluating the structure and function of fetal hearts affected by GDM during the advanced stages of pregnancy.
Keywords: cardiac function; echocardiography; fetal cardiac morphology; fetal heart quantification; gestational diabetes mellitus (GDM).
Copyright © 2024 Zhang, Fu, Zhao, Wang, Wu, Liu, Cheng and Zhang.
Conflict of interest statement
The authors declare that the research was conducted in the absence of any commercial or financial relationships that could be construed as a potential conflict of interest.
Figures


Similar articles
-
Evaluation of prenatal changes in fetal cardiac morphology and function in maternal diabetes mellitus using a novel fetal speckle-tracking analysis: a prospective cohort study.Cardiovasc Ultrasound. 2021 Jun 30;19(1):25. doi: 10.1186/s12947-021-00256-z. Cardiovasc Ultrasound. 2021. PMID: 34193164 Free PMC article.
-
Impact of gestational diabetes mellitus on fetal cardiac morphology and function: cohort comparison of second- and third-trimester fetuses.Ultrasound Obstet Gynecol. 2021 Apr;57(4):607-613. doi: 10.1002/uog.22148. Epub 2021 Mar 13. Ultrasound Obstet Gynecol. 2021. PMID: 32691497
-
Assessing Coarctation of the Aorta With Fetal Heart Quantification Technology.Matern Fetal Med. 2024 Jul 3;6(3):147-155. doi: 10.1097/FM9.0000000000000231. eCollection 2024 Jul. Matern Fetal Med. 2024. PMID: 40406281 Free PMC article.
-
Effect of maternal diabetes on fetal heart function on echocardiography: systematic review and meta-analysis.Ultrasound Obstet Gynecol. 2021 Apr;57(4):539-550. doi: 10.1002/uog.22163. Ultrasound Obstet Gynecol. 2021. PMID: 32730637 Free PMC article.
-
A Review of the Impact of Gestational Diabetes on Fetal Brain Development: An Update on Neurosonographic Markers During the Last Decade.Life (Basel). 2025 Jan 31;15(2):210. doi: 10.3390/life15020210. Life (Basel). 2025. PMID: 40003619 Free PMC article. Review.
References
-
- Arslan D., Oran B., Vatansev H., Cimen D., Guvenc O. (2013). The usefulness of plasma asymmetric dimethylarginine (ADMA) levels and tissue Doppler echocardiography for heart function in term infants born to mothers with gestational diabetes mellitus. J. Matern. Fetal Neonatal Med. 26, 1742–1748. 10.3109/14767058.2013.798288 - DOI - PubMed
LinkOut - more resources
Full Text Sources
Miscellaneous