

Development and Validation of a Novel Prognostic Nomogram Based on Platelet and CD8+T Cell Counts in Hepatocellular Carcinoma Patients with Portal Vein Tumor Thrombosis
- PMID: 38863997
- PMCID: PMC11166160
- DOI: 10.2147/JHC.S452688
Development and Validation of a Novel Prognostic Nomogram Based on Platelet and CD8+T Cell Counts in Hepatocellular Carcinoma Patients with Portal Vein Tumor Thrombosis
Abstract
Purpose: Portal vein tumor thrombosis (PVTT) is one of the hallmarks of advanced Hepatocellular carcinoma (HCC). Platelet (PLT) function parameters and CD8+T cells (CD8+Ts) play an important role in HCC progression and metastasis. This study is committed to establishing an efficient prognosis prediction model and exploring the combined effect of PLT and CD8+Ts on PVTT prognosis.
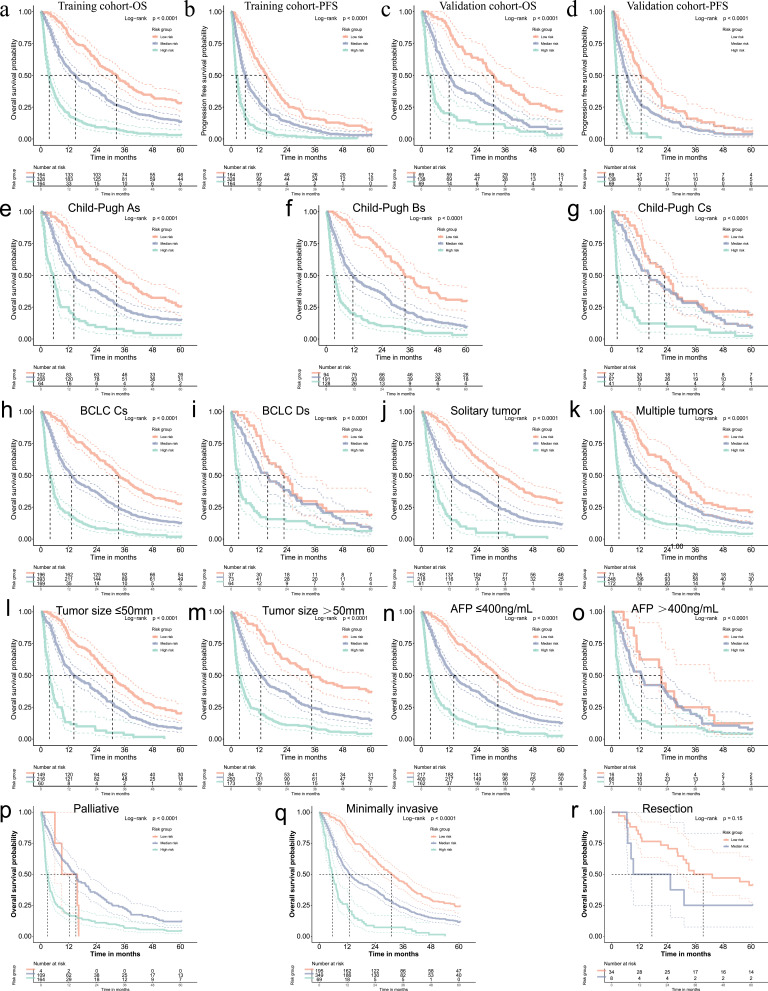
Patients and methods: This retrospective study collected 932 HCC patients with PVTT from 2007 to 2017 and randomly divided them into a training cohort (n = 656) and a validation cohort (n = 276). We performed multivariable Cox and Elastic-net regression analysis, constructed a nomogram and used Kaplan-Meier survival curves to compare overall survival and progression-free survival rates in different substrata. Relationships between indicators involved were also analyzed.
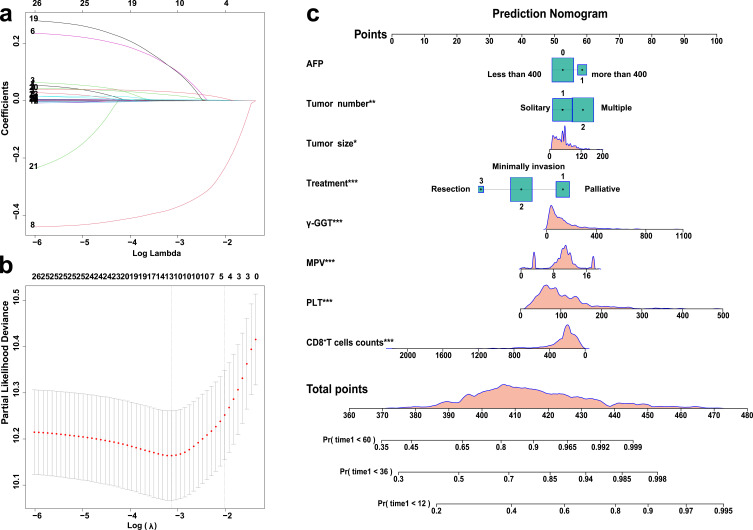
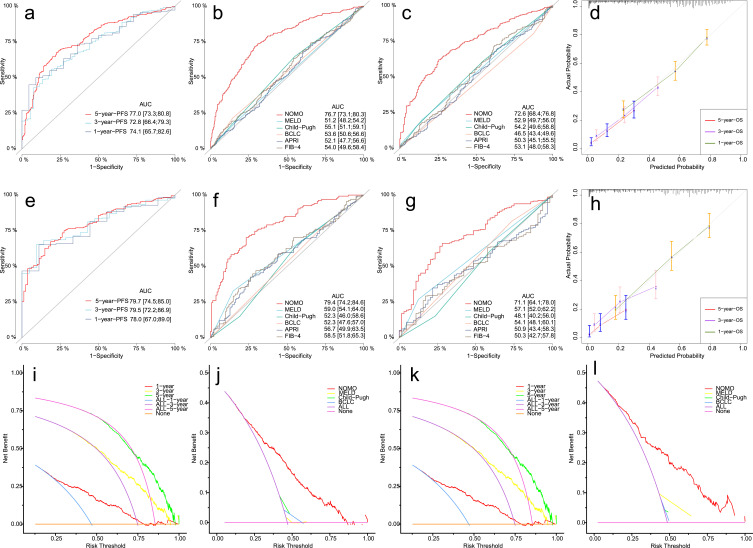
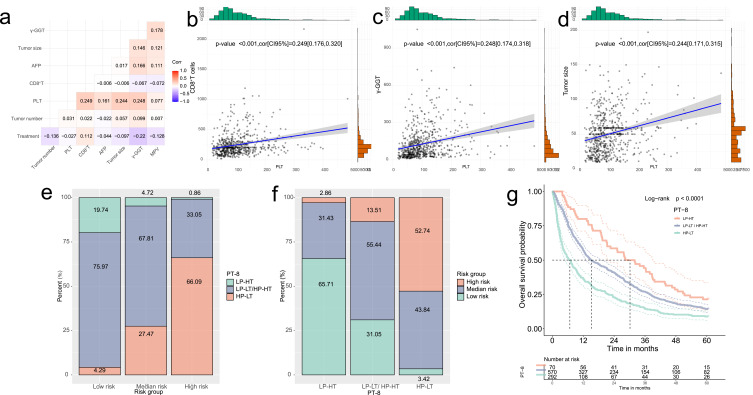
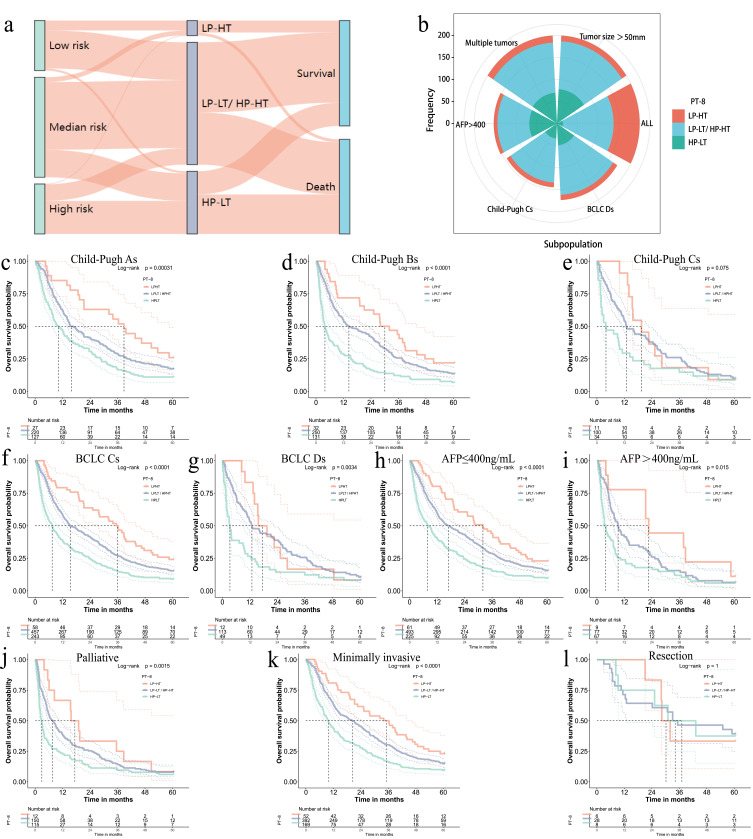
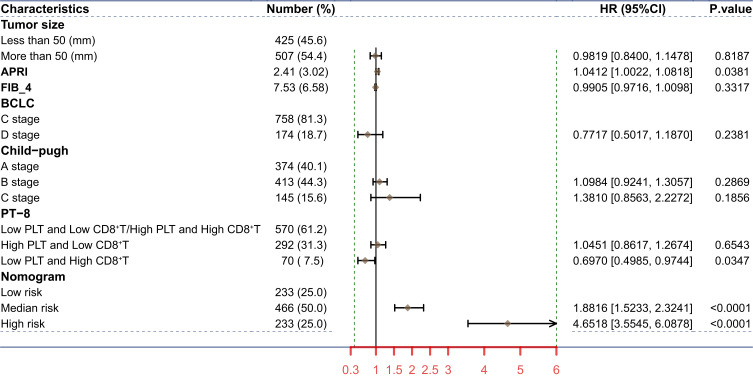
Results: We found tumor number, size, treatment, PLT, γ-glutamyl transferase, alpha-fetoprotein, mean platelet volume, and CD8+Ts were related to the 5-year OS of patients with PVTT, and established a nomogram. The area under the receiver operating characteristic curve (AUCs) for predicting the 1-year OS rates were 0.767 and 0.794 in training and validation cohorts. The calibration curve and decision curve indicated its predictive consistency and strong clinical utility. We also found those with low PLT (<100*10^9/L) and high CD8+Ts (>320 cells/μL) had a better prognosis.
Conclusion: We established a well-performing prognostic model for PVTT based on platelet functional parameters and CD8+Ts, and found that PT-8 formed by PLT and CD8+Ts was an excellent predictor of the prognosis of PVTT.
Keywords: CD8+T cells counts; correlation analysis; hepatocellular carcinoma; platelet; portal vein tumor thrombus; prognostic model.
© 2024 Shi et al.
Conflict of interest statement
The authors report no conflicts of interest in this work.
Figures
Similar articles
-
An Eastern Hepatobiliary Surgery Hospital/Portal Vein Tumor Thrombus Scoring System as an Aid to Decision Making on Hepatectomy for Hepatocellular Carcinoma Patients With Portal Vein Tumor Thrombus: A Multicenter Study.Hepatology. 2019 May;69(5):2076-2090. doi: 10.1002/hep.30490. Epub 2019 Mar 12. Hepatology. 2019. PMID: 30586158
-
Development of a Prognostic Nomogram in Hepatocellular Carcinoma with Portal Vein Tumor Thrombus Following Trans-Arterial Chemoembolization with Drug-Eluting Beads.Cancer Manag Res. 2021 Dec 24;13:9367-9377. doi: 10.2147/CMAR.S341672. eCollection 2021. Cancer Manag Res. 2021. PMID: 34992462 Free PMC article.
-
CT-based radiomics nomogram for prediction of survival after transarterial chemoembolization with drug-eluting beads in patients with hepatocellular carcinoma and portal vein tumor thrombus.Eur Radiol. 2023 Dec;33(12):8715-8726. doi: 10.1007/s00330-023-09830-7. Epub 2023 Jul 12. Eur Radiol. 2023. PMID: 37436507
-
Comparative efficacy and safety of multimodality treatment for advanced hepatocellular carcinoma with portal vein tumor thrombus: patient-level network meta-analysis.Front Oncol. 2024 Feb 16;14:1344798. doi: 10.3389/fonc.2024.1344798. eCollection 2024. Front Oncol. 2024. PMID: 38434681 Free PMC article.
-
Progress on the molecular mechanism of portal vein tumor thrombosis formation in hepatocellular carcinoma.Exp Cell Res. 2023 May 1;426(1):113563. doi: 10.1016/j.yexcr.2023.113563. Epub 2023 Mar 20. Exp Cell Res. 2023. PMID: 36944406 Review.
Cited by
-
Prognostic Significance of Elevated Platelet Count (>200 x 10^9 per L) in BCLC Stages B and C of Hepatocellular Carcinoma: A Retrospective Multicenter Analysis.J Hepatocell Carcinoma. 2025 May 5;12:855-864. doi: 10.2147/JHC.S511263. eCollection 2025. J Hepatocell Carcinoma. 2025. PMID: 40352960 Free PMC article.
-
Development and verification of a nomogram for predicting portal vein tumor thrombosis in hepatocellular carcinoma.Am J Transl Res. 2024 Dec 15;16(12):7511-7520. doi: 10.62347/PLQF5135. eCollection 2024. Am J Transl Res. 2024. PMID: 39822560 Free PMC article.
References
LinkOut - more resources
Full Text Sources
Research Materials
