Tutorial on methods for estimation of optical absorption and scattering properties of tissue
- PMID: 38864093
- PMCID: PMC11166171
- DOI: 10.1117/1.JBO.29.6.060801
Tutorial on methods for estimation of optical absorption and scattering properties of tissue
Abstract
Significance: The estimation of tissue optical properties using diffuse optics has found a range of applications in disease detection, therapy monitoring, and general health care. Biomarkers derived from the estimated optical absorption and scattering coefficients can reflect the underlying progression of many biological processes in tissues.
Aim: Complex light-tissue interactions make it challenging to disentangle the absorption and scattering coefficients, so dedicated measurement systems are required. We aim to help readers understand the measurement principles and practical considerations needed when choosing between different estimation methods based on diffuse optics.
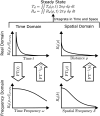
Approach: The estimation methods can be categorized as: steady state, time domain, time frequency domain (FD), spatial domain, and spatial FD. The experimental measurements are coupled with models of light-tissue interactions, which enable inverse solutions for the absorption and scattering coefficients from the measured tissue reflectance and/or transmittance.
Results: The estimation of tissue optical properties has been applied to characterize a variety of ex vivo and in vivo tissues, as well as tissue-mimicking phantoms. Choosing a specific estimation method for a certain application has to trade-off its advantages and limitations.
Conclusion: Optical absorption and scattering property estimation is an increasingly important and accessible approach for medical diagnosis and health monitoring.
Keywords: diffuse optics; optics; photonics; tissue optical properties; tissue optics.
© 2024 The Authors.
Figures


Similar articles
-
Development of traceable measurement of the diffuse optical properties of solid reference standards for biomedical optics at National Institute of Standards and Technology.Appl Opt. 2015 Jul 1;54(19):6118-27. doi: 10.1364/AO.54.006118. Appl Opt. 2015. PMID: 26193162
-
Machine learning approach for rapid and accurate estimation of optical properties using spatial frequency domain imaging.J Biomed Opt. 2018 Dec;24(7):1-6. doi: 10.1117/1.JBO.24.7.071606. J Biomed Opt. 2018. PMID: 30550050 Free PMC article.
-
Multi-frequency spatial frequency domain imaging: a depth-resolved optical scattering model to isolate scattering contrast in thin layers of skin.J Biomed Opt. 2024 Apr;29(4):046003. doi: 10.1117/1.JBO.29.4.046003. Epub 2024 Apr 22. J Biomed Opt. 2024. PMID: 38650893 Free PMC article.
-
Extraction of optical properties and prediction of light distribution in rat brain tissue.J Biomed Opt. 2014;19(7):75001. doi: 10.1117/1.JBO.19.7.075001. J Biomed Opt. 2014. PMID: 24996660
-
Applications of optical property measurement for quality evaluation of agri-food products: a review.Crit Rev Food Sci Nutr. 2024;64(33):12599-12619. doi: 10.1080/10408398.2023.2255260. Epub 2023 Sep 10. Crit Rev Food Sci Nutr. 2024. PMID: 37691446 Review.
Cited by
-
Anthropomorphic tissue-mimicking phantoms for oximetry validation in multispectral optical imaging.J Biomed Opt. 2025 Jul;30(7):076006. doi: 10.1117/1.JBO.30.7.076006. Epub 2025 Jul 17. J Biomed Opt. 2025. PMID: 40678081 Free PMC article.
-
Toward fluorescence digital twins: multi-parameter experimental validation of fluorescence Monte Carlo simulations using solid phantoms.J Biomed Opt. 2025 Dec;30(Suppl 3):S34104. doi: 10.1117/1.JBO.30.S3.S34104. Epub 2025 May 27. J Biomed Opt. 2025. PMID: 40443945 Free PMC article.
-
Frequency domain broadband short-wave infrared spectroscopy for measurement of tissue optical properties from 685 to 1300 nm.J Biomed Opt. 2025 Apr;30(4):045001. doi: 10.1117/1.JBO.30.4.045001. Epub 2025 Apr 25. J Biomed Opt. 2025. PMID: 40292022 Free PMC article.
-
Tutorial on phantoms for photoacoustic imaging applications.J Biomed Opt. 2024 Aug;29(8):080801. doi: 10.1117/1.JBO.29.8.080801. Epub 2024 Aug 14. J Biomed Opt. 2024. PMID: 39143981 Free PMC article. Review.
References
-
- Bigio I. J., Fantini S., Quantitative Biomedical Optics: Theory, Methods, and Applications, Cambridge Texts in Biomedical Engineering, Cambridge University Press, Cambridge: (2016).
-
- Tuchin V. V., Tissue Optics: Light Scattering Methods and Instruments for Medical Diagnosis, 3rd ed., SPIE Press, Bellingham, Washington, USA: (2015).
-
- Wang L. V., Wu H.-I., Biomedical Optics: Principles and Imaging, Wiley-Interscience, Hoboken, New Jersey: (2007).
-
- Welch A. J., Gemert M. J. C. V., Optical-thermal Response of Laser-irradiated Tissue, 2nd ed., Springer, Dordrecht: (2011).

