

Alcohol Intake and Risk of Hypertension: A Systematic Review and Dose-Response Meta-Analysis of Nonexperimental Cohort Studies
- PMID: 38864208
- PMCID: PMC11251509
- DOI: 10.1161/HYPERTENSIONAHA.124.22703
Alcohol Intake and Risk of Hypertension: A Systematic Review and Dose-Response Meta-Analysis of Nonexperimental Cohort Studies
Abstract
Background: Alcohol consumption has been associated with higher blood pressure and an increased risk of hypertension. However, the possible exposure thresholds and effect-modifiers are uncertain.
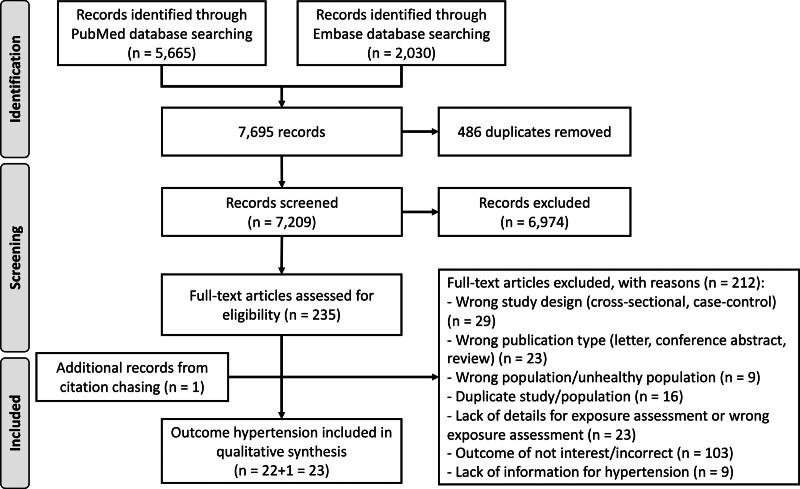
Methods: We assessed the dose-response relationship between usual alcohol intake and hypertension incidence in nonexperimental cohort studies. After performing a systematic literature search through February 20, 2024, we retrieved 23 eligible studies. We computed risk ratios and 95% CI of hypertension incidence using a nonlinear meta-analytic model based on restricted cubic splines, to assess the dose-response association with alcohol consumption.
Results: We observed a positive and almost linear association between alcohol intake and hypertension risk with risk ratios of 0.89 (0.84-0.94), 1.11 (1.07-1.15), 1.22 (1.14-1.30), and 1.33 (1.18-1.49) for 0, 24, 36 and 48 g/d, respectively, using 12 g alcohol/d as the reference value. In sex-specific analyses, the association was almost linear in men over the entire range of exposure but only observed above 12 g/d in women, although with a steeper association at high levels of consumption compared with men. The increased risk of hypertension above 12 to 24 g alcohol/d was similar in Western and Asian populations and considerably greater in White than in Black populations, mainly due to the positive association in women at moderate-to-high intake.
Conclusions: Overall, our results lend support to a causal association between alcohol consumption and risk of hypertension, especially above an alcohol intake of 12 g/d, and are consistent with recommendations to avoid or limit alcohol intake. Sex and ethnicity appear to be major effect-modifiers of such association.
Keywords: alcohol intake; cardiovascular disease; hypertension; prevention; public health.
Conflict of interest statement
None.
Figures


References
-
- World Health Organization. Alcohol. 2023. Accessed February 24, 2024. https://www.who.int/health-topics/alcohol#tab=tab_1
-
- Kalinowski A, Humphreys K. Governmental standard drink definitions and low-risk alcohol consumption guidelines in 37 countries. Addiction. 2016;111:1293–1298. doi: 10.1111/add.13341 - PubMed
-
- Mongan D, Long J. Standard drink measures in Europe Peoples’ understanding of standard drinks and their use in drinking guidelines, alcohol surveys and labelling. 2015. Accessed February 24, 2024. https://www.rarha.eu/Resources/Deliverables/Lists/Deliverables/Attachmen...
-
- Lucas DL, Brown RA, Wassef M, Giles TD. Alcohol and the cardiovascular system: research challenges and opportunities. J Am Coll Cardiol. 2005;45:1916–1924. doi: 10.1016/j.jacc.2005.02.075 - PubMed
Publication types
MeSH terms
Grants and funding
LinkOut - more resources
Full Text Sources
Medical
