. 2024 Jun;14(6):240063.
doi: 10.1098/rsob.240063. Epub 2024 Jun 12.

Decoding frontotemporal and cell-type-specific vulnerabilities to neuropsychiatric disorders and psychoactive drugs

Affiliations

Decoding frontotemporal and cell-type-specific vulnerabilities to neuropsychiatric disorders and psychoactive drugs

Jiatong Ji et al. Open Biol. 2024 Jun.

Abstract

Frontotemporal lobe abnormalities are linked to neuropsychiatric disorders and cognition, but the role of cellular heterogeneity between temporal lobe (TL) and frontal lobe (FL) in the vulnerability to genetic risk factors remains to be elucidated. We integrated single-nucleus transcriptome analysis in 'fresh' human FL and TL with genetic susceptibility, gene dysregulation in neuropsychiatric disease and psychoactive drug response data. We show how intrinsic differences between TL and FL contribute to the vulnerability of specific cell types to both genetic risk factors and psychoactive drugs. Neuronal populations, specifically PVALB neurons, were most highly vulnerable to genetic risk factors for psychiatric disease. These psychiatric disease-associated genes were mostly upregulated in the TL, and dysregulated in the brain of patients with obsessive-compulsive disorder, bipolar disorder and schizophrenia. Among these genes, GRIN2A and SLC12A5, implicated in schizophrenia and bipolar disorder, were significantly upregulated in TL PVALB neurons and in psychiatric disease patients' brain. PVALB neurons from the TL were twofold more vulnerable to psychoactive drugs than to genetic risk factors, showing the influence and specificity of frontotemporal lobe differences on cell vulnerabilities. These studies provide a cell type resolved map of the impact of brain regional differences on cell type vulnerabilities in neuropsychiatric disorders.

Keywords: frontal lobe; psychiatric disorder; psychoactive drugs; single-cell RNA sequencing; temporal lobe.


Conflict of interest statement

We declare we have no competing interests.

Figures
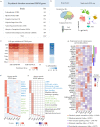
GWAS-associated genes for neuropsychiatric disorders are enriched for neuronal expression in the TL
Figure 1.
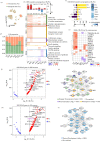
GWAS-associated genes for neuropsychiatric disorders are enriched for neuronal expression in the TL. (a) UMAP plot showing how the two regions overlap after batch correction (see §2). (b) Bar plot showing the cell type proportions in TL and FL samples. Asterisks mark significantly different proportions by chi-squared test (p < 0.05). (c) Number of DEGs (absolute log2FC > 0.5 and FDR < 0.05) between FL and TL, split by upregulated in TL and FL, respectively. For each cell type, the proportion (%) of DEGs to the total number of expressed genes is indicated (top). Hierarchical clustering of log-FC of DEGs between FL and TL identified in each cell type, which are grouped into six clusters according to the KEGG pathways annotation (BH-adjusted p < 0.05) (bottom). (d) Number of GWAS genes that are DE between FL and TL, split into upregulated in TL (yellow) and in FL (purple), respectively. Numbers represent the ratio (%) of the upregulated DE GWAS genes in each region over the total DE GWAS genes (left). Proportion of all DE GWAS genes over the total number of DEGs in each cell type, and the significance of enrichment in each cell type by hypergeometric test (right). *BH-adjusted p < 0.05. (e) Heatmap showing the log2FC (TL/FL) of DEGs (absolute log2FC > 0.5 and FDR < 0.05) between FL and TL among 38 GWAS genes (detected in seven neuropsychiatric diseases). (f,h) Volcano plots displaying GWAS gene expression in EX (h) and INH (f) neurons, respectively. Genes with log2FC > 1 and GWAS p < 10−8 are highlighted. Genes with colour highlight belong to the 38 common genes detected in seven disorders. (g,i) Gene networks describing the interaction of genes which are highlighted in the corresponding volcano plots. Edges represent gene–gene co-expression in the specific cell type. Each node (gene) in the network is coloured according to the significant GO functional enrichment (BH-adjusted p < 0.05).
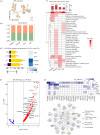
GWAS-associated genes for neuropsychiatric disorders are enriched for neuronal expression
Figure 2.
GWAS-associated genes for neuropsychiatric disorders are enriched for neuronal expression. (a) Number of GWAS genes for neuropsychiatric disorders extracted from NHGRI-EBI GWAS catalogue. (b) Schematic diagram displaying the TL and FL brain neocortex (left). UMAP plot showing all main cell types identified in the snRNA-seq analysis: astrocyte (Astro) oligodendrocyte (Olig), microglia cells (Micro), endothelial cells (Endo), oligodendrocyte progenitor cells (OPC), EX and INH (right). More details are found in electronic supplementary material, figure S1. (c) Cell type enrichment score for expression of neuropsychiatric-associated GWAS genes grouped by disease (left). Proportion of GWAS genes within marker genes of each type with significance (BH-adjusted p-value) of the hypergeometric test labelled by asterisks (right): Significance (p-value) thresholds: *0.01−0.05, **0.001−0.01, ***0.0001−0.001, ****<0.0001. (d) Heatmap showing the specific marker genes that are also GWAS-associated genes in EX (green) and INH (blue), respectively. (e) Gene set enrichment analysis (GSEA) of cell type-specific differential expression in EX and INH (BH-adjusted p < 0.05). Pathways in green and in blue are contributed by GWAS genes in EX and INH, respectively. (f) Average (normalized) expression level of 38 genes (detected in seven neuropsychiatric diseases) in each cell type; the significant (non-redundant) Gene Ontology (GO) biological processes (BH-adjusted p < 0.05) for these 38 genes are also indicated by different colours (vertical bars) and annotated at the bottom.
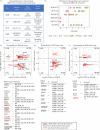
Genes expressed in PVALB neurons from the TL are also dysregulated in neuropsychiatric diseased brain tissue
Figure 3.
Genes expressed in PVALB neurons from the TL are also dysregulated in neuropsychiatric diseased brain tissue. (a) Details about the DEGs (absolute log2FC > 0.25, FDR < 0.05) identified in the brain of neuropsychiatric disease patients (see §2 for details). (b) Bubble plot showing the enrichment of DEGs (absolute log2FC > 0.5, FDR < 0.05) between TL and FL (for each neuron subtypes) in the set of DEGs detected in the brain of neuropsychiatric disease patients. Numbers in brackets are number of DEGs (diseased brain versus control brain). Dotted vertical line indicates the threshold for statistical significance of enrichment (BH-adjusted p = 0.05). (c–e) Scatter dot plots showing the relationship between log2FC (TL/FL) of PVALB-expressed genes (x-axis) and log2FC (diseased/control brain) (y-axis) for the set of genes significantly overlapping genes. Three scatter plots for BP (c), OCD (d) and SCHI (e). For each disease, the genes highlighted in each panel are GWAS-associated genes with GWAS p ≤ 10−5, and the numbers in each quadrant are the proportion of genes over the total number of DEGs in T/FL and in diseased/control brain. Each Scatter dot plots is accompanied by a table showing the associated neuropsychiatric disease for each gene by GWAS: SCHI, BP, CI, UD, ASD, OCD and ADHD. Bold red font, GWAS-associated genes that are also psychoactive drugs targets; underlined genes are DEGs between FL and TL in the Allen Brain Atlas dataset (BH-adjusted p < 0.05). GWAS-association p-values: *10−8–10−5; **10−10–10−8; ***<10−10.
GWAS-associated genes for neuropsychiatric disorders are specifically enriched for PVALB expression in the TL
Figure 4.
GWAS-associated genes for neuropsychiatric disorders are specifically enriched for PVALB expression in the TL. (a) UMAP plot showing the FL and TL distribution to INH neurons. (b) Cell proportion of FL and TL in each subcluster. (c) Number of DEGs between FL and TL (absolute log2FC > 0.5 and FDR < 0.05) split by genes upregulated in FL and TL, respectively. The proportion (%) of DEGs over the total number of expressed genes is indicated for each subcluster (top). Heatmap exhibit the KEGG pathways enriched by DEGs between FL and TL (BH-adjusted p < 0.05). (d) Number of GWAS genes that are DE between FL and TL, split by upregulated in TL (yellow) and FL (purple), respectively. Numbers represent the proportion (%) of the upregulated DE GWAS genes in each region over the total number DE GWAS genes (left). Proportion (%) of all DE GWAS genes over the total of DEGs in each cell type; significant enrichment (by hypergeometric test) is indicated (right). *BH-adjusted p < 0.05. (e) Volcano plot showing log2FC (TL/FL) for the GWAS-associated genes in PVALB cluster. Subset of 28 GWAS genes with log2FC > 1 and GWAS p < 10−8 are highlighted in the graph. (f) Heatmap showing the GWAS p-values for the 28 genes in each disease (top). Gene network describing the interaction of the 28 GWAS genes. Edges represent gene–gene co-expression in PVALB neurons. Each node (gene) in the network is coloured according to the significant GO functional enrichment (BH-adjusted p < 0.05).
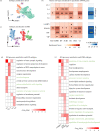
Specific neuronal subtypes show enrichment for GWAS-associated genes for neuropsychiatric disorders
Figure 5.
Specific neuronal subtypes show enrichment for GWAS-associated genes for neuropsychiatric disorders. (a,b) UMAP plot showing the subtypes of EX (a) and INH (b) neurons. EX neurons are classified into L2–3, L4, L5 and L6. INH neurons are classified into LAMP5, PVALB, SST and VIP. (c). Cell type enrichment score for expression of neuropsychiatric disorder associated GWAS genes. Proportion (%) of GWAS genes within marker genes of each cell subtype alongside significance of enrichment (adjusted p-value) by hypergeometric test (right). Significance (p-value) thresholds: *0.01–0.05, **0.001–0.01, ***0.0001–0.001, ****<0.0001. (d,e). Enriched GO biological processes (BH-adjusted p < 0.05) in each subtype of EX (d) and INH (e) neurons. Pathways highlighted in green match the pathways identified in GWAS genes (reported in electronic supplementary materials, figure S1 and table S2).
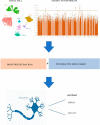
Schematic illustrating the research process for identifying the cell-type vulnerabilities of psychiatric disease and psychoactive drugs
Figure 6.
Schematic illustrating the research process for identifying the cell-type vulnerabilities of psychiatric disease and psychoactive drugs.

Similar articles

Cited by

References

    1. Collins AL, Sullivan PF. 2013. Genome-wide association studies in psychiatry: what have we learned? Br. J. Psychiatry 202, 1–4. (10.1192/bjp.bp.112.117002) - DOI - PMC - PubMed
    1. Cannon TD. 2016. Deciphering the genetic complexity of schizophrenia. JAMA Psychiatry 73, 5–6. (10.1001/jamapsychiatry.2015.2111) - DOI - PubMed
    1. Neuner SM, Heuer SE, Huentelman MJ, O’Connell KMS, Kaczorowski CC. 2019. Harnessing genetic complexity to enhance translatability of Alzheimer’s disease mouse models: a path toward precision medicine. Neuron 101, 399–411. (10.1016/j.neuron.2018.11.040) - DOI - PMC - PubMed
    1. Couwenbergh C, van den Brink W, Zwart K, Vreugdenhil C, van Wijngaarden-Cremers P, van der Gaag RJ. 2006. Comorbid psychopathology in adolescents and young adults treated for substance use disorderss: a review. Eur. Child Adolesc. Psychiatry 15, 319–328. (10.1007/s00787-006-0535-6) - DOI - PubMed
    1. Sullivan PF. 2012. Puzzling over schizophrenia: schizophrenia as a pathway disease. Nat. Med. 18, 210–211. (10.1038/nm.2670) - DOI - PMC - PubMed

MeSH terms

Substances

LinkOut - more resources