. 2024 Sep;72(9):1707-1724.
doi: 10.1002/glia.24579. Epub 2024 Jun 12.

Astrocytic PAR1 and mGluR2/3 control synaptic glutamate time course at hippocampal CA1 synapses

Affiliations

Astrocytic PAR1 and mGluR2/3 control synaptic glutamate time course at hippocampal CA1 synapses

Woo Suk Roh et al. Glia. 2024 Sep.

Abstract

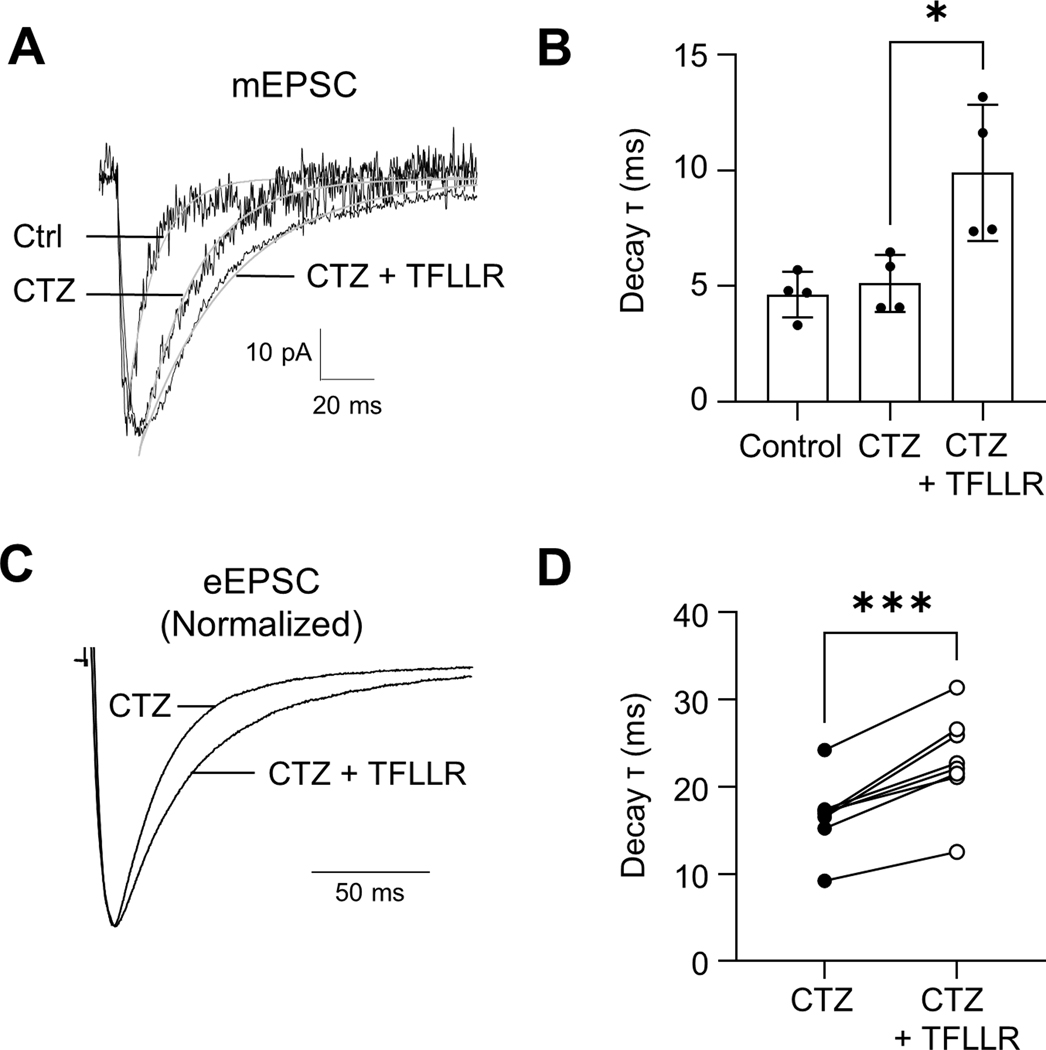
Astrocytes play an essential role in regulating synaptic transmission. This study describes a novel form of modulation of excitatory synaptic transmission in the mouse hippocampus by astrocytic G-protein-coupled receptors (GPCRs). We have previously described astrocytic glutamate release via protease-activated receptor-1 (PAR1) activation, although the regulatory mechanisms for this are complex. Through electrophysiological analysis and modeling, we discovered that PAR1 activation consistently increases the concentration and duration of glutamate in the synaptic cleft. This effect was not due to changes in the presynaptic glutamate release or alteration in glutamate transporter expression. However, blocking group II metabotropic glutamate receptors (mGluR2/3) abolished PAR1-mediated regulation of synaptic glutamate concentration, suggesting a role for this GPCR in mediating the effects of PAR1 activation on glutamate release. Furthermore, activation of mGluR2/3 causes glutamate release through the TREK-1 channel in hippocampal astrocytes. These data show that astrocytic GPCRs engage in a novel regulatory mechanism to shape the time course of synaptically-released glutamate in excitatory synapses of the hippocampus.

Keywords: PAR1; astrocyte; electrophysiology; glutamate; mGluR2/3.


Conflict of interest statement

Conflict of interest

S.F.T. is a member of the SAB for Eumentis Therapeutics, Sage Therapeutics, and Combined Brain, is a member of the Medical Advisory Board for the GRIN2B Foundation and the CureGRIN Foundation, is an advisor to GRIN Therapeutics and Neurocrine, is co-founder of NeurOp Inc. and Agrithera Inc., and is a member of the Board of Directors of NeurOp Inc.

Figures

Figure 1:
Figure 1:. PAR1 activation increases the decay τ of mEPSC and eEPSC in the presence of CTZ
A. Representative traces showing the effect of CTZ (100 μM) or CTZ+TFLLR (30 μM) on mEPSCs recorded from hippocampal CA1 neurons at −70 mV holding potential. B. Summary bar graph of the decay τ of mEPSCs by CTZ and CTZ+TFLLR application (n=4, * p=0.0428, paired t-test). C. Representative traces showing eEPSC, normalized with amplitude, recorded from the CA1 neurons in the presence of CTZ (100 μM) or CTZ+TFLLR. D. Summary of the decay τ of the eEPSC by CTZ or CTZ+TFLLR (n=8, *** p<0.001, paired t-test).
Figure 2:
Figure 2:. Kynurenate-mediated inhibition of eEPSC is reduced by PAR1 activation.
A. Schematic of eEPSC recorded in the hippocampus. The Schaffer-collateral pathway was electrically stimulated and CA1 pyramidal cells were recorded under a whole-cell voltage clamp. B. eEPSCs were recorded in the absence (black) and presence (gray) of 300 μM kynurenate (KYN) with the application of TFLLR (right) compared to the control (left). C. Summary of KYN-mediated inhibition with TFLLR (white circle) compared to the control (black circle) (n=7; ** p = 0.0024, paired t-test). D.E. The inhibition of eEPSC by 300 μM (D, gray line) and 800 μM KYN (E, gray line) in the presence of CTZ. A comparison between the control (left) and TFLLR (right). F. Normalized inhibition of peak amplitude of eEPSC by respective KYN concentration in the absence (black circle) and presence (white circle) of TFLLR (KYN 300 μM, n=6, *** p < 0.001, unpaired t-test; KYN 800 μM, n=6, ** p = 0.0053, unpaired t-test).
Figure 3:
Figure 3:. Unaltered paired-pulse ratio in response to TFLLR or LY341495 Treatment
A. Representative traces of 50 ms interval paired-pulse ratio without KYN (black line) or with KYN (gray line). B. Summary bar graph of paired-pulse ratio (PPR) determined in the indicated conditions for KYN (300 μM) in the absence and presence of TFLLR (30 μM). C. Representative traces of paired-pulse ratio in the presence of LY341495 without KYN (black line) or with KYN (gray line). D. Summary bar graph of paired-pulse ratio (PPR) with 1 μM LY341495 in the indicated conditions. E. Raw traces of mEPSCs with control and LY379268 application. F. Summary bar graph of mEPSCs frequency (left) and amplitude (right) with 1 μM LY379268 application compared to the control (n=11, ns p=0.1162 (left), 0.3171 (right) paired t-test). G. Representative traces showing the effect of CTZ (100 μM) or CTZ+LY379268 (1 μM) on mEPSCs. H. Summary bar graph of mEPSCs decay with control, CTZ, and CTZ+LY379268 application (n=7, ** p=0.0089, paired t-test).
Figure 4:
Figure 4:. mGluR2/3 antagonist abolished TFLLR-mediated reduction of kynurenate sensitivity on eEPSC.
A. Representative trace of normalized eEPSC with the application of LY379268 (1 μM) in the presence of CTZ. B. Summary of the decay τ of eEPSC by CTZ or with CTZ+LY379268. (n=5; ** p=0.0175, paired t-test). C. Summary bar graph of KYN inhibition with (black circle) and without (white circle) TFLLR (n=8–10; * p = 0.0243, unpaired t-test). D. Representative traces of eEPSC recorded in the presence of LY341495 (1 μM); 300 μM KYN (gray line)-mediated inhibition of eEPSC in the absence (left) and presence (right) of TFLLR. E. Summary bar graph of KYN inhibition with (black circle) and without (white circle) TFLLR in the presence of LY341495 (n=8–10; ns p = 0.6231, unpaired t-test). F. eeEPSC recorded in the presence of LY341495 and CTZ; KYN (gray line)-mediated inhibition of eEPSC in the absence (left) and presence (right) of TFLLR. G. Summary bar graph of KYN inhibition with (black circle) and without (white circle) TFLLR in the presence of LY341495 + CTZ (n=7–8; ns p = 0.3099, unpaired t-test). H. eEPSC recorded in the presence of TFLLR and CTZ; KYN (gray line)-mediated inhibition of eEPSC in scrambled shRNA condition (left) and mGluR3 Knockdown condition (right). I. Summary bar graph of KYN inhibition in scrambled shRNA (black circle) and mGluR3 shRNA (white circle) in the presence of TFLLR (n=4–5; * p = 0.0278, unpaired t-test).
Figure 5:
Figure 5:. mGluR2/3 agonist induces glutamate release in the cultured hippocampal astrocytes without affecting the calcium response.
A. Schematic of glutamate imaging by glutamate sensor iGluSnFR. B,C. Representative traces of glutamate imaging from astrocytes expressed with glutamate sensor iGluSnFR. Arrowheads indicate the pressure application of LY379268 (A, 20 μM) and TFLLR (B, 500 μM). D. Representative traces of Ca2+ responses from astrocytes loaded with Ca2+ indicator Fura-2-am by the bath application of LY379268 (black line). E. Summary bar graph of the normalized peak amplitude of fast and slow glutamate releases by LY379268 application in control (white) and mGluR3 overexpression (gray) (n=8–12; ** p=0.0093, unpaired t-test). F. Summary bar graph of the normalized peak amplitude of fast and slow glutamate releases by TFLLR application in control (white) and mGluR3 overexpression (gray) (n=6–11; * p=0.0485, unpaired t-test). G. Comparison of the normalized peak amplitude of glutamate release from scrambled (SC) and TREK-1 knockdown (KD) astrocytes (n=8–12; *** p<0.001, unpaired t-test). H. Representative image of iGluSnFR expression in the hippocampal brain slice ((SP) stratum pyramidale; (SR) stratum radiatum; (SLM) stratum lacunosum moleculare; (DG) dentate gyrus). I. Average time course of glutamate imaging from hippocampal astrocytes in brain slices. The gray area represents standard errors of the mean (n=19). J. Summary bar graph of the normalized peak amplitude of the glutamate release after LY379268 application.
Figure 6:
Figure 6:. Kinetic model of non-desensitizing AMPA receptor activation and inhibition by KYN.
A. Representative fast concentration jumps from an excised outside-out patch from acutely dissociated CA1 neurons. The normalized average response to 2 mM glutamate (2G), 100 μM glutamate (0.1G), and 100 μM glutamate in the presence of 300 μM KYN (0.1GK) were used for least squares fitting to the model presented in B. KYN was included in control solutions to mimic AMPA receptors pre-equilibrated with KYN during eEPSC responses. (Inset) The least-square fit to the expanded rising phase of AMPA currents is shown. B. Kinetic model of AMPA receptor activation in the presence of CTZ and its block by KYN (adapted from Diamond and Jahr, 1997). The fitted rates averaged from 5 patches were ka=7.71×10⁵ M−1s−1, k -a=6120 s−1, kb=4.74×10⁷ M−1s−1, k -b=1.47×10⁴ s−1, α=1.57×10⁴ s−1, β=396 s-1. C. Analysis of 1/τ decay and linear regression fitting of 1/risetime is shown (n=2–5). The decay was independent of agonist concentration (1/τ decay = 0.07–0.12 ms−1), whereas the rise time was dependent on agonist concentration. D. Concentration-response curve of KYN in Xenopus oocytes co-expressing GluA1 and GluA2 subunits activated by 30 μM or 100 μM glutamate in the presence of 100 μM CTZ. The kinetic model (square, black line) for non-desensitizing AMPA receptor inhibition by KYN was able to accurately predict the concentration-response curve of KYN inhibition of responses to 30 μM glutamate.
Figure 7:
Figure 7:. PAR1 activation increases the concentration and duration of glutamate in the Schaffer collateral-CA1 synapse.
A.B. Averaged eEPSC waveforms (black) from 3 cells in the presence of 100 μM CTZ (A) and CTZ+TFLLR (B) with or without 800 μM kynurenate. The red line shows the best fit of the eEPSC time course recorded from neurons by the simulated eEPSC time course in response to the dual exponential glutamate time course in the synaptic cleft. C. The time course of predicted glutamate concentration that best reproduced the measured eEPSC waveform in control and the presence of TFLLR (blue trace). D. Normalized glutamate waveforms in control and the presence of TFLLR (blue trace).
Figure 8:
Figure 8:. The effect of TFLLR and glutamate transporter inhibitors on eEPSCs.
A.B. Representative eEPSCs recorded in the presence of CTZ. Glutamate transporter inhibitors TBOA (A, 100 μM) or DHK (B, 300 μM) were applied to the slices followed by TBOA + TFLLR or DHK + TFLLR. C. Summary bar graph of increased decay τ of non-desensitizing eEPSC by TBOA or DHK (TBOA p>0.8, DHK p>0.5, paired t-test, n=3–5). D. Summary bar graph of the percentage of biotinylated GLT-1, GLAST, or EAAC1 (n=3). E. Western blot analysis of biotinylated GLT-1, GLAST, or EAAC1 (n=3).
Figure 9.
Figure 9.. Schematic of astrocytic glutamate release by the activation of PAR1 and mGluR2/3.
Schematic showing how astrocytes release glutamate through GPCR signaling in the tripartite synapse. PAR1-mediated Gq signaling pathway increases Ca2+ and releases slow glutamate through Best1 channels. PAR1-mediated Gi pathway signaling dissociates G-protein into Gα and Gβγ subunits and Gβγ directly interacts with the TREK-1 channel to release fast glutamate (Woo et al., 2012). Released glutamate from astrocytes and spillover of glutamate from neurons activates mGluR2/3 in the astrocytes. Activation of astrocytic mGluR2/3 releases TREK1-mediated fast glutamate in the microdomain. Synaptic glutamate increases further by astrocytic glutamate release.

References

    1. Adams MN, Ramachandran R, Yau MK, Suen JY, Fairlie DP, Hollenberg MD, & Hooper JD. (2011). Structure, function and pathophysiology of protease activated receptors. Pharmacol Ther, 130(3), 248–282. doi: 10.1016/j.pharmthera.2011.01.003 - DOI - PubMed
    1. Agulhon C, Fiacco TA, & McCarthy KD. (2010). Hippocampal short- and long-term plasticity are not modulated by astrocyte Ca2+ signaling. Science, 327(5970), 1250–1254. doi: 10.1126/science.1184821 - DOI - PubMed
    1. Almonte AG, Hamill CE, Chhatwal JP, Wingo TS, Barber JA, Lyuboslavsky PN, … Traynelis SF. (2007). Learning and memory deficits in mice lacking protease activated receptor-1. Neurobiol Learn Mem, 88(3), 295–304. doi: 10.1016/j.nlm.2007.04.004 - DOI - PMC - PubMed
    1. Aronica E, Gorter JA, Ijlst-Keizers H, Rozemuller AJ, Yankaya B, Leenstra S, & Troost D. (2003). Expression and functional role of mGluR3 and mGluR5 in human astrocytes and glioma cells: opposite regulation of glutamate transporter proteins. Eur J Neurosci, 17(10), 2106–2118. doi: 10.1046/j.1460-9568.2003.02657.x - DOI - PubMed
    1. Aronica E, van Vliet EA, Mayboroda OA, Troost D, da Silva FH, & Gorter JA. (2000). Upregulation of metabotropic glutamate receptor subtype mGluR3 and mGluR5 in reactive astrocytes in a rat model of mesial temporal lobe epilepsy. Eur J Neurosci, 12(7), 2333–2344. doi: 10.1046/j.1460-9568.2000.00131.x - DOI - PubMed

Publication types

MeSH terms

Substances

LinkOut - more resources