. 2024 Aug;11(30):e2401590.
doi: 10.1002/advs.202401590. Epub 2024 Jun 12.

Identification and Characterization of Metastasis-Initiating Cells in ESCC in a Multi-Timepoint Pulmonary Metastasis Mouse Model

Affiliations

Identification and Characterization of Metastasis-Initiating Cells in ESCC in a Multi-Timepoint Pulmonary Metastasis Mouse Model

Ching Ngar Wong et al. Adv Sci (Weinh). 2024 Aug.

Abstract

Metastasis is the biggest obstacle to esophageal squamous cell carcinoma (ESCC) treatment. Single-cell RNA sequencing analyses are applied to investigate lung metastatic ESCC cells isolated from pulmonary metastasis mouse model at multiple timepoints to characterize early metastatic microenvironment. A small population of parental KYSE30 cell line (Cluster S) resembling metastasis-initiating cells (MICs) is identified because they survive and colonize at lung metastatic sites. Differential expression profile comparisons between Cluster S and other subpopulations identified a panel of 7 metastasis-initiating signature genes (MIS), including CD44 and TACSTD2, to represent MICs in ESCC. Functional studies demonstrated MICs (CD44high) exhibited significantly enhanced cell survival (resistances to oxidative stress and apoptosis), migration, invasion, stemness, and in vivo lung metastasis capabilities, while bioinformatics analyses revealed enhanced organ development, stress responses, and neuron development, potentially remodel early metastasis microenvironment. Meanwhile, early metastasizing cells demonstrate quasi-epithelial-mesenchymal phenotype to support both invasion and anchorage. Multiplex immunohistochemistry (mIHC) staining of 4 MISs (CD44, S100A14, RHOD, and TACSTD2) in ESCC clinical samples demonstrated differential MIS expression scores (dMISs) predict lymph node metastasis, overall survival, and risk of carcinothrombosis.

Keywords: early cancer metastasis; early metastasis microenvironment; esophageal squamous cell carcinoma; metastasis biomarkers; metastasis‐initiating cells; multiplex staining; single‐cell transcriptome sequencing.


Conflict of interest statement

The authors declare no conflict of interest.

Figures
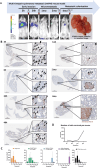
Figure 1
Figure 1
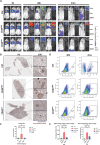
Multi‐timepoint pulmonary metastasis (mtPM) ESCC mouse model establishment. A) Representative in vivo bioluminescence images of mtPM mouse model (at 2 h, 24 h, 1 mo, 2 mo, and 4 mo) and resected mice lung. Mice were intravenously inoculated with KYSE30‐Luc‐GFP ESCC cells. Bioluminescence scaled from 7.83e4 to 1.85e6 radiance (p/sec/cm2/sr). Yellow dashed circles indicated metastasized tumor nodules in lungs. Red arrows indicated collection timepoints for single‐cell RNA sequencing. B) Representative immunohistochemistry (IHC) staining of metastasized tumor cells in formalin‐fixed and paraffin‐embedded (FFPE) mice lungs post‐intravenous inoculation at 2 h (n = 3), 6h (n = 3), 24 h (n = 4), 48 h (n = 4), 1wk (n = 3), 2 mo (n = 4), and 4 mo (n = 4). Human pan‐Cytokeratin stained brown. Black arrows and dashed circles indicated tumor cells. Left panel: Whole lung (scale bar = 2 mm). Right small panels: Zoomed‐in sections (scale bar = 50 µm). C) Bar charts showing number of colony counts per 20 mm square of mice lung tissue section. Four colony sizes were determined at cross‐sectional plane. Bar charts from left to right represents single cell, small colony (2‐10 cells), medium colony (11‐200 cells), visible metastatic nodule (>200 cells), and total colony count. D) Line graph showing number of tumor cells survived per mice. Flow cytometry analysis of GFP positive living tumor cells from each freshly dissociated mice lungs collected from four timepoints, including 6 h, 48 h, 2 mo, and 4 mo.
Figure 2
Figure 2
Single‐cell RNA sequencing (scRNA‐seq) analyses and cluster identification. A) Pie charts showing number of cells included before (left) and after (right) quality control (QC) at each timepoint. B) Integrated UMAP plots showing single‐cell spatial distribution after batch effect correction, grouping cells according to timepoints. C) Individual UMAP plots showing single‐cell spatial distribution at corresponding timepoint. D) Individual UMAP plots showing single‐cell spatial distribution of clusters classified within individual timepoints. E) Individual UMAP plots showing single‐cell spatial distribution of clusters classified among integrated cells from all timepoints. F) UMAP plot of overall single‐cell spatial distribution of clusters classified by integration of five timepoints, cluster 0–11. G) UMAP plot of individual single‐cell spatial distribution of clusters classified by integration of five timepoints, cluster 0–11. H) Stacked area chart showing percentage population of cells in each cluster at each timepoint. Five timepoints included parental, early invasion 6 h, early invasion 48 h, micrometastasis 2 mo, and metastatic colonization 4 mo.
Figure 3
Figure 3
Cluster S spatial distribution and characteristics at different metastatic timepoints. Cluster S (blue) and Non‐cluster S (orange). Timepoints include overall integration, parental, 6 h, 48 h, 2 mo, and 4 mo. Seven metastasis‐initiating signatures (MISs) include CD44, CST6, C19orf33, TACSTD2, S100A14, RHOD, and TM4SF1. A) Individual UMAP plots showing spatial distribution of Cluster S and non‐Cluster S at each timepoints. B) Overlayed bar chart and line graph showing percentage population of cells in Cluster S (bars) and 7 MISs (lines) at each timepoints. C) Dot plots showing biological processes and signaling pathways enriched in Gene ontology (GO; upper) and KEGG (lower) analyses of top 100 significantly upregulated genes in Cluster S at overall integration. D) Dot plots showing biological processes and signaling pathways enriched in Gene ontology (GO; upper) and KEGG (lower) analyses of top 100 significantly upregulated genes in Cluster S at parental stage. E) Violin plot showing 7 MISs expressions in Cluster S and non‐Cluster S at parental stage. Expression defined at Log 2 maximum count. Mann‐Whitney U Test, ****p < 0.0001, ***p < 0.001, **p < 0.01, *p < 0.05, and ns: p ≥ 0.05. F) Individual UMAP plots showing spatial distribution of positive cells of each MIS at overall integration. G) Individual UMAP plots showing spatial distribution of positive cells of each MIS at parental stage.
Figure 4
Figure 4
Transcriptomic analyses and functional assays of CD44 high ESCC cells signify metastatic potentials. A) Volcano plot of gene expression of CD44‐signature enriched (CD44 high) KYSE30 cells showing 113 upregulated and 401 downregulated genes (FDR < 0.05, Log2FC ≥ 1) compared to CD44‐signature low (CD44 low) cells. B) Dot plot showing gene ontology (GO) enrichment analyses of top 100 differentially upregulated genes expresses in CD44 high KYSE30 cells, 15 significantly enriched biological processes were shown (FDR < 0.05). C) Dot plot showing KEGG pathway analyses of top 100 differentially upregulated genes expressed in CD44 high KYSE30 cells, 9 significantly enriched pathways were shown (p < 0.05). D) Representative images of wound‐healing, migration, invasion, foci formation, soft agar colony formation, and spheroid formation assays. E) Corresponding statistical analyses results of functional assays. Wound‐healing assay (control n = 6, CD44 high n = 6, CD44 low n = 5); migration assay (control n = 5, CD44 high n = 5, CD44 low n = 5); invasion assay (control n = 15, CD44 high n = 15, CD44 low n = 15); foci formation assay (control n = 3, CD44 high n = 3, CD44 low n = 3); soft agar assay (control n = 3, CD44 high n = 3, CD44 low n = 3); spheroid formation assay (control n = 3, CD44 high n = 3, CD44 low n = 3). Kruskal‐Wallis H Test, ****p < 0.0001, ***p < 0.001, **p < 0.01, *p < 0.05, and ns: p ≥ 0.05. F) Representative images and corresponding statistical analyses results of reactive oxygen species (ROS) assay (upper) and apoptosis assay (lower) of CD44 high (n = 3), CD44 low (n = 3), and control (n = 3) cells. Kruskal‐Wallis H Test, ****p < 0.0001, ***p < 0.001, **p < 0.01, *p < 0.05, and ns: p ≥ 0.05. G) Western blotting images of protein expressions of epithelial‐mesenchymal transition (EMT) markers of CD44 high, CD44 low, and control cells, including β‐catenin, ZO‐1, E‐cadherin, vimentin, slug, and snail. β‐actin as internal reference. H) Bar charts showing relative RNA expression level of MISs in CD44 high (n = 5) and control (n = 5) cells by quantitative PCR (qPCR) analyses. Including CD44, S100A14, TM4SF1, and CST6. Mann‐Whitney‐U Test, ****p < 0.0001, ***p < 0.001, **p < 0.01, *p < 0.05, and ns: p ≥ 0.05.
Figure 5
Figure 5
In vitro pulmonary metastasis experiment of CD44 high, low, and control cells in NOD SCID mice. A) Representative in vivo bioluminescence images of mice and corresponding resected tissues (lung, liver, and spleen) with intravenous inoculation of CD44 high, low, and control cells (KYSE30‐Luc‐GFP) at 2 h, 40 h, and 2 mo. Scale: 3.22e3 – 1.10e5 radiance (p/sec/cm2/sr). B) Representative IHC staining images of metastasized tumor cells in FFPE mice lungs at 2 mo for CD44 high, low, and control groups. Human pan‐Cytokeratin stained brown. Black arrows and dashed circles indicated tumor cells. Left panel: Whole lung (scale bar = 800 µm). Right small panels: Zoomed‐in sections (scale bar = 100 µm). C) Corresponding tumor site count statistical analyses of IHC staining in CD44 high (n = 6), CD44 low (n = 5), and control (n = 6) groups at 2 mo. D) Representative cell dot plots showing flow cytometry analyses of GFP positive living metastasized tumor cells in each mice lungs of CD44 high, low, and control groups at 40 h (left) and 2 mo (right). E) Corresponding statistical analyses of percentage positive of living metastasized tumor cells in mice lungs of CD44 high (40 h n = 3; 2 mo n = 6), CD44 low (40 h n = 5; 2 mo n = 6), and control (40 h n = 3; 2 mo n = 6) groups at 40 h (left) and 2 mo (right). Kruskal‐Wallis H Test, ****p < 0.0001, ***p < 0.001, **p < 0.01, *p < 0.05, and ns: p ≥ 0.05.
Figure 6
Figure 6
Multiplex IHC (mIHC) staining of MISs in pulmonary metastasized lungs across different timepoints. MISs included CD44 (green; OPAL520), S100A14 (yellow; OPAL570), RHOD (orange; OPAL620), and TACSTD2 (red; OPAL690). Timepoints included 6 h, 48 h, 1wk, 2 mo, and 4 mo. Human pan‐CK (light blue; OPAL480) staining indicates inoculated human ESCC cells, KYSE30‐Luc‐GFP. DAPI (blue) stained nucleus. Arrows and dashed circles indicate tumor cells and nodules, respectively. Grey arrows indicate absence of MIS expression, white arrows, and dashed circles indicate presence of MIS expression in tumor cells or nodules. 20X scale bar: 50 µm. 40X scale bar: 20 µm.
Figure 7
Figure 7
Analyses of differential metastasis‐initiating signature score (dMISs) and patient outcomes. A) Representative multiplex IHC (mIHC) staining of MISs in ESCC tissue microarray (TMA; n = 52) with primary tumor (PT) and paired lymph node metastasis (LNM) tissues in two patients representing low (patient 1) and high (patient 2) dMISs. Min dMISs: −0.3851; max dMISs 0.3996; best low dMISs cutoff at ≤ −0.08025 based on R survival package. Low dMISs: n = 10; high dMISs: n = 42. B) Statistical analyses of dMISs and patient outcomes, including overall survival (OS; top left; n = 52), correlation to lymph node metastasis ratio (positive LN ratio; top right; n = 52), tumor differentiation grading (bottom left; n = 52), and development of carcinothrombosis (bottom right; n = 52). Cox regression survival curve, Spearman's Rho rank correlation test, Kruskal‐Wallis H test, and Mann‐Whitney U test were performed. ****p < 0.0001, ***p < 0.001, **p < 0.01, *p < 0.05, and ns: p ≥ 0.05.

References

    1. Sung H., Ferlay J., Siegel R. L., Laversanne M., Soerjomataram I., Jemal A., Bray F., Ca‐Cancer J. Clin. 2021, 71, 209. - PubMed
    1. Ai D., Zhu H., Ren W., Chen Y., Liu Q., Deng J., Ye J., J. thoracic disease 2017, 9, 3023. - PMC - PubMed
    1. Lin L., Lin D.‐C., Cancers 2019, 11, 1156. - PubMed
    1. Hanahan D., Cancer discovery 2022, 12, 31. - PubMed
    1. Huang Q., Chen H., Yin D., Wang J., Wang S., Yang F., Li J., Mu T., Li J., Zhao J., Yin R., Li W., Qiu M., Zhang E., Li X., NPJ Precision Oncology 2024, 8, 24. - PMC - PubMed

MeSH terms

Substances