

Integrated whole-exome and bulk transcriptome sequencing delineates the dynamic evolution from preneoplasia to invasive lung adenocarcinoma featured with ground-glass nodules
- PMID: 38864483
- PMCID: PMC11167609
- DOI: 10.1002/cam4.7383
Integrated whole-exome and bulk transcriptome sequencing delineates the dynamic evolution from preneoplasia to invasive lung adenocarcinoma featured with ground-glass nodules
Abstract
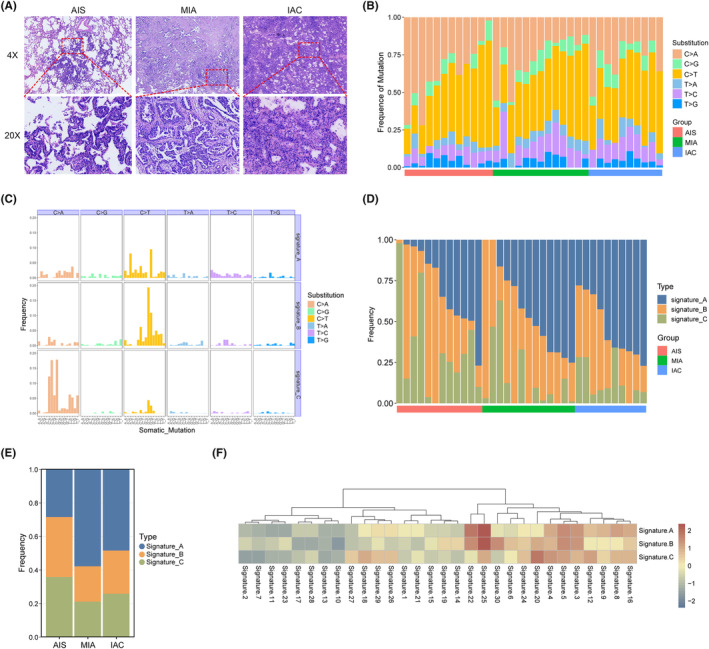
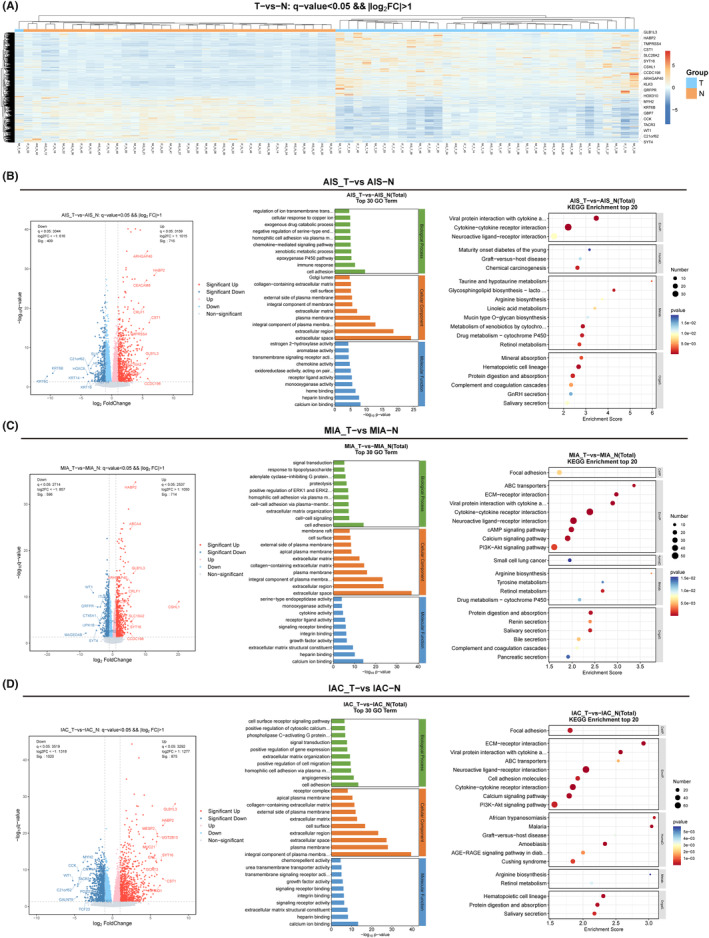
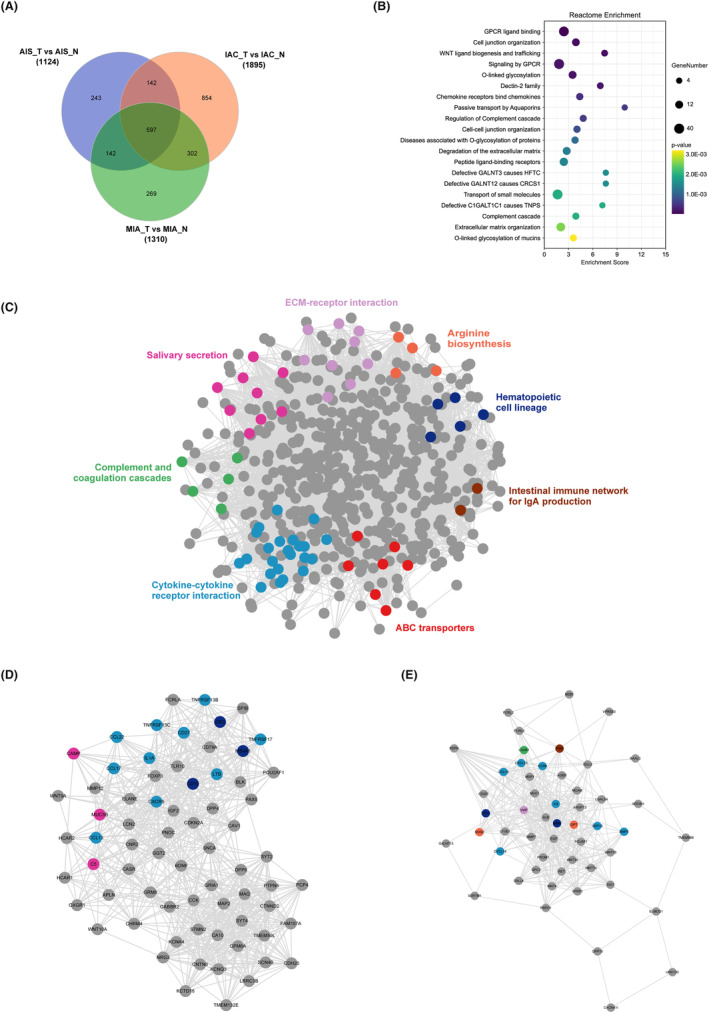
Objective: The genomic and molecular ecology involved in the stepwise continuum progression of lung adenocarcinoma (LUAD) from adenocarcinoma in situ (AIS) to minimally invasive adenocarcinoma (MIA) and subsequent invasive adenocarcinoma (IAC) remains unclear and requires further elucidation. We aimed to characterize gene mutations and expression landscapes, and explore the association between differentially expressed genes (DEGs) and significantly mutated genes (SMGs) during the dynamic evolution from AIS to IAC.
Methods: Thirty-five patients with ground-glass nodules (GGNs) lung adenocarcinomas were enrolled. Whole-exome sequencing (WES) and transcriptome sequencing (RNA-Seq) were conducted on all patients, encompassing both tumor samples and corresponding noncancerous tissues. Data obtained from WES and RNA-Seq were subsequently analyzed.
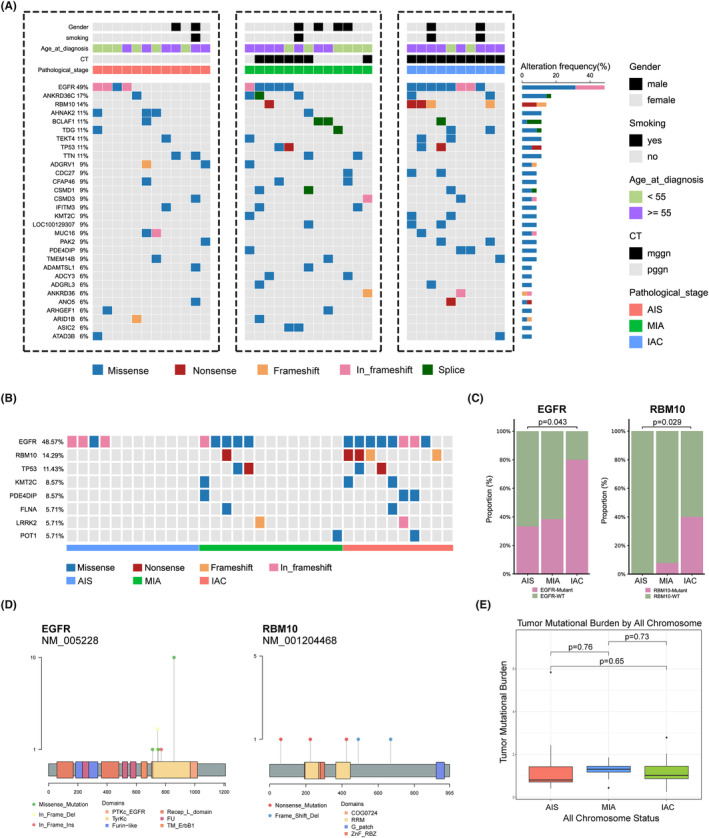
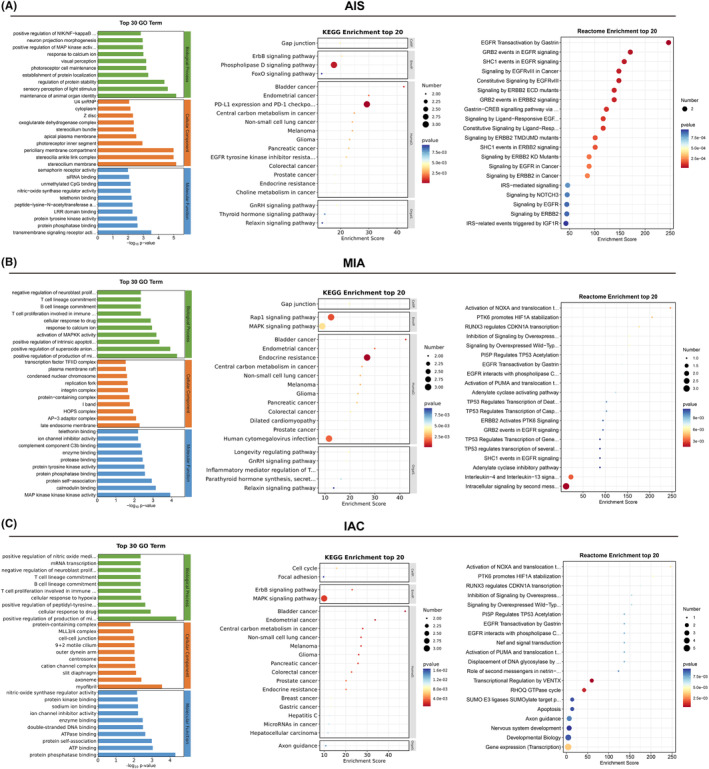
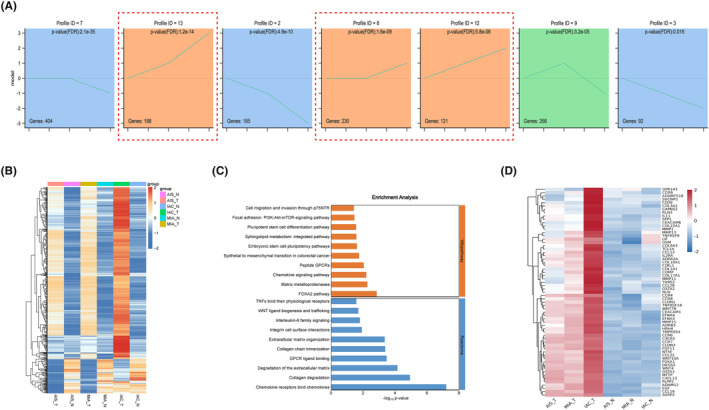
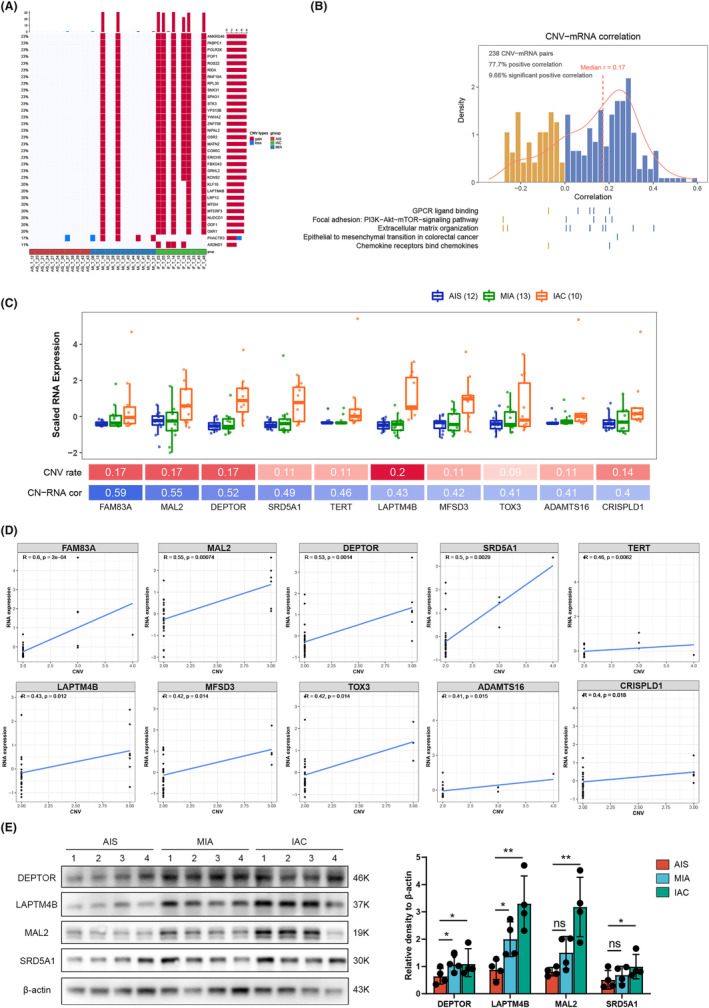
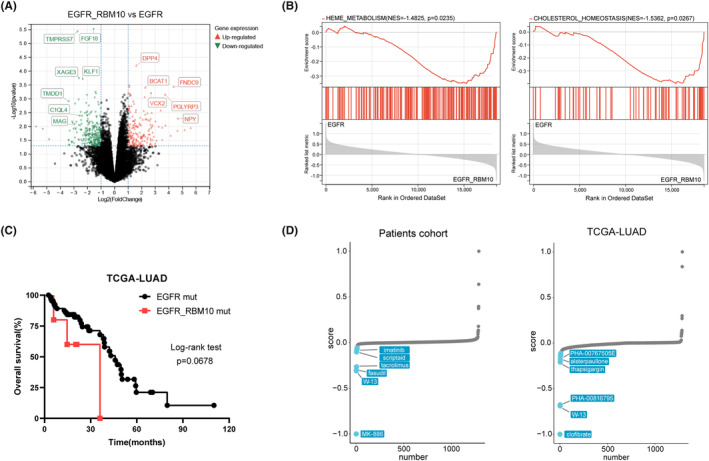
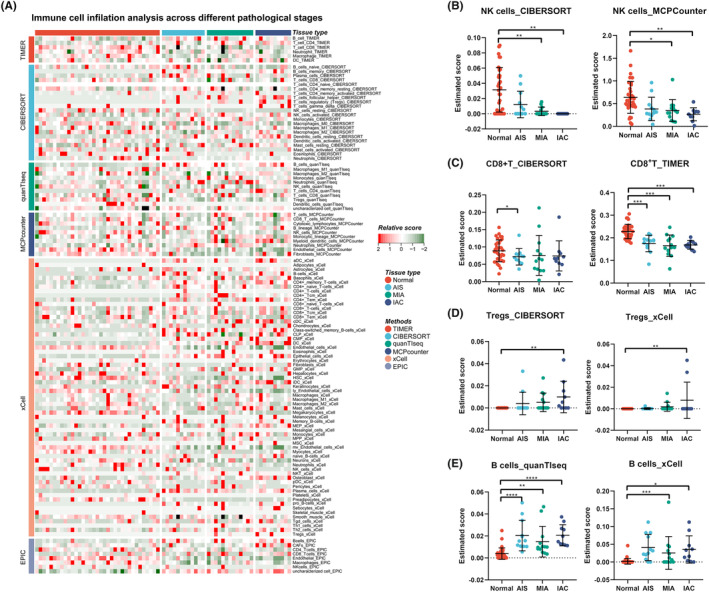
Results: The findings from WES delineated that the predominant mutations were observed in EGFR (49%) and ANKRD36C (17%). SMGs, including EGFR and RBM10, were associated with the dynamic evolution from AIS to IAC. Meanwhile, DEGs, including GPR143, CCR9, ADAMTS16, and others were associated with the entire process of invasive LUAD. We found that the signaling pathways related to cell migration and invasion were upregulated, and the signaling pathways of angiogenesis were downregulated across the pathological stages. Furthermore, we found that the messenger RNA (mRNA) levels of FAM83A, MAL2, DEPTOR, and others were significantly correlated with CNVs. Gene set enrichment analysis (GSEA) showed that heme metabolism and cholesterol homeostasis pathways were significantly upregulated in patients with EGFR/RBM10 co-mutations, and these patients may have poorer overall survival than those with EGFR mutations. Based on the six calculation methods for the immune infiltration score, NK/CD8+ T cells decreased, and Treg/B cells increased with the progression of early LUAD.
Conclusions: Our findings offer valuable insights into the unique genomic and molecular features of LUAD, facilitating the identification and advancement of precision medicine strategies targeting the invasive progression of LUAD from AIS to IAC.
Keywords: RNA‐Seq; ground‐glass nodule; lung adenocarcinoma; tumor immune environment; whole‐exome sequencing.
© 2024 The Author(s). Cancer Medicine published by John Wiley & Sons Ltd.
Conflict of interest statement
None of the authors have a financial or conflict of interest in the outcome of this research.
Figures
Similar articles
-
Genomic Landscape and Immune Microenvironment Features of Preinvasive and Early Invasive Lung Adenocarcinoma.J Thorac Oncol. 2019 Nov;14(11):1912-1923. doi: 10.1016/j.jtho.2019.07.031. Epub 2019 Aug 22. J Thorac Oncol. 2019. PMID: 31446140 Free PMC article.
-
Delineating the dynamic evolution from preneoplasia to invasive lung adenocarcinoma by integrating single-cell RNA sequencing and spatial transcriptomics.Exp Mol Med. 2022 Nov;54(11):2060-2076. doi: 10.1038/s12276-022-00896-9. Epub 2022 Nov 25. Exp Mol Med. 2022. PMID: 36434043 Free PMC article.
-
Single-cell RNA sequencing reveals immune microenvironment niche transitions during the invasive and metastatic processes of ground-glass nodules and part-solid nodules in lung adenocarcinoma.Mol Cancer. 2024 Nov 23;23(1):263. doi: 10.1186/s12943-024-02177-7. Mol Cancer. 2024. PMID: 39580469 Free PMC article.
-
Lung Adenocarcinoma Staging Using the 2011 IASLC/ATS/ERS Classification: A Pooled Analysis of Adenocarcinoma In Situ and Minimally Invasive Adenocarcinoma.Clin Lung Cancer. 2016 Sep;17(5):e57-e64. doi: 10.1016/j.cllc.2016.03.009. Epub 2016 Mar 30. Clin Lung Cancer. 2016. PMID: 27137345 Review.
-
Molecular Alterations in Lung Adenocarcinoma With Ground-Glass Nodules: A Systematic Review and Meta-Analysis.Front Oncol. 2021 Sep 13;11:724692. doi: 10.3389/fonc.2021.724692. eCollection 2021. Front Oncol. 2021. PMID: 34589430 Free PMC article.
Cited by
-
PIN1 serves as a prognostic and therapeutic biomarker in lung adenocarcinoma.Funct Integr Genomics. 2025 Jun 6;25(1):121. doi: 10.1007/s10142-025-01629-7. Funct Integr Genomics. 2025. PMID: 40478452
-
Transforming Properties of E6/E7 Oncogenes from Beta-2 HPV80 in Primary Human Fibroblasts.Int J Mol Sci. 2025 Jun 2;26(11):5347. doi: 10.3390/ijms26115347. Int J Mol Sci. 2025. PMID: 40508156 Free PMC article.
References
-
- Gillespie CS, Mustafa MA, Richardson GE, et al. Genomic alterations and the incidence of brain metastases in advanced and metastatic NSCLC: a systematic review and meta‐analysis. J Thorac Oncol. 2023;18:1703‐1713. - PubMed
MeSH terms
Substances
Grants and funding
- 81972190/National Natural Science Foundation of China
- CSTB2022TIAD-CUX0019/Key Projects on Technological Innovation and Application Development of Chongqing
- cstc2022ycjh-bgzxm0109/Excellent Talent Program of Chongqing
- 2024MSXM090/Science and Technology Commission and the Chongqing Health Commission Joint Medical Research Program of Chongqing
LinkOut - more resources
Full Text Sources
Medical
Research Materials
Miscellaneous
