. 2024 Jun;17(6):e14489.
doi: 10.1111/1751-7915.14489.

Coevolutionary analysis of Pseudomonas syringae-phage interactions to help with rational design of phage treatments

Affiliations

Coevolutionary analysis of Pseudomonas syringae-phage interactions to help with rational design of phage treatments

Mojgan Rabiey et al. Microb Biotechnol. 2024 Jun.

Abstract

Treating plant bacterial diseases is notoriously difficult because of the lack of available antimicrobials. Pseudomonas syringae pathovar syringae (Pss) is a major pathogen of cherry (Prunus avium) causing bacterial canker of the stem, leaf and fruit, impacting productivity and leading to a loss of trees. In an attempt to find a treatment for this disease, naturally occurring bacteriophage (phage) that specifically target Pss is being investigated as a biocontrol strategy. However, before using them as a biocontrol treatment, it is important to both understand their efficacy in reducing the bacterial population and determine if the bacterial pathogens can evolve resistance to evade phage infection. To investigate this, killing curve assays of five MR phages targeting Pss showed that phage resistance rapidly emerges in vitro, even when using a cocktail of the five phages together. To gain insight to the changes occurring, Pss colonies were collected three times during a 66-h killing curve assay and separately, Pss and phage were also coevolved over 10 generations, enabling the measurement of genomic and fitness changes in bacterial populations. Pss evolved resistance to phages through modifications in lipopolysaccharide (LPS) synthesis pathways. Bacterial fitness (growth) and virulence were affected in only a few mutants. Deletion of LPS-associated genes suggested that LPS was the main target receptor for all five MR phages. Later generations of coevolved phages from the coevolution experiment were more potent at reducing the bacterial density and when used with wild-type phages could reduce the emergence of phage-resistant mutants. This study shows that understanding the genetic mechanisms of bacterial pathogen resistance to phages is important for helping to design a more effective approach to kill the bacteria while minimizing the opportunity for phage resistance to manifest.


Conflict of interest statement

The authors declare that they have no conflict of interest.

Figures
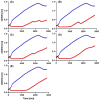
FIGURE 1
FIGURE 1
Arms race dynamics reduce in frequency when bacteria are exposed to more phage genotypes. Shown are in vitro killing curves of phage MR6 individually or in combination with MR1, MR4, MR14 and MR15 at multiplicity of infection of 0.01 on Pseudomonas syringae pv. syringae strain 9097 (Pss) with measurements taken over 3000 min (50 h). (A) phage MR6, (B) phage MR6 and MR15, (C) phage MR6, MR14 and MR15, (D) phage MR6, MR4, MR14 and MR15, (E) phage MR6, MR1, MR4, MR14 and MR15. Top blue line is Pss and bottom red line is Pss and phage(s). The experiment was repeated twice and each line represents the mean of three replicates. Note that the Pss line is the identical data set for each graph, though all treatments were carried out at the same time. Statistical analysis has been included in Table S2.
FIGURE 2
FIGURE 2
Phage‐resistant bacterial mutants dominate the bacterial population after phage application. Shown are in vitro killing curves of wild‐type phage MR6 and cocktail 5 (5C) at multiplicity of infection of 0.01 on wild‐type (WT) Pseudomonas syringae pv. syringae strain 9097 (Pss) and Pss phage‐resistant isolates collected at three time points (T1 [25 h]—A, D, G, T2 [47 h]—B, E, H, T3 [66 h]—C, F, I) over 25 h (1500 min). The 66‐h killing curve assay was done with Pss and phage MR6 (A, B, C), cocktail of 5 phages (5C) (D, E, F) and Pss alone (no phage treatment) (G, H, I) treated with wild‐type 5C. The experiment was repeated twice and each line represents the mean of two replicates. Note that the Pss (WT) line is the identical data set for each graph, though all treatments were carried out at the same time. Statistical analysis has been included in Table S2.
FIGURE 3
FIGURE 3
Phage‐resistance mutations in Pss 9097 initially reduce bacterial fitness in vitro before recovering over time. In vitro growth curves of Pseudomonas syringae pv. syringae strain 9097 (Pss) phage‐resistant isolates collected at three time points (T1—A, D, G, T2—B, E, H, T3—C, F, I), during a 66‐h killing curve assay with phage MR6 (A, B, C), cocktail of 5 phages (5C) (D, E, F) and Pss with no phage treatment (G, H, I). Each experiment was repeated twice and each line represents the mean of two replicates. Note that the Pss (WT) line is the identical data set for each graph, though all treatments were carried out at the same time. Statistical analysis has been included in Table S2.
FIGURE 4
FIGURE 4
The proportion of resistant bacteria increases over time when bacteria are coevolved with phage. The proportion of Pseudomonas syringae pv. syringae strain 9097 resistance to phage MR1, MR4, MR6, MR14 and MR15 was tested over time. The experimental coevolution was done by inoculating 6‐mL King's medium B (KB) broth with phage and bacteria. After 48‐h incubation at 27°C, both bacteria and phage were recovered and transferred to new KB broths. This was repeated for 10 transfers with sample population collections every second transfer. Each phage, collected at each coevolution generation, was tested against the bacterial populations to past (two transfers previous), present (contemporary) and future (two transfers subsequent). Statistical analysis has been included in Table S2.
FIGURE 5
FIGURE 5
Coevolved Pss strains remain susceptible to wild‐type phages and the five‐phage cocktail 5C. In vitro killing curves of phages MR1 (A), MR4 (B), MR6 (C), MR14 (D), MR15 (E), 5C (cocktail of five phages, F) and ancestral Pss passaged without phage treated with cocktail 5C (G) at multiplicity of infection of 0.01 on wild‐type (WT) Pseudomonas syringae pv. syringae strain 9097 (Pss) and Pss phage‐coevolved isolates collected at 2nd (2B), 4th (4B), 6th (6B), 8th (8B) and 10th (10B) transfer, during an experimental coevolution with Pss and phage MR1, MR4, MR6, MR14, MR15 and 5C. The experiment was repeated twice and each line represents the mean of two replicates. Note that the Pss (WT) line is the identical data set for each graph, though all treatments were carried out at the same time. Statistical analysis has been included in Table S2.
FIGURE 6
FIGURE 6
Coevolved Pss strains exhibited either a similar or slower growth pattern compared to the ancestral Pss. In vitro growth curve of coevolved generations (2B to 10B) of Pseudomonas syringae pv. syringae strain 9097 (Pss) after coevolution with phage MR1 (A), MR4 (B), MR6 (C), MR14 (D), MR15 (E), 5C (cocktail of five phages [5C], F) and Pss passaged with no phage treatment (G) treated with cocktail 5C. Pss phage‐coevolved isolates were collected at 2nd (2B), 4th (4B), 6th (6B), 8th (8B) and 10th (10B) transfer. The experiment was repeated twice and each line represents the mean of two replicates. Note that the Pss (WT) line is the identical data set for each graph, though all treatments were carried out at the same time. Statistical analysis has been included in Table S2.
FIGURE 7
FIGURE 7
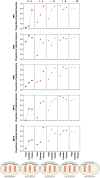
Mutations identified in Pseudomonas syringae pv. syringae strain 9097 (Pss) after single and phage cocktail treatments. Colonies were collected three times (T1, T2 and T3) during the course of 66‐h killing curve assay, with MR1, MR4, MR6, MR14, MR15 and cocktail of five phages (5C). Six colonies were whole genome sequenced at each time point (e.g. T1‐1.1, ‐1.2, ‐2.1, ‐2.2, ‐3.1 and ‐3.2) and variant calling was employed (full details in Table S1). Pss Lipopolysaccharide gene cluster is shown in Figure S8B.
FIGURE 8
FIGURE 8
Mutations identified in Pseudomonas syringae pv. syringae strain 9097 (Pss) after single and phage cocktail coevolution. Colonies were collected at generation 2B, 4B, 6B, 8B and 10B during the experimental coevolution of Pss with phage MR1, MR4, MR6, MR14, MR15 and cocktail of five phages (5C). Three colonies were whole genome sequenced at each generation and variant calling was employed. The Pss Lipopolysaccharide gene cluster is shown in Figure S8B.
FIGURE 9
FIGURE 9
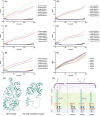
Deletion of genes involved in LPS synthesis prevents wild‐type phages and 5C from killing the bacteria. An in vitro killing curve of phages MR1 (A), MR4 (B), MR6 (C), MR14 (D) and MR15 (E) on Pseudomonas syringae pv. syringae strain 9097 (Pss) wild type (WT) and glycosyltransferase family 1 (gst1), glucose‐1‐phosphate thymidylyltransferase (gpt), lipopolysaccharide kinase (lpk), phosphomannomutase (pmm), ATP‐grasp domain‐containing protein (agd), autotransporter outer membrane protein (aom) mutants (Δ). Pss WT and all Pss mutants with no phage are shown in (F). The predicted native protein structure (G) of gst1 in Pss WT and the predicted protein structure of gst1 (BKC06_002880) how mutation identified in gst1 changes the structure (created in Swissmodel.expasy.org). The last panel (H) is the putative structure of lipopolysaccharide (LPS) in Pss, consisting of lipid A, core and O antigen and hypotheses on how mutation in proteins involved in LPS biosynthesis can lead to phage resistance (created in Biorender.com). The experiment was repeated twice and each line represents the mean of two replicates. Note that the Pss (WT) line is the identical data set for each graph, though all treatments were carried out at the same time. Statistical analysis has been included in Table S2.
FIGURE 10
FIGURE 10
The addition of trained phages to cocktail 5C reduces the emergence of phage resistance. An in vitro Killing curve of phage MR6, cocktail (5C) and MR6 coevolved generation 6 (6P) and 10 (10P) on Pseudomonas syringae pv. syringae strain 9097 (Pss). The experiment was repeated twice and each line represents two replicates. Note that the Pss (WT) line is the identical data set for each graph, though all treatments were carried out at the same time.

References

    1. Abedeera, S.M. , Jayalath, K.S. , Xie, J. , Rauff, R.M. & Abeysirigunawardena, S.C. (2023) Pseudouridine synthase RsuA confers a survival advantage to bacteria under streptomycin stress. Antibiotics, 12(9), 1447. - PMC - PubMed
    1. Anantharaman, V. , Iyer, L.M. & Aravind, L. (2012) Ter‐dependent stress response systems: novel pathways related to metal sensing, production of a nucleoside‐like metabolite, and DNA‐processing. Molecular BioSystems, 8(12), 3142–3165. - PMC - PubMed
    1. Bhambhani, A. , Iadicicco, I. , Lee, J. , Ahmed, S. , Belfatto, M. , Held, D. et al. (2020) Bacteriophage SP01 gene product 56 inhibits Bacillus subtilis cell division by interacting with FtsL and disrupting Pbp2B and FtsW recruitment. Journal of Bacteriology, 203(2), e00463–20. - PMC - PubMed
    1. Brüssow, H. (2005) Phage therapy: the Escherichia coli experience. Microbiology, 151(7), 2133–2140. - PubMed
    1. Buckling, A. , Wei, Y. , Massey, R.C. , Brockhurst, M.A. & Hochberg, M.E. (2006) Antagonistic coevolution with parasites increases the cost of host deleterious mutations. Proceedings. Biological sciences, 273(1582), 45–49. - PMC - PubMed

Publication types

MeSH terms

Associated data

LinkOut - more resources