. 2024 Jun 4;34(6):bhae245.
doi: 10.1093/cercor/bhae245.

Beyond faces: the contribution of the amygdala to visual processing in the macaque brain

Affiliations

Beyond faces: the contribution of the amygdala to visual processing in the macaque brain

Jessica Taubert et al. Cereb Cortex. .

Abstract

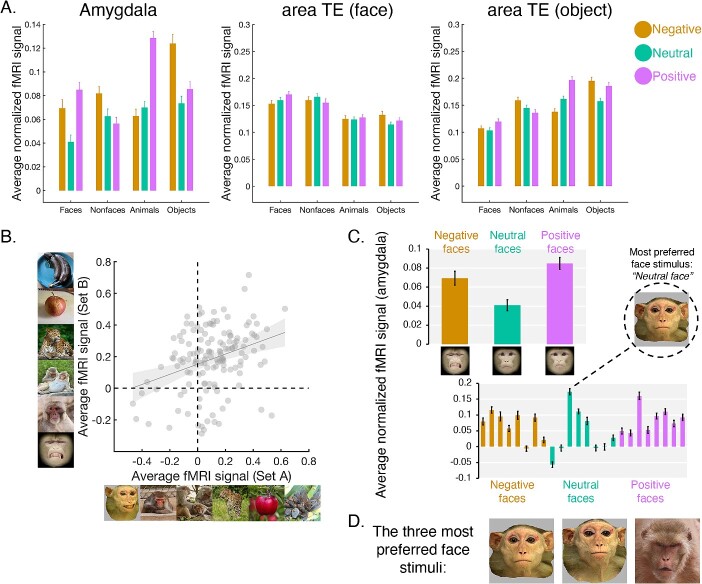
The amygdala is present in a diverse range of vertebrate species, such as lizards, rodents, and primates; however, its structure and connectivity differs across species. The increased connections to visual sensory areas in primate species suggests that understanding the visual selectivity of the amygdala in detail is critical to revealing the principles underlying its function in primate cognition. Therefore, we designed a high-resolution, contrast-agent enhanced, event-related fMRI experiment, and scanned 3 adult rhesus macaques, while they viewed 96 naturalistic stimuli. Half of these stimuli were social (defined by the presence of a conspecific), the other half were nonsocial. We also nested manipulations of emotional valence (positive, neutral, and negative) and visual category (faces, nonfaces, animate, and inanimate) within the stimulus set. The results reveal widespread effects of emotional valence, with the amygdala responding more on average to inanimate objects and animals than faces, bodies, or social agents in this experimental context. These findings suggest that the amygdala makes a contribution to primate vision that goes beyond an auxiliary role in face or social perception. Furthermore, the results highlight the importance of stimulus selection and experimental design when probing the function of the amygdala and other visually responsive brain regions.

Keywords: NHP fMRI; amygdala function; emotional valence; social relevance; visual categories.


Figures

Fig. 1
Fig. 1
Experimental design and localizer data. (A) Examples of the visual stimuli from the set of 96 photographs used in the experiment. See Fig. 1-1 in supplementary data for all experimental stimuli. (B) Top, schematic of the anatomical boundary of the macaque amygdala used to mask the ROI in the corresponding structural data for the individual subjects (see mask superimposed on coronal slices at the bottom—AP coordinates reflect distance from the interaural line). (C) Left, examples of the stimuli used in the independent localizer experiment. Right, the independent data used to verify the stimulus preferences of the functionally defined ROIs in the anterior inferior temporal cortex (area TE). For the sake of comparison, the localizer data for the amygdala is also plotted. These data are separated by subject (top = subject J, middle = subject R, and bottom = subject S). At the top of the bar graphs is a representative example of the ROI masks superimposed on subject J’s high-resolution template. The area TE masks are visualized on a representative sagittal slice (left hemisphere), whereas the amygdala mask is visualized on a representative coronal slice (The black tracks indicate the location of electrodes that had been positioned to record from the right amygdala in this animal.) Stimuli shown here were photographs taken by J. Taubert or were images published under a CC-BY license.
Fig. 2
Fig. 2
Activity in the amygdala is driven more by nonsocial than social stimuli. (A) Bar graphs showing the average normalized fMRI signal across the 6 unique experimental conditions in the 2 (social vs. nonsocial) × 3 (positive vs. neutral vs. negative) factorial design. Left = the results for the amygdala; middle = the results for the face-selective ROI; right = the results for the object-selective ROI. Error bars = SEM. Colors reflect the emotional valence condition as indicated in the legend to the right. (B) Analyses of individual subject data for each ROI (left = amygdala, middle = face-selective ROI, right = object-selective ROI). Same conventions as (A). Top, average % signal change in subject J (male). Middle, average % signal change in subject R (female). Bottom, average % signal change in subject S (female).
Fig. 3
Fig. 3
Amygdala responses to different visual categories. (A) Bar graphs showing the average normalized fMRI signal across the 12 unique experimental conditions in the 3 (negative vs. neutral vs. positive) × 4 (faces vs. nonfaces vs. animals vs. objects) factorial design. Left = the results for the amygdala; middle = the results for the face-selective ROI; right = the results for the object-selective ROI). Error bars = + SEM. Colors reflect valence condition. See Table 1-1 in supplementary data for results of all pairwise follow-up tests. (B) A scatterplot showing the correlation between the response of the amygdala to images in set A and the response of the amygdala to images in set B. Examples of images from sets A and B are shown alongside the corresponding axes. While the images in sets A and B were not identical, they were selected to represent the same stimulus category (i.e. “fearful face,” “alpha male,” “grooming,” “leopard,” “apple,” “rotten banana”). (C) (Top) Bar graph showing the average response of the amygdala to face stimuli as a function of emotional valence (error bars = +/− SEM; color reflects valence condition). (Bottom) Bar graph showing the average response of the amygdala to each face stimulus as a function of emotional valence (error bars = +/− SEM; color reflects valence condition). The call out flags the face stimulus that, on average, evoked the greatest response from amygdala voxels. (D) From left to right, the 3 face stimuli that evoked the greatest responses from the amygdala. The first 2 are from set A (i.e. a neutral face and then a submissive face Hoffman et al. 2007) and third is from set B (i.e. a threatening face). Photograph taken by J. Taubert.
Fig. 4
Fig. 4
Stimulus preferences in the amygdala. (A) Average normalized fMRI response to 96 stimuli, organized by fMRI activity (from most activating to most inhibiting). Bars reflect social relevance (top), emotional valence (middle), and high-level visual category (bottom). (B) The 4 stimuli that drove the most activity from the amygdala (left), the face-selective ROI (middle), and the object-selective ROI (right). Bars reflect social relevance (red = social, blue = nonsocial), and labels reflect visual category.
Fig. 5
Fig. 5
The results of the RSA. (A) For each subject, we constructed a (96 × 96) representational dissimilarity matrix (RDM) based on the normalized response of the amygdala voxels to each of the 96 visual stimuli. We then averaged these together to generate the average RDM (middle). On the right are 6 RDMs derived from state-of-the-art computational models. For all RDMs, the stimuli are ordered the same way, following the experimental design; the manipulation of visual category is nested within the manipulation of emotional valence, and emotional valence is nested within the manipulation of social relevance. This organization is illustrated with color bars below the average RDM. (B) We took the data in the average RDM and reordered the stimuli according to the 3 experimental manipulations before averaging the dissimilarity scores. Left, all social and nonsocial cells were averaged (excluding the diagonal). Middle, the stimuli were organized based on valence and all negative, neutral, and positive cells were averaged (excluding the diagonal). Right, the stimuli were organized based on visual category and all face, nonface, animal, and object cells were averaged (excluding the diagonal). The same color scale was used for all 3 RDMs (i.e. 0.83–0.9).
Fig. 6
Fig. 6
The majority of amygdala voxels respond more to objects than faces. (A) The distribution of SSI (left), VSI (middle), and FSI (right) values for amygdala voxels. Selectivity values range from −1 to 1 (i.e. a selectivity index equal to zero would mean the voxel responded equally to both categories). Median selectivity values for each distribution are provided. Dashed lines reflect category-selectivity = 0. (B) Category-selective distributions as in (A) for voxels in the face-selective ROI (top row) and the object-selective ROI (bottom row) (same conventions as in A).

Similar articles

References

    1. Amaral DG, Price JL. Amygdalo-cortical projections in the monkey (Macaca fascicularis). J Comp Neurol. 1984:230(4):465–496. 10.1002/cne.902300402. - DOI - PubMed
    1. Arcaro MJ, Schade PF, Vincent JL, Ponce CR, Livingstone MS. Seeing faces is necessary for face-domain formation. Nat Neurosci. 2017:20(10):1404–1412. 10.1038/nn.4635. - DOI - PMC - PubMed
    1. Avery JA, Liu AG, Ingeholm JE, Gotts SJ, Martin A. Viewing images of foods evokes taste quality-specific activity in gustatory insular cortex. Proc Natl Acad Sci USA. 2021:118(2):1–11. 10.1073/pnas.2010932118. - DOI - PMC - PubMed
    1. Bao P, She L, McGill M, Tsao DY. A map of object space in primate inferotemporal cortex. Nature. 2020:583(7814):103–108. 10.1038/s41586-020-2350-5. - DOI - PMC - PubMed
    1. Basile BM, Costa VD, Schafroth JL, Karaskiewicz CL, Lucas DR, Murray EA. The amygdala is not necessary for the familiarity aspect of recognition memory. Nat Commun. 2023:14(1):8109. 10.1038/s41467-023-43906-8. - DOI - PMC - PubMed

Publication types