Transcriptional responses of brain endothelium to Plasmodium falciparum patient-derived isolates in vitro
- PMID: 38864616
- PMCID: PMC11218514
- DOI: 10.1128/spectrum.00727-24
Transcriptional responses of brain endothelium to Plasmodium falciparum patient-derived isolates in vitro
Abstract
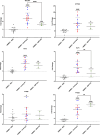
A hallmark of cerebral malaria (CM) is sequestration of Plasmodium falciparum-infected erythrocytes (IE) within the brain microvasculature. Binding of IE to endothelium reduces microvascular flow and, combined with an inflammatory response, perturbs endothelial barrier function, resulting in breakdown of the blood-brain barrier (BBB). Cytoadherence leads to activation of the endothelium and alters a range of cell processes affecting signaling pathways, receptor expression, coagulation, and disruption of BBB integrity. Here, we investigated whether CM-derived parasites elicit differential effects on human brain microvascular endothelial cells (HBMECs), as compared to uncomplicated malaria (UM)-derived parasites. Patient-derived IE from UM and CM clinical cases, as well as non-binding skeleton-binding protein 1 knockout parasites, were overlaid onto tumour necrosis factor (TNF)-activated HBMECs. Gene expression analysis of endothelial responses was performed using probe-based assays of a panel of genes involved in inflammation, apoptosis, endothelial barrier function, and prostacyclin synthesis pathway. We observed a significant effect on endothelial transcriptional responses in the presence of IE, yet there was no significant correlation between HBMEC responses and type of clinical syndrome (UM or CM). Furthermore, there was no correlation between HBMEC gene expression and both binding itself and level of IE binding to HBMECs, as we detected the same change in endothelial responses when employing both binding and non-binding parasites. Our results suggest that interaction of IE with endothelial cells in this co-culture model induces some endothelial responses that are independent of clinical origin and independent of the expression of the major variant antigen Plasmodium falciparum erythrocyte membrane protein 1 on the IE surface.
Importance: Cerebral malaria (CM) is the most prevalent and deadly complication of severe Plasmodium falciparum infection. A hallmark of this disease is sequestration of P. falciparum-infected erythrocytes (IE) in brain microvasculature that ultimately results in breakdown of the blood-brain barrier. Here, we compared the effect of P. falciparum parasites derived from uncomplicated malaria (UM) and CM cases on the relative gene expression of human brain microvascular endothelial cells (HBMECs) for a panel of genes. We observed a significant effect on the endothelial transcriptional response in the presence of IE, yet there is no significant correlation between HBMEC responses and the type of clinical syndrome (UM or CM). Furthermore, there was no correlation between HBMEC gene expression and both binding itself and the level of IE binding to HBMECs. Our results suggest that interaction of IE with endothelial cells induces endothelial responses that are independent of clinical origin and not entirely driven by surface Plasmodium falciparum erythrocyte membrane protein 1 expression.
Keywords: HBMEC; Plasmodium falciparum; cerebral malaria; cytoadherence; endothelium; gene expression.
Conflict of interest statement
The authors declare no conflict of interest.
Figures


Similar articles
-
Plasmodium falciparum and TNF-α Differentially Regulate Inflammatory and Barrier Integrity Pathways in Human Brain Endothelial Cells.mBio. 2022 Oct 26;13(5):e0174622. doi: 10.1128/mbio.01746-22. Epub 2022 Aug 29. mBio. 2022. PMID: 36036514 Free PMC article.
-
Interplay of Plasmodium falciparum and thrombin in brain endothelial barrier disruption.Sci Rep. 2019 Sep 11;9(1):13142. doi: 10.1038/s41598-019-49530-1. Sci Rep. 2019. PMID: 31511575 Free PMC article.
-
PfEMP1 A-Type ICAM-1-Binding Domains Are Not Associated with Cerebral Malaria in Beninese Children.mBio. 2020 Nov 17;11(6):e02103-20. doi: 10.1128/mBio.02103-20. mBio. 2020. PMID: 33203751 Free PMC article.
-
Plasmodium falciparum picks (on) EPCR.Blood. 2014 Jan 9;123(2):163-7. doi: 10.1182/blood-2013-09-521005. Epub 2013 Nov 18. Blood. 2014. PMID: 24246501 Free PMC article. Review.
-
Cerebral Malaria and Neuronal Implications of Plasmodium Falciparum Infection: From Mechanisms to Advanced Models.Adv Sci (Weinh). 2022 Dec;9(36):e2202944. doi: 10.1002/advs.202202944. Epub 2022 Oct 27. Adv Sci (Weinh). 2022. PMID: 36300890 Free PMC article. Review.
Cited by
-
Plasmodium falciparum egress disrupts endothelial junctions and activates JAK-STAT signaling in a microvascular 3D blood-brain barrier model.Nat Commun. 2025 Aug 6;16(1):7262. doi: 10.1038/s41467-025-62514-2. Nat Commun. 2025. PMID: 40769972 Free PMC article.
References
-
- World Health Organization . 2023. World malaria report 2023. Licence: CC BY-NC-SA 3.0 IGO. Geneva
MeSH terms
Grants and funding
LinkOut - more resources
Full Text Sources
Research Materials

