. 2024 Nov;57(11):e13687.
doi: 10.1111/cpr.13687. Epub 2024 Jun 12.

Procyanidin B2 improves developmental capacity of bovine oocytes via promoting PPARγ/UCP1-mediated uncoupling lipid catabolism during in vitro maturation

Affiliations

Procyanidin B2 improves developmental capacity of bovine oocytes via promoting PPARγ/UCP1-mediated uncoupling lipid catabolism during in vitro maturation

Yuwen Luo et al. Cell Prolif. 2024 Nov.

Abstract

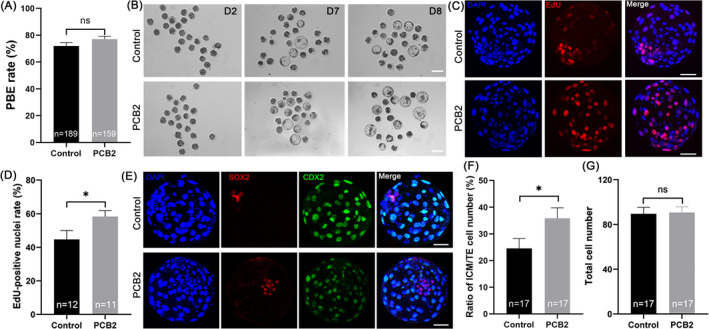
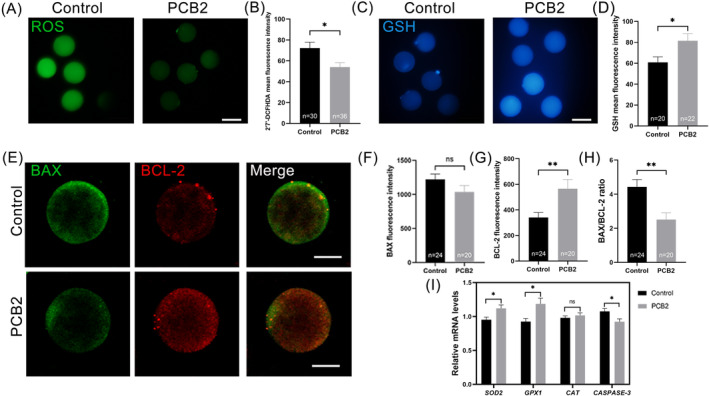
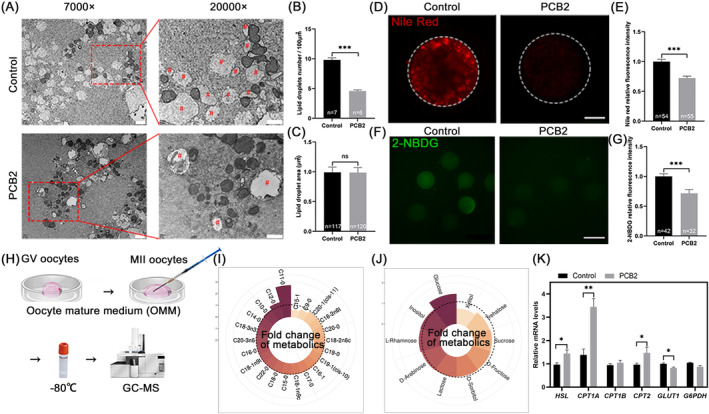
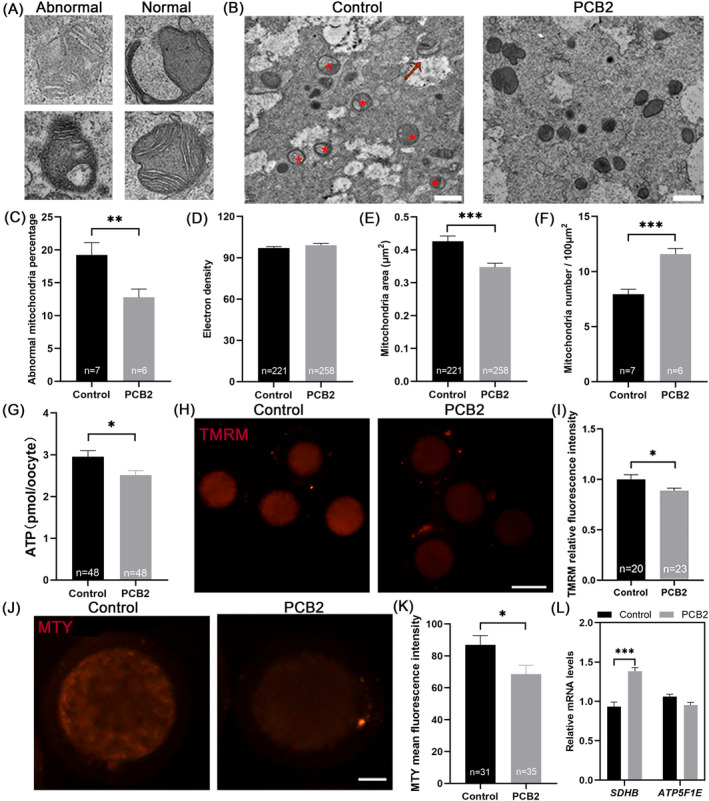
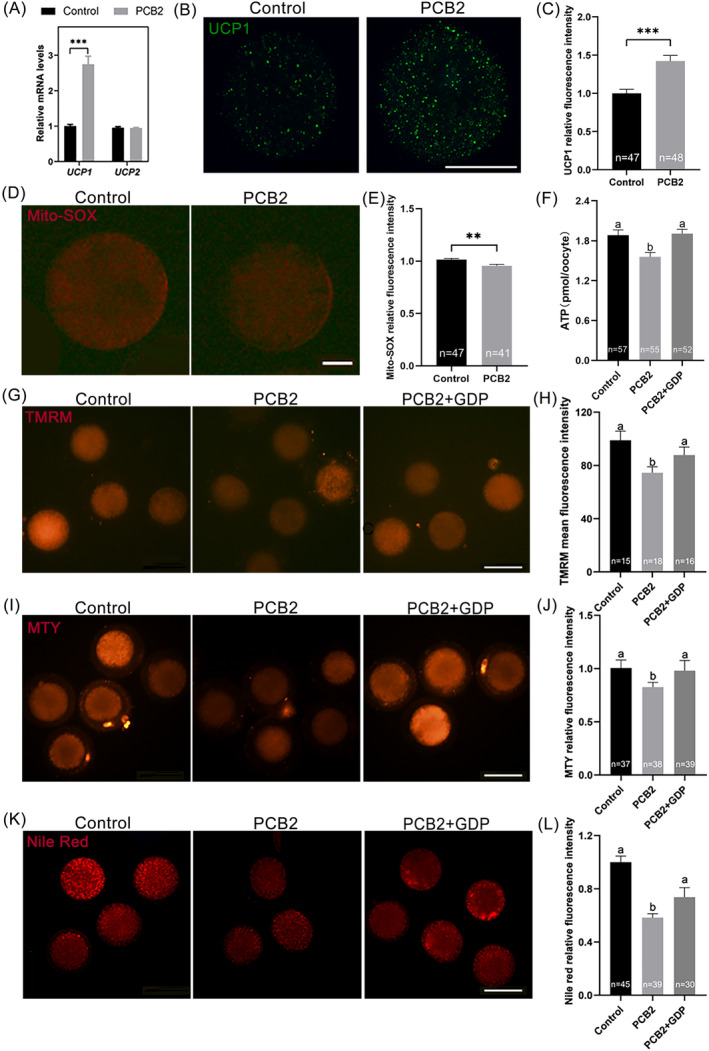
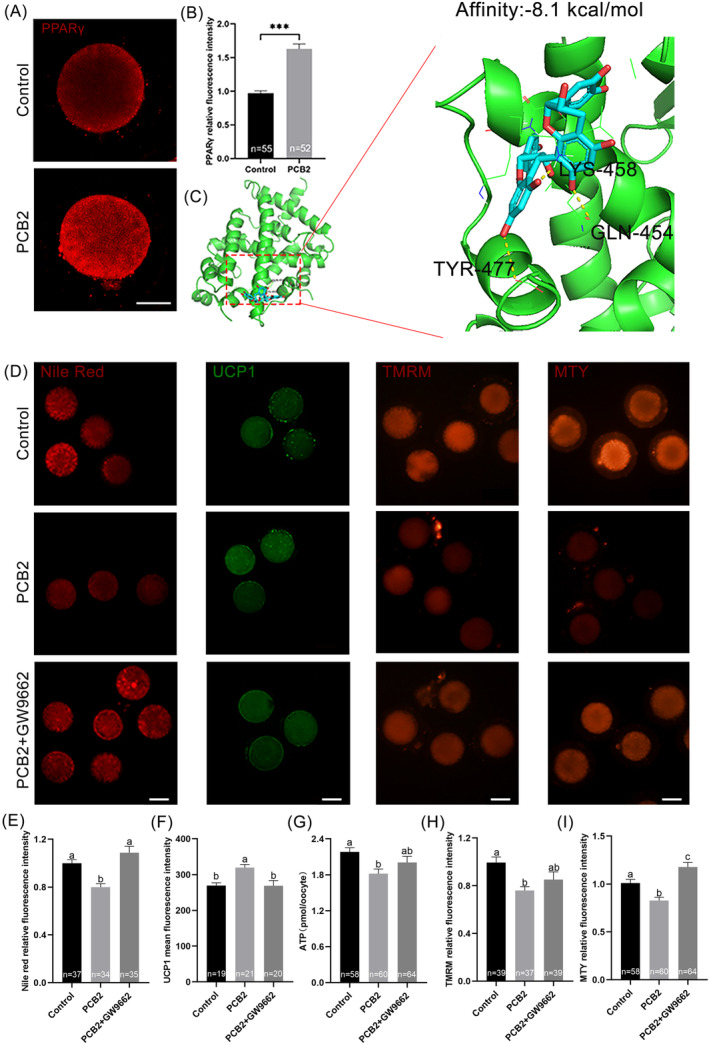
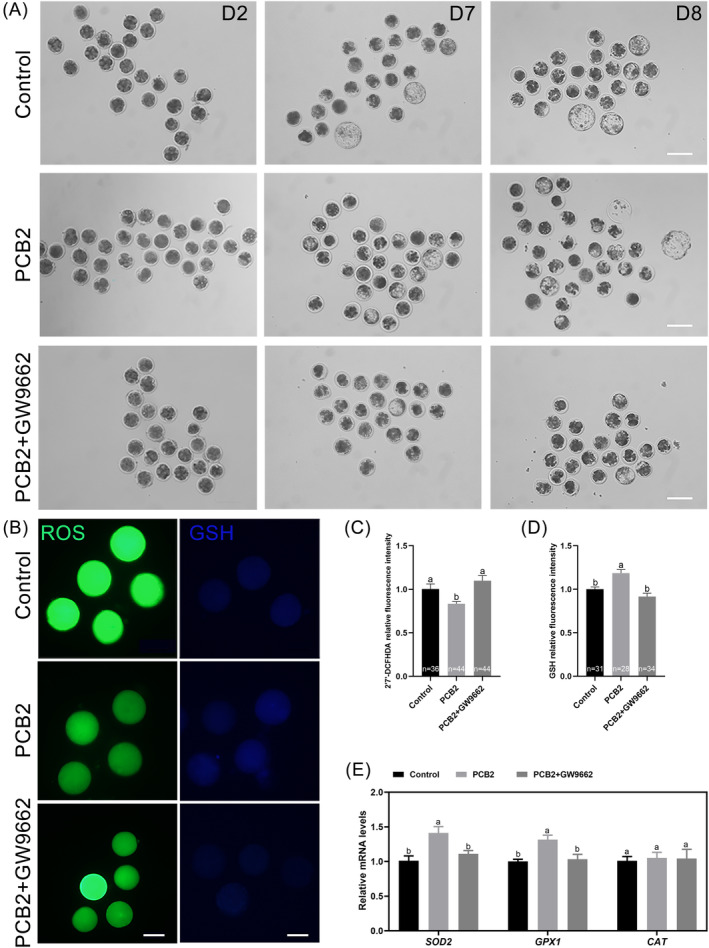
Metabolic balance is essential for oocyte maturation and acquisition of developmental capacity. Suboptimal conditions of in vitro cultures would lead to lipid accumulation and finally result in disrupted oocyte metabolism. However, the effect and mechanism underlying lipid catabolism in oocyte development remain elusive currently. In the present study, we observed enhanced developmental capacity in Procyanidin B2 (PCB2) treated oocytes during in vitro maturation. Meanwhile, reduced oxidative stress and declined apoptosis were found in oocytes after PCB2 treatment. Further studies confirmed that oocytes treated with PCB2 preferred to lipids catabolism, leading to a notable decrease in lipid accumulation. Subsequent analyses revealed that mitochondrial uncoupling was involved in lipid catabolism, and suppression of uncoupling protein 1 (UCP1) would abrogate the elevated lipid consumption mediated by PCB2. Notably, we identified peroxisome proliferator-activated receptor gamma (PPARγ) as a potential target of PCB2 by docking analysis. Subsequent mechanistic studies revealed that PCB2 improved oocyte development capacity and attenuated oxidative stress by activating PPARγ mediated mitochondrial uncoupling. Our findings identify that PCB2 intricately improves oocyte development capacity through targeted activation of the PPARγ/UCP1 pathway, fostering uncoupling lipid catabolism while concurrently mitigating oxidative stress.


Conflict of interest statement

The authors declare that they have no competing interests.

Figures

FIGURE 1
FIGURE 1
PCB2 supplementation improves oocyte developmental capacity. (A) The rate of PBE in control and PCB2‐treated oocytes. (B) Representative images of early embryos derived from in vitro fertilized oocytes. Scale bar, 100 μm. (C) Representative images of blastocyst stained with EdU and DNA. Scale bar, 50 μm. (D) Statistical analysis of the percentage of EdU‐positive cells. (E) Representative images of blastocysts stained with DNA, CDX2, and SOX2. Scale bar, 50 μm. (F) Statistical analysis of the ratio of ICM/TE. (G) Statistical analysis of total cell number. “n” represents the number of cells utilized in this study. All experiments were conducted in triplicate, and data are presented as mean ± SEM. ns = non significance, *, P < 0.05, **, P < 0.01.
FIGURE 2
FIGURE 2
Effect of adding PCB2 on oxidative stress status and apoptosis in oocytes. (A) Representative images of MII oocytes stained with ROS. Scale bar, 100 μm. (B) Statistical analysis of ROS fluorescence intensity. (C) Representative images of MII oocytes stained with GSH. Scale bar, 100 μm. (D) Statistical analysis of GSH fluorescence intensity. (E) Representative images of MII oocytes stained with BAX and BCL‐2. Scale bar, 50 μm. (F) Statistical analysis of BAX fluorescence intensity. (G) Statistical analysis of BCL‐2 fluorescence level. (H) Statistical analysis of the ratio of BAX/BCL‐2. (I) Statistical analysis of relative expression levels of SOD2, GPX1, CAT, and CASPASE‐3 in MII bovine oocyte. “n” represents the cell number used in this experiment. All experiments were performed in triplicate and data were represented as mean ± SEM. ns = non significance, *, P < 0.05, **, P < 0.01.
FIGURE 3
FIGURE 3
Effect of adding PCB2 on lipid metabolism and glucose uptake. (A) Representative images of lipid droplets in MII oocytes by TEM. 7000×, scale bar, 2 μm, 20,000×, scale bar, 1 μm. Red pound key (#) represents the lipid droplet. (B) Quantification analysis of the lipid droplet number per 100 μm2. (C) Quantification analysis of the mitochondrial area in oocytes. (D) Representative images of MII oocytes stained with Nile Red. Scale bar, 20 μm. (E) Statistical analysis of Nile Red fluorescence intensity. (F) Representative images of MII oocytes stained with 2‐NBDG. Scale bar, 100 μm. (G) Statistical analysis of 2‐NBDG fluorescence intensity. (H) Schematic diagram of metabolomic sample collection. (I) Nightingale rose chart represents the fold change of lipids in the medium between Control and PCB2 groups. Black dotted box, fold change = 1. (J) Nightingale Rose Chart represents the fold change of carbohydrates in the medium between Control and PCB2 groups. Black dotted box, fold change = 1. (K) Statistical histogram analysis of relative expression levels of CPT1a, CPT1b, CPT2, HSL GLUT1, and G6PDH, in MII oocytes. “n” represents the cell droplet number used in this experiment. All experiments were performed in triplicate and the data were represented as mean ± SEM. *, P < 0.05, **, P < 0.01, ***, P < 0.001.
FIGURE 4
FIGURE 4
Effect of adding PCB2 on mitochondrial function in oocytes. (A) Mitochondria ultrastructure observed in TEM images of oocytes. The abnormal mitochondria are characterized by a non‐uniform matrix (up‐left) and loss of cristae (down‐left). The normal mitochondrial structure included cap‐shaped (up‐right) and typical spherical with cristae (down‐right). (B) Representative images of mitochondria morphology and structure in Control and PCB2 oocytes by TEM. Red arrow and red star (*) represented cap‐shaped mitochondria and abnormal mitochondria respectively. Scale bar, 2 μm. (C) Quantification analysis of abnormal mitochondria percentage per 100 μm2 in Control and PCB2‐treated oocytes. (D) Quantification analysis of the mitochondrial electron density in Control and PCB2 groups of oocytes. (E) Quantification analysis of the mitochondrial area in Control and PCB2 groups of oocytes. (F) Quantification analysis of the mitochondrial number per 100 μm2 in Control and PCB2‐treated oocytes. (G) Statistical analysis of ATP content level. (H) Representative images of MII oocytes stained with TMRM. Scale bar, 100 μm. (I) Statistical analysis of MMP fluorescence intensity. (J) Representative images of MII oocytes stained with MTY. Scale bar, 20 μm. (K) Statistical analysis of MTY fluorescence intensity. (L) Statistical analysis of relative expression levels of SDHB and ATP5F1E in MII oocytes. “n” represents the cell number used in this experiment or mitochondria. All experiments were performed in triplicate and the data were represented as mean ± SEM. ns = non significance, *, P < 0.05, **, P < 0.01, ***, P < 0.001.
FIGURE 5
FIGURE 5
UCP1 antagonist abrogated the positive effects of PCB2 on mitochondrial uncoupling lipid catabolism. (A) Statistical analysis of relative expression levels of UCP1, and UCP2 in MII oocytes. (B) Representative images of MII oocytes stained with UCP1. Scale bar, 50 μm. (C) Statistical analysis of UCP1 fluorescence intensity. (D) Representative images of MII oocytes stained with Mito‐SOX. Scale bar, 20 μm. (E) Statistical analysis of Mito‐SOX fluorescence intensity. (F) Statistical analysis of ATP content. (G) Representative images of TMRM fluorescence intensity. Scale bar, 100 μm. (H) Statistical analysis of TMRM fluorescence intensity. (I) Representative images of MTY fluorescence intensity. Scale bar, 100 μm. (J) Statistical analysis of MTY fluorescence intensity. (K) Representative images of Nile Red fluorescence intensity. Scale bar, 100 μm. (L) Statistical analysis of Nile Red fluorescence intensity. “n” represents the cell number used in this experiment. All experiments were performed in triplicate and the data were represented as mean ± SEM. ns = non significance, *, P < 0.05, **, P < 0.01, ***, P < 0.001. Different superscripts within columns indicate significant differences (P < 0.05).
FIGURE 6
FIGURE 6
PCB2 promotes mitochondrial uncoupling via PPARγ activation. (A) Representative images of MII oocytes stained with PPARγ. Scale bar, 20 μm. (B) Statistical analysis of PPARγ fluorescence intensity. (C) Representative images of predicted binding conformation of PCB2 with PPARγ model. Yellow dotted line represents hydrogen bonds. (D) Representative images of MII oocytes stained with TMRM, MTY, Nile red, and UCP1. Scale bar, 50 μm. (E) Statistical analysis of Nile red fluorescence intensity. (F) Statistical analysis of UCP1 fluorescence intensity. (G) Statistical analysis of ATP content level. (H) Statistical analysis of TMRM fluorescence intensity. (I) Statistical analysis of MTY fluorescence intensity. “n” represents the cell number used in this experiment. All experiments were performed in triplicate and the data were represented as mean ± SEM. ns = non significance, *, P < 0.05, **, P < 0.01, ***, P < 0.001. Different superscripts within columns indicate significant differences (P < 0.05).
FIGURE 7
FIGURE 7
PCB2 exerts protective functions via PPARγ activation. (A) Representative images of early embryos derived from in vitro fertilized oocytes. Scale bar, 100 μm. (B) Representative images of MII oocytes stained with ROS and GSH. Scale bar, 50 μm. (C) Statistical analysis of ROS fluorescence intensity. (D) Statistical analysis of GSH fluorescence intensity. (E) Statistical analysis of relative expression levels of SOD2, GPX1, and CAT in MII oocyte. All experiments were performed in triplicate and the data were represented as mean ± SEM. Different superscripts within columns indicate significant differences (P < 0.05).

Similar articles

References

    1. Jiang X, Pang Y, Zhao S, et al. Thioredoxin‐interacting protein regulates glucose metabolism and improves the intracellular redox state in bovine oocytes during in vitro maturation. Am J Physiol Endocrinol Metab. 2020;318(3):E405‐E416. doi:10.1152/ajpendo.00057.2019 - DOI - PubMed
    1. Khan R, Jiang X, Hameed U, Shi Q. Role of lipid metabolism and signaling in mammalian oocyte maturation, quality, and acquisition of competence. Front Cell Dev Biol. 2021;9:639704. doi:10.3389/fcell.2021.639704 - DOI - PMC - PubMed
    1. Dunning KR, Russell DL, Robker RL. Lipids and oocyte developmental competence: the role of fatty acids and β‐oxidation. Reproduction. 2014;148(1):R15‐R27. doi:10.1530/rep-13-0251 - DOI - PubMed
    1. de Andrade M‐SF, Poehland R. Lipid metabolism in bovine oocytes and early embryos under in vivo, in vitro, and stress conditions. Int J Mol Sci. 2021;22(7):3421. doi:10.3390/ijms22073421 - DOI - PMC - PubMed
    1. Del Collado M, Saraiva NZ, Lopes FL, et al. Influence of bovine serum albumin and fetal bovine serum supplementation during in vitro maturation on lipid and mitochondrial behaviour in oocytes and lipid accumulation in bovine embryos. Reprod Fertil Dev. 2015;28(11):1721‐1732. doi:10.1071/RD15067 - DOI - PubMed