. 2024 Jul 8;31(9):e230061.
doi: 10.1530/ERC-23-0061. Print 2024 Sep 1.

Genetic variants and down-regulation of CACNA1H in pheochromocytoma

Affiliations

Genetic variants and down-regulation of CACNA1H in pheochromocytoma

Fredrika Svahn et al. Endocr Relat Cancer. .

Abstract

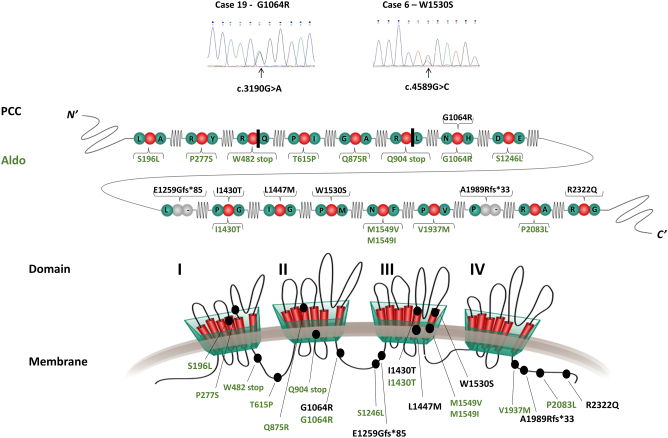
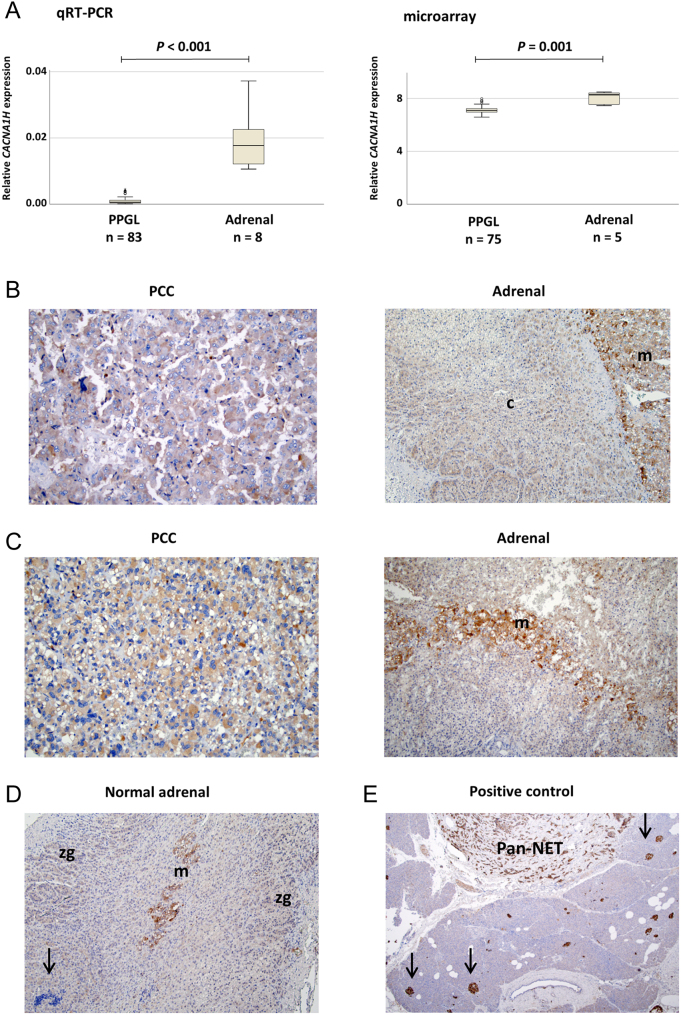
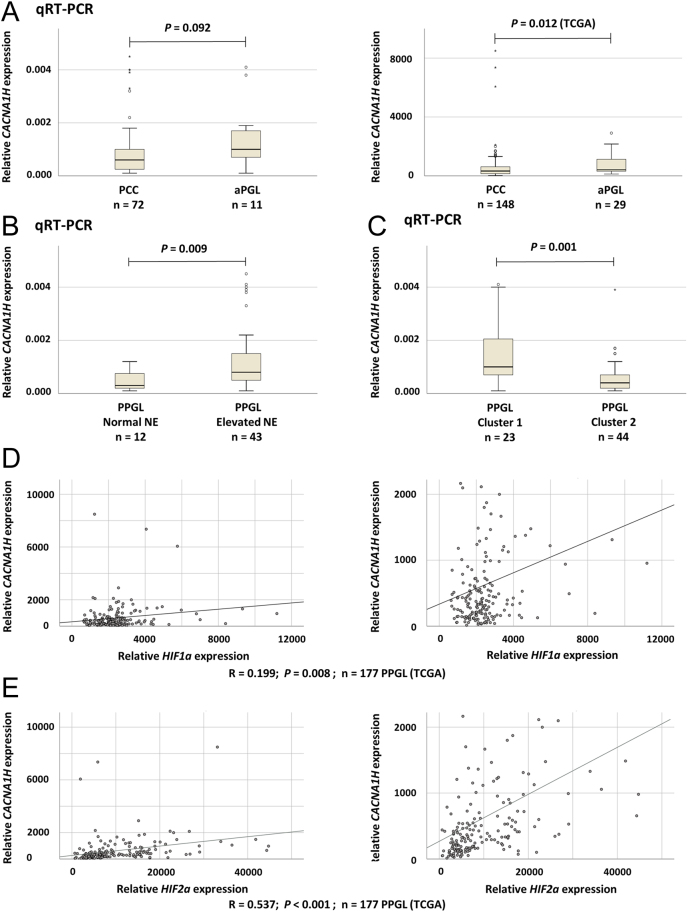
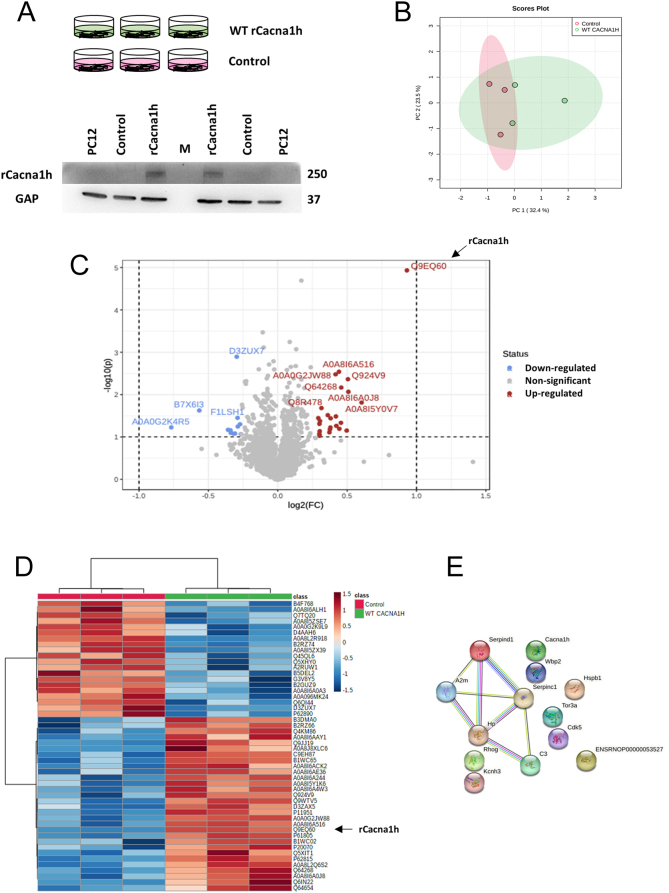
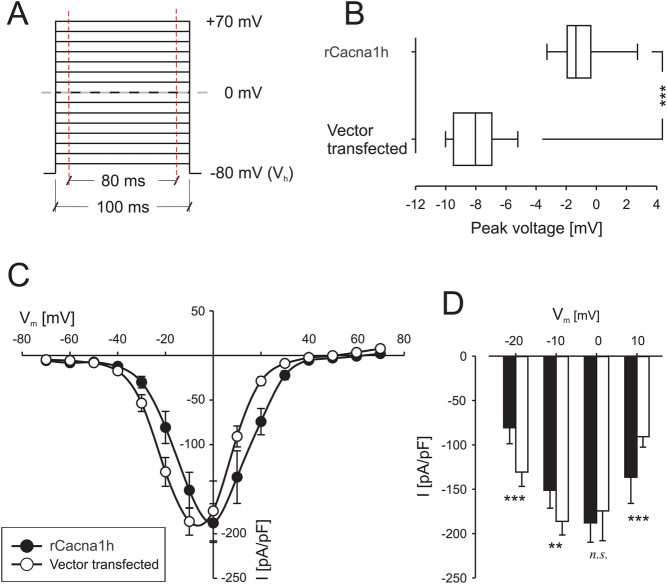
Pheochromocytoma (PCC) and abdominal paraganglioma (aPGL) (together abbreviated PPGL) frequently present with an underlying genetic event in a PPGL driver gene, and additional susceptibility genes are anticipated. Here, we re-analyzed whole-exome sequencing data for PCC patients and identified two patients with rare missense variants in the calcium voltage-gated channel subunit 1H gene (CACNA1H). CACNA1H variants were also found in the clinical setting in PCC patients using targeted sequencing and from analysis of The Cancer Genome Atlas database. In total, CACNA1H variants were found in six PCC cases. Three of these were constitutional, and two are known to have functional consequences on hormone production and gene expression in primary aldosteronism and aldosterone-producing adrenocortical adenoma. In general, PPGL exhibited reduced CACNA1H mRNA expression as compared to normal adrenal. Immunohistochemistry showed strong CACNA1H (CaV3.2) staining in adrenal medulla while PPGL typically had weak or negative staining. Reduced CACNA1H gene expression was especially pronounced in PCC compared to aPGL and in PPGL with cluster 2 kinase signaling phenotype. Furthermore, CACNA1H levels correlated with HIF1A and HIF2A. Moreover, TCGA data revealed a correlation between CACNA1H methylation density and gene expression. Expression of rCacna1h in PC12 cells induced differential protein expression profiles, determined by mass spectrometry, as well as a shift in the membrane potential where maximum calcium currents were observed, as determined by electrophysiology. The findings suggest the involvement of CACNA1H/CaV3.2 in pheochromocytoma development and establish a potential link between the etiology of adrenomedullary and adrenocortical tumor development.

Keywords: CACNA1H; calcium channel; paraganglioma; pheochromocytoma.


Conflict of interest statement

The authors declare that there is no conflict of interest that could be perceived as prejudicing the impartiality of the research reported.

Figures

Figure 1
Figure 1
The CACNA1H protein and detected variants. Top: sequencing chromatograms from Sanger sequencing showing CACNA1H variants in tumor tissue from three PCC cases with the same variants identified in constitutional tissue (Table 1). Middle: schematic illustration of protein alterations predicted from variants detected in pheochromocytoma (PCC, black) and previously reported in primary hyperaldosteronism/aldosterone-producing adrenocortical adenoma (Aldo, green). Bottom: location of PCC and Aldo variants (black ovals) in the CACNA1H protein complex consisting of four domains (I−IV) each with six individual segments (red bars).
Figure 2
Figure 2
Comparison of CACNA1H expression in PPGL and adrenal tissues. (A) Relative mRNA expression of CACNA1H determined by qRT-PCR (left) and from microarray data (right) in pheochromocytoma/abdominal paraganglioma (PPGL) from the Karolinska cohort and in adrenal references. (B) Immunohistochemical analysis of CACNA1H protein expression in case 66. The PCC shows weak staining (+) at ×200 magnification. Non-tumorous adrenal tissue from the same case shows strong staining (++) in medulla (m) and weak staining (+) in cortex (c) at ×100. (C) Case 71 showing weak (+) CACNA1H expression in PCC tissue (at ×200) and strong staining (++) in medulla (at ×100). (D) Positive CACNA1H staining in adrenal tissue from a patient with non-PPGL disease at ×100 magnification. Strong expression (++) is noted in the medulla (m), while the zona glomerulosa of the cortex (zg) has weak expression (+). Negative lymphocytes are indicated (arrow). (E) Positive control showing strong CACNA1H expression (++) in a pancreatic neuroendocrine tumor (Pan-NET) and negative staining (−) in exocrine pancreas negative control at ×40 magnification. Arrows indicate positively stained Langerhans islets.
Figure 3
Figure 3
Comparison of CACNA1H gene expression, CACNA1H methylation density, and global hypermethylation phenotype using TCGA data. (A) Scatter plots showing the correlation between the mean methylation density of 187 CG sites covering the CACNA1H locus and CACNA1H mRNA expression. An enlargement, without outliers with very high expression, is shown to the right. (B) Comparison of CACNA1H mRNA expression levels between PPGL M1 tumors (global hypermethylated phenotype) compared to non-M1 tumors (intermediate and low methylation). Enlargement without outliers to the right. (C) Schematic illustration of the CACNA1H gene locus with indication of promoter region and ATG site according to Ensembl (https://www.ensembl.org). The graph above illustrates R-values for significant correlations with P-value < 0.01 between CACNA1H methylation and mRNA expression at the 187 CG sites. Below is shown mean methylation for 177 PPGL at the individual CG sites.
Figure 4
Figure 4
Comparison of CACNA1H mRNA expression with tumor type, norepinephrine (NE) secretion, and cluster 1 or 2 phenotype. (A) Relative CACNA1H mRNA expression in PCC and aPGL determined by qRT-PCR in the Karolinska cohort (left) and based on data from the TCGA database (right). (B) CACNA1H mRNA expression in PPGL of the Karolinska cohort with elevated or normal levels of NE. (C) CACNA1H mRNA expression in PPGL of the Karolinska cohort with cluster 1 (pseudo-hypoxia) or cluster 2 (kinase signaling) expression phenotype. (D) Correlation analysis between CACNA1H and HIF1A mRNA expression based on data from the TCGA database. An enlargement, without outliers with very high expression, is shown to the right. (E) Correlation analysis between CACNA1H and EPAS1 (HIF2A) mRNA expression based on data from the TCGA database. An enlargement, without outliers with very high expression, is shown to the right.
Figure 5
Figure 5
Identification of differentially expressed proteins in rat Cacna1h transfected PC12 cells. (A) PC12 rat pheochromocytoma cells were transfected in triplicate with plasmids carrying wild-type rCacna1h (WT rCacna1h) (pRP[Exp]-CAG>rCacna1h[NM_153814.2]) and vector control (control) (pRP[Exp]-CAG>Stuffer_300bp), respectively. The immunoblot below shows protein expression analysis of rCacna1h in transfected, control, and untransfected PC12 cells. GAPDH was used as a loading control. (B) Scores plot from principal component analysis (PCA) of proteomic data obtained for the six samples shown in A. (C) Proteins selected by Volcano plot of differentially expressed proteins between rCacna1h transfected and control cells. A fold-change threshold of 1.2 (x) and t-test threshold of 0.1 (y) were applied. Red circles represent proteins above the threshold. Fold changes and P-values were log-transformed. (D) Clustering of up- and down-regulated proteins illustrated as a heatmap. (E) Identification of pathways enriched for up-regulated proteins using STRING analysis.
Figure 6
Figure 6
Patch-clamp experiments on rCacna1h-transfected PC12 cells. (A) Cells were voltage-clamped at −80 mV and subsequently depolarized in 10 mV incremental steps to +80 mV. Each depolarization step lasted 100 ms, and the mean current was measured omitting the first and last 10 ms of the depolarization indicated by the red lines. (B) The peak voltage was calculated by fitting each current–voltage (IV) graph (summary presented in C) to a multi-variable regression model. (C) IV curves for PC12 cells, controls (open circles), and rCacna1h-transfected (closed circles). (D) A summary of inward currents at −20, −10, 0, and 10 mV. Vector-transfected control PC12 cells (open bars) and rCacna1h-transfected (closed bars). Cells were randomly selected in the petri dishes in each group. **P < 0.01, ***P < 0.001, n.s., not significant.

Similar articles

Cited by

References

    1. Adzhubei IA Schmidt S Peshkin L Ramensky VE Gerasimova A Bork P Kondrashov AS & Sunyaev SR. 2010A method and server for predicting damaging missense mutations. Nature Methods 7248–249. (10.1038/nmeth0410-248) - DOI - PMC - PubMed
    1. Buffet A Burnichon N Favier J & Gimenez-Roqueplo AP. 2020An overview of 20 years of genetic studies in pheochromocytoma and paraganglioma. Best Practice and Research 34101416. (10.1016/j.beem.2020.101416) - DOI - PubMed
    1. Clay MR, Pinto EM, Cline C, Tran QT, Lin T, Dyer MA, Shi L, Wu H, Pounds SB, Zambetti GP, et al.2019DNA methylation profiling reveals prognostically significant groups in pediatric adrenocortical tumors: a report from the international pediatric adrenocortical tumor registry. JCO Precision Oncology 3. (10.1200/PO.19.00163) - DOI - PMC - PubMed
    1. Daniil G, Fernandes-Rosa FL, Chemin J, Blesneac I, Beltrand J, Polak M, Jeunemaitre X, Boulkroun S, Amar L, Strom TM, et al.2016CACNA1H mutations are associated with different forms of primary aldosteronism. EBiomedicine 13225–236. (10.1016/j.ebiom.2016.10.002) - DOI - PMC - PubMed
    1. Eisenhofer G, Pacak K, Huynh TT, Qin N, Bratslavsky G, Linehan WM, Mannelli M, Friberg P, Grebe SK, Timmers HJ, et al.2011Catecholamine metabolomic and secretory phenotypes in pheochromocytoma. Endocrine-Related Cancer 1897–111. (10.1677/ERC-10-0211) - DOI - PMC - PubMed

Substances