. 2024 Jun;28(11):e18392.
doi: 10.1111/jcmm.18392.

Comprehensive analysis of lncRNA-associated ceRNA network reveals novel potential prognostic regulatory axes in glioblastoma multiforme

Affiliations

Comprehensive analysis of lncRNA-associated ceRNA network reveals novel potential prognostic regulatory axes in glioblastoma multiforme

Maryam Bazrgar et al. J Cell Mol Med. 2024 Jun.

Abstract

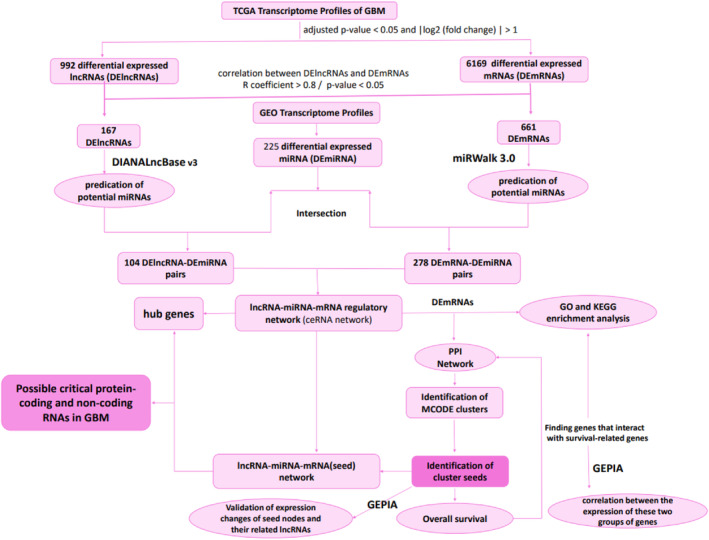
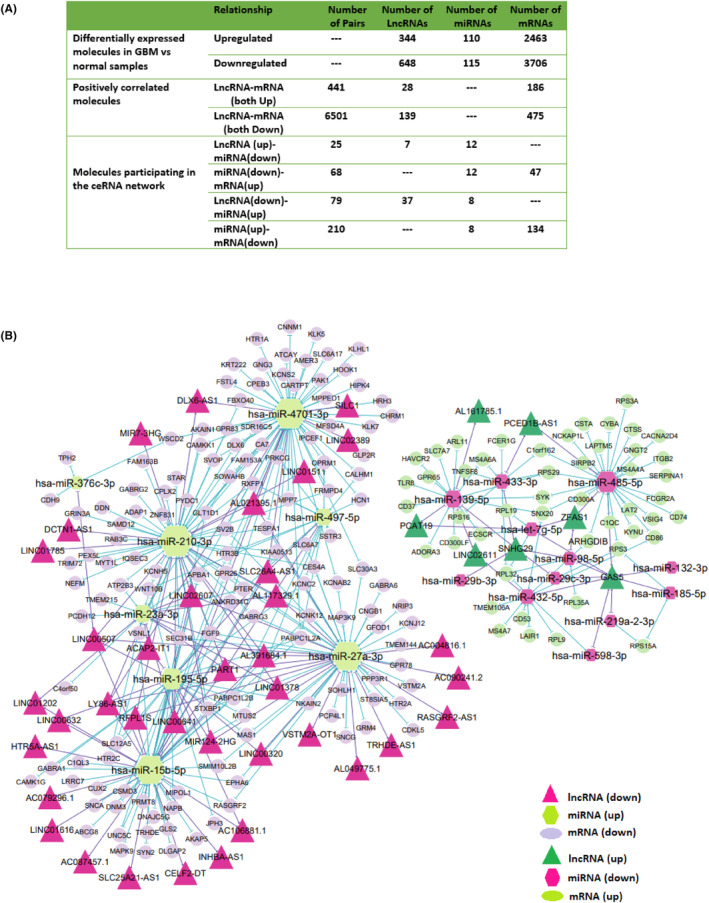
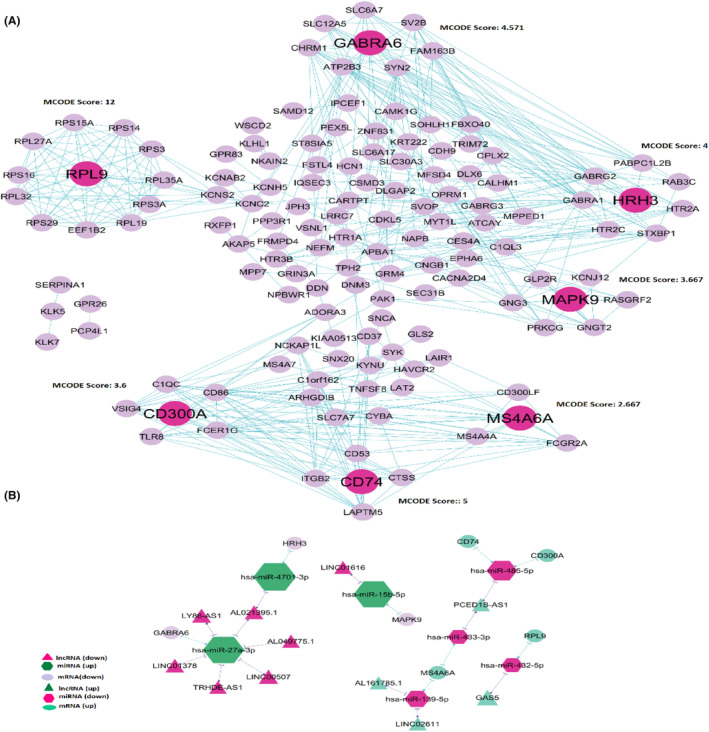
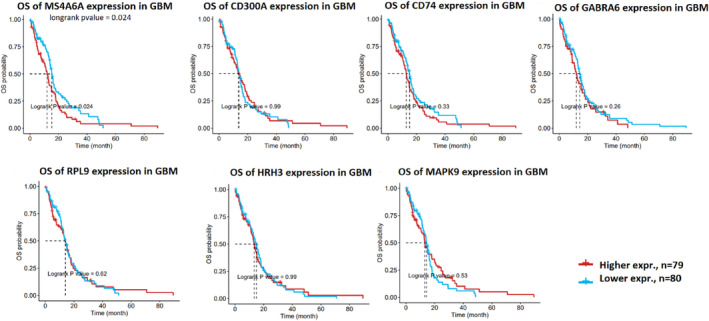
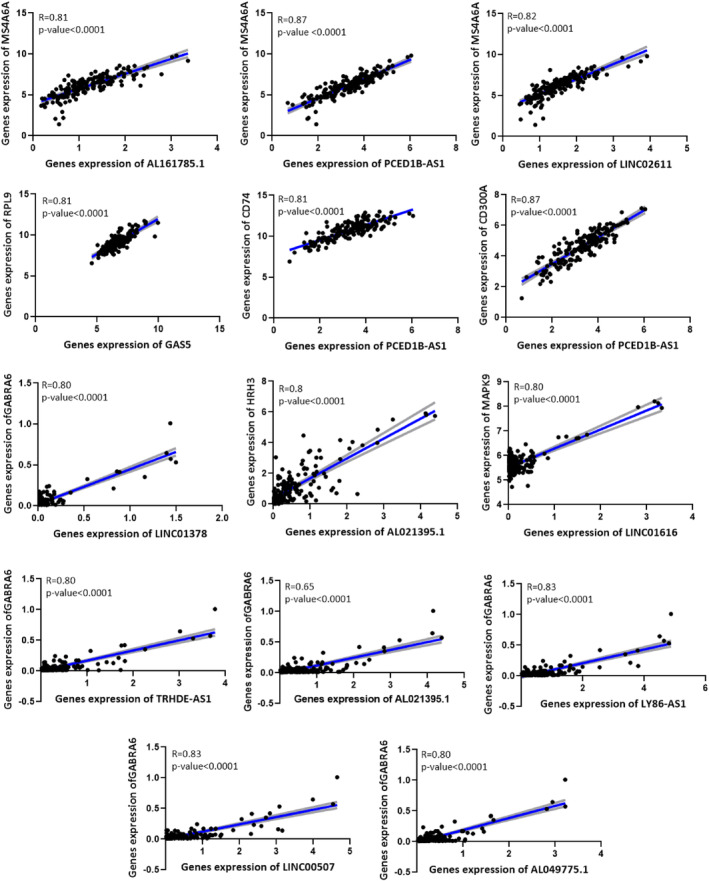
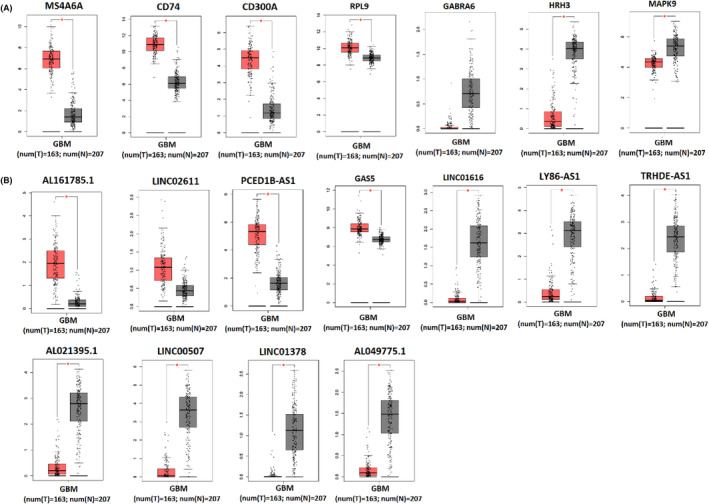
Deciphering the lncRNA-associated competitive endogenous RNA (ceRNA) network is essential in decoding glioblastoma multiforme (GBM) pathogenesis by regulating miRNA availability and controlling mRNA stability. This study aimed to explore novel biomarkers for GBM by constructing a lncRNA-miRNA-mRNA network. A ceRNA network in GBM was constructed using lncRNA, mRNA and miRNA expression profiles from the TCGA and GEO datasets. Seed nodes were identified by protein-protein interaction (PPI) network analysis of deregulated-mRNAs (DEmRNAs) in the ceRNA network. A lncRNA-miRNA-seed network was constructed by mapping the seed nodes into the preliminary ceRNA network. The impact of the seed nodes on the overall survival (OS) of patients was assessed by the GSCA database. Functional enrichment analysis of the deregulated-lncRNAs (DElncRNA) in the ceRNA network and genes interacting with OS-related genes in the PPI network were performed. Finally, the positive correlation between seed nodes and their associated lncRNAs and the expression level of these molecules in GBM tissue compared with normal samples was validated using the GEPIA database. Our analyzes revealed that three novel regulatory axes AL161785.1/miR-139-5p/MS4A6A, LINC02611/miR-139-5p/MS4A6A and PCED1B-AS1/miR-433-3p/MS4A6A may play essential roles in GBM pathogenesis. MS4A6A is upregulated in GBM and closely associated with shorter survival time of patients. We also identified that MS4A6A expression positively correlates with genes related to tumour-associated macrophages, which induce macrophage infiltration and immune suppression. The functional enrichment analysis demonstrated that DElncRNAs are mainly involved in neuroactive ligand-receptor interaction, calcium/MAPK signalling pathway, ribosome, GABAergic/Serotonergic/Glutamatergic synapse and immune system process. In addition, genes related to MS4A6A contribute to immune and inflammatory-related biological processes. Our findings provide novel insights to understand the ceRNA regulation in GBM and identify novel prognostic biomarkers or therapeutic targets.

Keywords: AL161785.1; LINC02611; MS4A6A; PCED1B‐AS1; glioblastoma multiforme; miR‐139‐5p; miR‐433‐3p.


Conflict of interest statement

The authors declare that they have no conflict of interest.

Figures

FIGURE 1
FIGURE 1
Workflow of the construction of lncRNA‐associated ceRNA network. ceRNA, competitive endogenous RNA; DE, differentially expressed; GEO, Gene Expression Omnibus; GEPIA, Gene Expression Profiling Interactive Analysis; GO, Gene Ontology; KEGG, Kyoto Encyclopedia of Genes and Genomes; lncRNA, long non‐coding RNAs; miRNA, microRNA; PPI, protein–protein interaction network; TCGA, The Cancer Genome Atlas.
FIGURE 2
FIGURE 2
Data quality assessment and identification of differentially expressed genes (DEG). (A) Boxplot of intensity distributions in the normalized RNAseq data. The relative lncRNA and mRNA expression values are comparable among all 174 samples after normalization. (B) Boxplot for the normalized microarray data of microRNA expression profiles. Each box represents a sample. (C) Volcano plot of DElncRNAs and DEmRNAs, (D) Volcano plot of DEmiRNA in Glioblastoma Multiforme.
FIGURE 3
FIGURE 3
Heatmap of differentially expressed lncRNAs (A) and mRNAs (B) in Glioblastoma Multiforme that were correlated. The horizontal axis shows the names of 174 samples. The vertical axis presents the gene names.
FIGURE 4
FIGURE 4
The lncRNA‐associated ceRNA network. (A) The number of relationships and pairs among lncRNAs, miRNAs, and mRNAs in the ceRNA network and the number of differentially expressed molecules and correlated molecules. (B)The ceRNA network was constructed based on identified lncRNA–miRNA and miRNA–mRNA interactions. The networks include down/upregulated lncRNAs, up/downregulated miRNAs, and lower/overexpressed mRNAs in Glioblastoma Multiforme. All node sizes were represented by degree.
FIGURE 5
FIGURE 5
(A) protein–protein interaction network of DE‐mRNAs in lncRNAs‐miRNAs‐mRNAs network. Seven clusters were identified by the MCODE algorithm represented in the PPI network. The seed nodes in each cluster are shown in pink. (B) lncRNA‐miRNA‐seed network. This network consisted of 11 lncRNAs, seven miRNAs, and seven mRNAs.
FIGURE 6
FIGURE 6
Overall survival (OS) of the seven seed genes (MS4A6A, CD300A CD74, GABRA6, RPL9, HRH3, and MAPK9) from GSCA. GSCA, Gene Set Cancer Analysis.
FIGURE 7
FIGURE 7
Positive correlation between 12 genes expression (CD86, C1QC, C1orf162, CTSS, FCER1G, FCGR2A, LAPTM5, MS4A7, SLC7A7, VSIG4, TLR8, and MS4A4A) and MS4A6A expression. The connecting line is shown in blue, and error bars are shown in grey.
FIGURE 8
FIGURE 8
Positive correlation between seed nodes and their related lncRNAs. The connecting line is shown in blue, and the error bars are shown in grey.
FIGURE 9
FIGURE 9
Validation of expression changes of seed nodes and their related lncRNAs in GBM tissue. (A) It represents up/downregulated mRNAs in biopsies of patients with GBM (T) (red box) compared to normal tissue (N) (grey box), including MS4A6A, CD74, CD300A, RPL9, GABRA6, HRH3, and MAPK9. (B) It shows up/downregulated lncRNAs in biopsies of patients with GBM (T) (red box) compared with normal tissue (N) (grey box), including AL161785.1, LINC02611, PCED1B‐AS1, GAS5, LINC01616, LY86‐AS1, TRHDE‐AS1, AL021395.1, LINC00507, LINC01378, AL049775.1. Data were obtained from the TCGA and GTEx datasets. *p < 0.01. Expression was log2 transformed (TPM + 1).
FIGURE 10
FIGURE 10
Validation of expression changes of hub genes at the protein level in GBM tissue using the CPTAC database.

Similar articles

Cited by

References

    1. Erices JI, Bizama C, Niechi I, et al. Glioblastoma microenvironment and invasiveness: new insights and therapeutic targets. Int J Mol Sci. 2023;24:7047. - PMC - PubMed
    1. Burko P, D'Amico G, Miltykh I, et al. Molecular pathways implicated in radioresistance of glioblastoma multiforme: what is the role of extracellular vesicles? Int J Mol Sci. 2023;24:4883. - PMC - PubMed
    1. Chen Q, Cai J, Wang Q, et al. Long noncoding RNA NEAT1, regulated by the EGFR pathway, contributes to glioblastoma progression through the WNT/β‐catenin pathway by scaffolding EZH2Oncogenic function of NEAT1 in glioblastoma. Clin Cancer Res. 2018;24:684‐695. - PubMed
    1. Louis DN, Perry A, Wesseling P, et al. The 2021 WHO classification of tumors of the central nervous system: a summary. Neuro Oncol. 2021;23:1231‐1251. - PMC - PubMed
    1. Hoang T, Wang J, Boyd P, et al. Gene regulatory networks controlling vertebrate retinal regeneration. Science. 2020;370:eabb8598. - PMC - PubMed

MeSH terms

LinkOut - more resources