. 2024 Jul;33(7):e5064.
doi: 10.1002/pro.5064.

Kinetic and dynamical properties of truncated hemoglobins of the Antarctic bacterium Pseudoalteromonas haloplanktis TAC125

Affiliations

Kinetic and dynamical properties of truncated hemoglobins of the Antarctic bacterium Pseudoalteromonas haloplanktis TAC125

Diego Javier Alonso de Armiño et al. Protein Sci. 2024 Jul.

Abstract

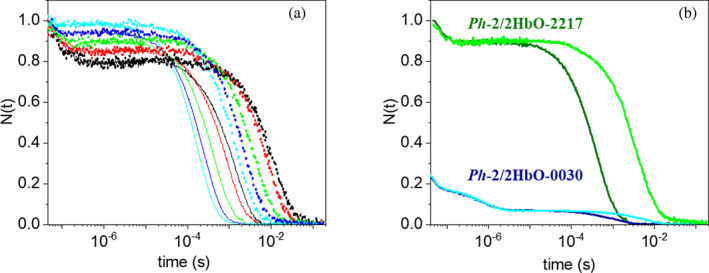
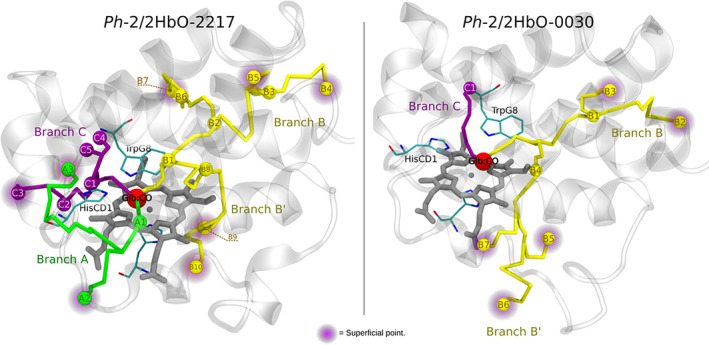
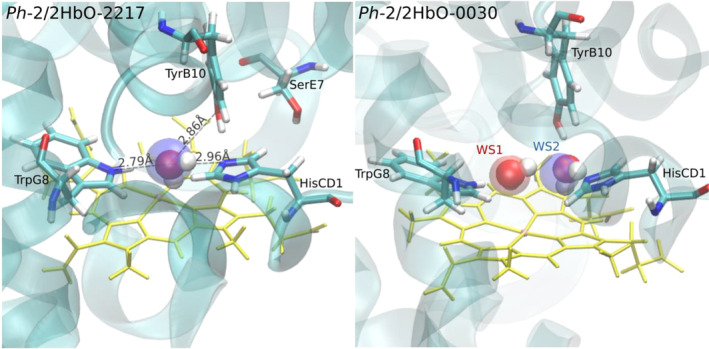
Due to the low temperature, the Antarctic marine environment is challenging for protein functioning. Cold-adapted organisms have evolved proteins endowed with higher flexibility and lower stability in comparison to their thermophilic homologs, resulting in enhanced reaction rates at low temperatures. The Antarctic bacterium Pseudoalteromonas haloplanktis TAC125 (PhTAC125) genome is one of the few examples of coexistence of multiple hemoglobin genes encoding, among others, two constitutively transcribed 2/2 hemoglobins (2/2Hbs), also named truncated Hbs (TrHbs), belonging to the Group II (or O), annotated as PSHAa0030 and PSHAa2217. In this work, we describe the ligand binding kinetics and their interrelationship with the dynamical properties of globin Ph-2/2HbO-2217 by combining experimental and computational approaches and implementing a new computational method to retrieve information from molecular dynamic trajectories. We show that our approach allows us to identify docking sites within the protein matrix that are potentially able to transiently accommodate ligands and migration pathways connecting them. Consistently with ligand rebinding studies, our modeling suggests that the distal heme pocket is connected to the solvent through a low energy barrier, while inner cavities play only a minor role in modulating rebinding kinetics.

Keywords: CO rebinding kinetics; bacterial globin; cold adaptation; molecular dynamic simulations; oxidative/nitrosative stress.


Figures

FIGURE 1
FIGURE 1
CO rebinding kinetics after nanosecond laser‐flash photolysis. (a) CO rebinding kinetics after nanosecond laser‐flash photolysis of Ph‐2/2HbO‐2217 solutions at 1 atm CO (solid lines) and 0.1 atm CO (dotted lines) at 5°C (black), 10°C (red), 20°C (green), 30°C (blue), and 40°C (cyan). Data are reported as the time evolution of the fraction of deoxy molecules, N(t). The absorbance change was monitored at 436 nm, following laser photolysis at 532 nm. (b) Comparison between CO rebinding kinetics in Ph‐2/2HbO‐0030 (1 atm, blue line; 0.1 atm, cyan line) and Ph‐2/2HbO‐2217 (1 atm CO, dark green line; 0.1 atm CO, light green line) at T = 20°C.
FIGURE 2
FIGURE 2
Analysis of CO rebinding kinetics as a function of the temperature using a maximum entropy method. (a) Lifetime distributions at 5°C for Ph‐2/2HbO‐2217 solutions at 1 atm CO (solid lines) and 0.1 atm CO (dotted lines). τ is expressed in s. (b) Dependence on temperature of lifetime distribution at 1 atm CO: 5°C (black), 10°C (red), 20°C (green), 30°C (blue), and 40°C (cyan). (c) Arrhenius plot for the bimolecular binding rate constant (k on) derived from the distributions shown in (b), using the same color code.
FIGURE 3
FIGURE 3
Singular value decomposition (SVD) Analysis of transient absorption spectra. (a) Comparison between the first U 1 (black line) and the second spectral component U 2 (blue line), retrieved from the SVD analysis of transient spectra and multiplied by the associated singular values S i . CO = 0.1 atm and T = 20°C. (b) Comparison between time evolution of amplitudes V 1 (closed circles), V 2 (open circles) at 1 (red) and 0.1 CO atm (black). The green line in (b) is the CO rebinding kinetics measured at 436 nm at CO = 0.1 atm and T = 20°C. Solid lines superimposed to the amplitudes V 1 and V 2 are the result of a fitting using a sum of three exponential decay functions.
FIGURE 4
FIGURE 4
Structural model of Ph‐2/2HbO‐2217. (a) In silico model for the pentacoordinated Ph‐2/2HbO‐2217, as constructed in this work, where heme group and critical residues interacting with it are highlighted in licorice representation. Typical helices found in TrHbs are colored (see scheme in Figure S1). (b) Root‐mean‐squared deviations for the molecular dynamics simulation productions of Ph‐2/2HbO‐2217 at three different temperatures, as stated in the legend, computed for the backbone heavy atoms C, CA, N, and O. (c) Root‐mean‐squared fluctuations for residues during the whole simulation production at each temperature.
FIGURE 5
FIGURE 5
Comparison between results from implicit ligand sampling, showing ligand interaction sites (LIS) and ligand migration paths (LMPs) analysis for Ph‐2/2HbO‐2217 and Ph‐2/2HbO‐0030. Relevant LIS (spheres) and LMPs (cylinders) are shown alongside the heme group (gray licorice) and selected amino acid residues of the distal cavity for context (TrpG8 and HisCD1), for Ph‐2/2HbO‐2217 (left panel) and Ph‐2/2HbO‐0030 (right panel). LMPs form a complex interconnected hub with the site labeled Glb:CO (red sphere) at the center. Glb:CO is the closest LIS to the ligand‐Fe binding site, GlbCO (not shown in the picture), which is the carboxy form of the protein. The backbone of the protein is shown as ghostly ribbons. Superficial LISs are highlighted by a gray and purple halo. Left panel: In the case of Ph‐2/2HbO‐2217 the center of the hub has three main branches which connect it to the exterior of the protein called A (green), B (yellow), and C (purple). Branch B is additionally divided in two: Branch B, which explores a cavity between alpha helices A, B, G, E, and H, and Branch B′, which encircles the interstice between the heme group and the protein in the direction from distal to proximal heme cavity. Right panel: In the case of Ph‐2/2HbO‐0030 the center of the hub has only two main branches, which we name (in analogy to Ph‐2/2HbO‐2217) Branches B and C, with Branch B having a similar bifurcation into B and B′. In both panels, relevant minima (spheres) are given labels according to their corresponding branch. Branches A (green), B (yellow), and C (magenta) are colored differently for visualization purposes.
SCHEME 1
SCHEME 1
Minimal kinetic scheme for events following CO photodissociation from the complex with Ph‐2/2HbO‐2217 (GlbCO). Glb:CO represents the state where the photo‐dissociated CO molecule is in the primary docking site, very close to the binding site. From this position, it can rebind the heme iron (rate k −1), migrate to a secondary docking site, that is an off‐pathway kinetic trap (Tr2), with rate k d (reverse rate k d ), or exit to the solvent with rate k out, forming the deoxy species (Glb). Finally, CO molecules are rebound from the solvent with rate k in.
FIGURE 6
FIGURE 6
Free energy profiles for implicit ligand sampling (LIS) and ligand migration path analysis (LMPs) for Ph‐2/2HbO‐2217. Free energy profiles for LMPs and LISs of Ph‐2/2HbO‐2217 for each of the four branches are shown. The labeling scheme is the same as in Figure 5. The horizontal axis is the index number of points composing LMPs (not actual distance), and therefore, these axis labels are not shown, while the vertical axis is free energy in kT units (T = 283 K). LISs with a dark halo are superficial.
FIGURE 7
FIGURE 7
Water site analysis using GKDE/GridAnalyzer. Spheres represent water interaction sites (WIS). Distal cavity WISs are labeled W1–W5 for Ph‐2/2HbO‐2217 and W1–W2 for Ph‐2/2HbO‐0030. The color is given by its probability, with red for high probability, blue for low, and white in the middle. Water migration paths are represented by cylinders. Only high‐probability pathways are measured, as those are the only ones that reasonably converge. The figure shows a noticeable difference in hydration between Ph‐2/2HbO‐2217 and Ph‐2/2HbO‐0030. Superficial sites are highlighted by a gray halo.
FIGURE 8
FIGURE 8
WatClust analysis results. Left panel: Ph‐2/2HbO‐2217. Right panel: Ph‐2/2HbO‐0030. Water sites are shown as colored transparent spheres, alongside a representative water molecule in VDW representation for context. Water site mean positions as defined by the solvation analysis performed by WatClust plotted over a representative frame from the simulation trajectory. Residence times for water molecules visiting the WSs are presented in Supporting Information Material (Table S1).
FIGURE 9
FIGURE 9
Global analysis of V 1 amplitudes using the kinetic model derived from the MD simulations results. Analysis of the time course of the amplitude V 1 at 1 (red closed circles) and 0.1 atm CO (black closed circles), for a solution at 34 μM and T = 20°C, using the kinetic model in Scheme 1. In the figure, the fitting curve is reported (yellow line), in addition to the molecular species reported in Scheme 1, using the same color code: Glb:CO (red), Tr2 (cyan), and Glb (green).
FIGURE 10
FIGURE 10
Comparison between CO probability distribution over the distal cavity in Ph‐2/2HbO‐2217 and Ph‐2/2HbO‐0030. View of the distal cavity of Ph‐2/2HbO‐0030 (right) and Ph‐2/2HbO‐2217 (left) showing relevant LISs and LMPs, as well as free energy isosurfaces showing the differences in CO probability distribution over the distal cavity of both proteins. The color scheme of LISs and LMPs indicates free energy value: red is low and blue is high.

Similar articles

References

    1. Abbruzzetti S, Barker AJ, Villar I, Pérez‐Rontomé C, Bruno S, Cerullo G, et al. Unusually fast bis‐histidyl coordination in a plant hemoglobin. Int J Mol Sci. 2021;22:2740. 10.3390/ijms22052740 - DOI - PMC - PubMed
    1. Abbruzzetti S, Faggiano S, Bruno S, Spyrakis F, Mozzarelli A, Dewilde S, et al. Ligand migration through the internal hydrophobic cavities in human neuroglobin. Proc Natl Acad Sci U S A. 2009;106:18984–18989. - PMC - PubMed
    1. Abbruzzetti S, Grandi E, Bruno S, Faggiano S, Spyrakis F, Mozzarelli A, et al. Ligand migration in nonsymbiotic hemoglobin AHb1 from Arabidopsis thaliana . J Phys Chem B. 2007;111:12582–12590. - PubMed
    1. Abbruzzetti S, He C, Ogata H, Bruno S, Viappiani C, Knipp M. Heterogeneous kinetics of the carbon monoxide association and dissociation reaction to nitrophorin 4 and 7 coincide with structural heterogeneity of the gate‐loop. J Am Chem Soc. 2012;134:9986–9998. - PubMed
    1. Abbruzzetti S, Tilleman L, Bruno S, Viappiani C, Desmet F, van Doorslaer S, et al. Ligation tunes protein reactivity in an ancient haemoglobin: kinetic evidence for an allosteric mechanism in Methanosarcina acetivorans protoglobin. PLoS One. 2012;7:e33614. - PMC - PubMed

MeSH terms

LinkOut - more resources