. 2024 Jun 3;65(6):20.
doi: 10.1167/iovs.65.6.20.

A Novel Murine Model for Lupus-Like Ocular Chronic Graft-Versus-Host Disease

Affiliations

A Novel Murine Model for Lupus-Like Ocular Chronic Graft-Versus-Host Disease

Yan Sun et al. Invest Ophthalmol Vis Sci. .

Abstract

Purpose: Lupus-like chronic graft-versus-host disease (cGVHD) has been previously described, but the ocular findings have not been elucidated. Recipient mice in a lupus-like cGVHD model manifested notable and persistent ocular surface phenotypes. Herein, we further explored immunopathogenic mechanisms underlying these ocular phenotypes.

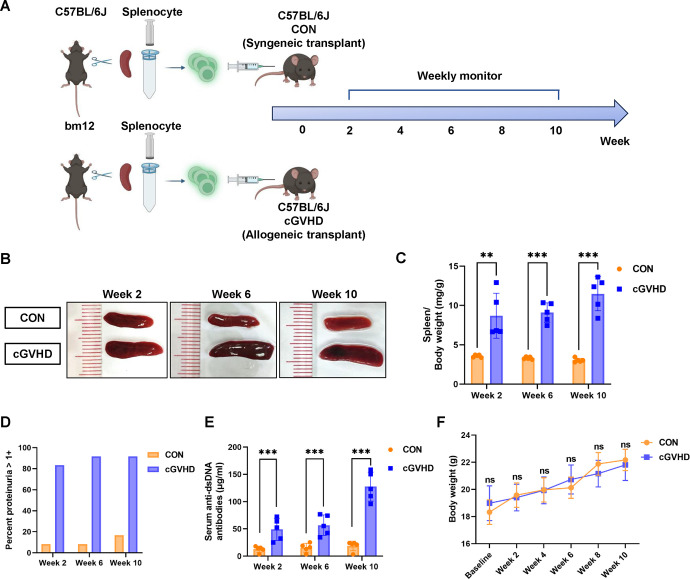
Methods: A previously described lupus-like cGVHD model was established by intraperitoneal injection of splenocytes from bm12 mice into C57BL/6J mice. Systemic findings were evaluated for the presence of splenomegaly, proteinuria, and autoantibodies. Comprehensive evaluations were conducted on ocular manifestations and immunopathological features in this model.

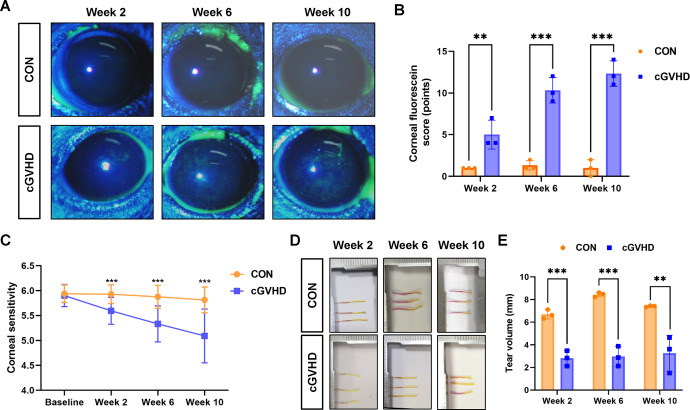
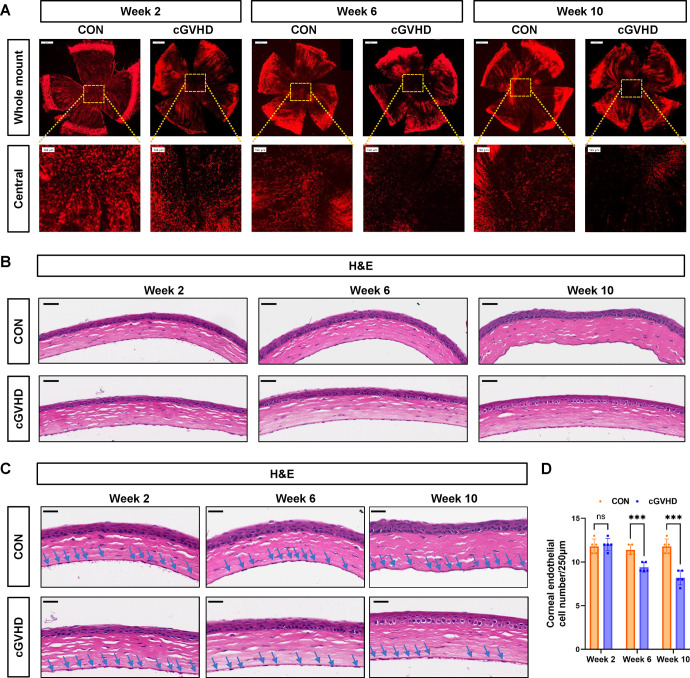
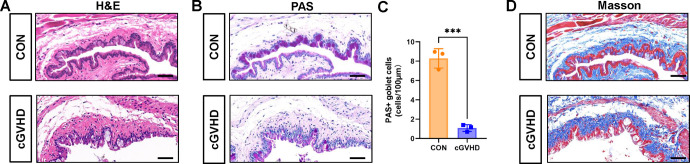
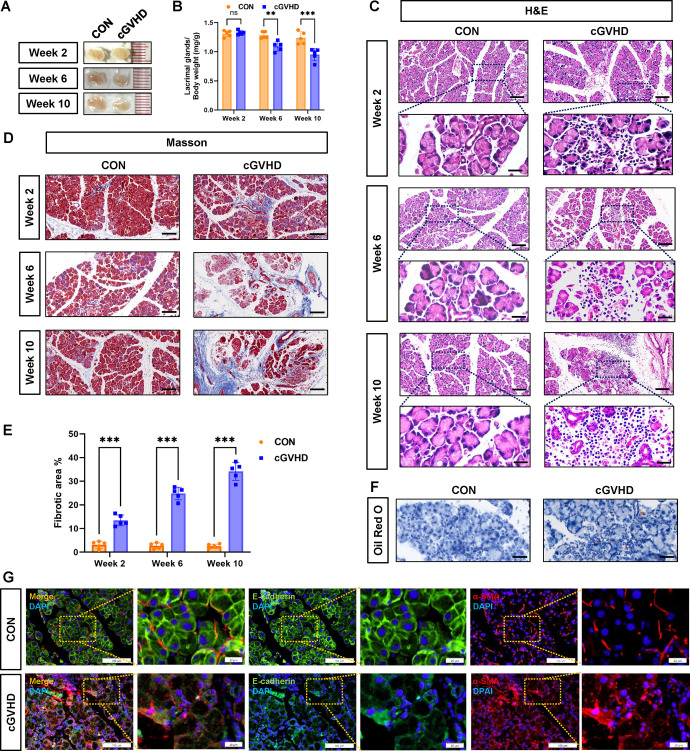
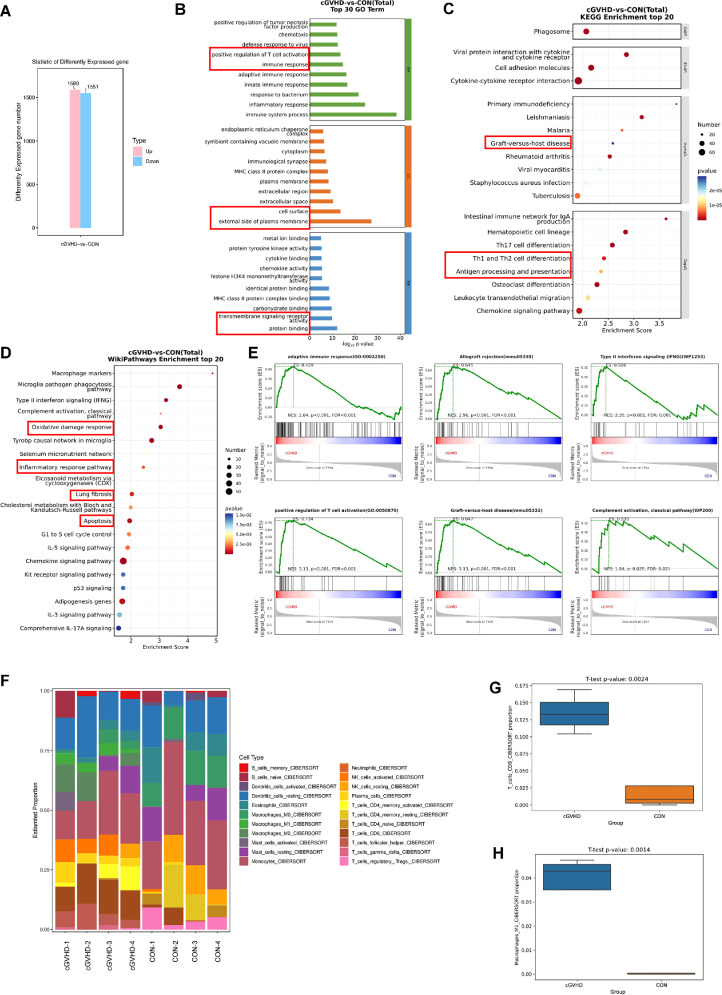
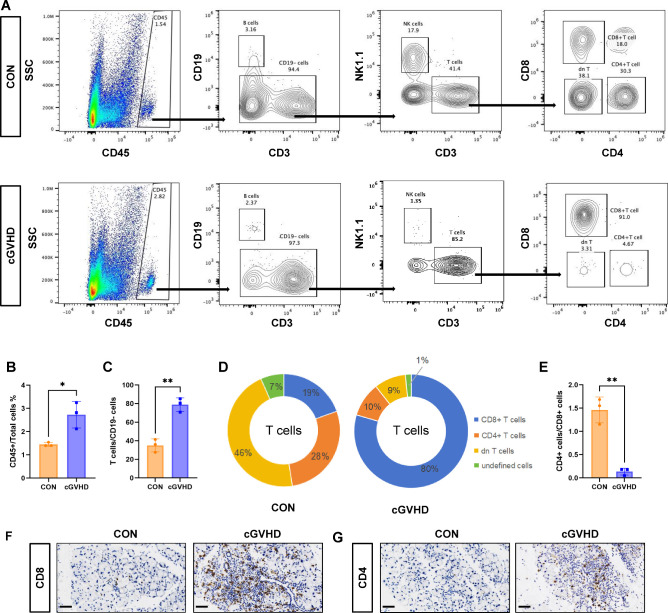
Results: The lupus-like cGVHD model was successfully constructed 2 weeks post-transplantation. The recipient mice developed lupus-like phenotypes, including splenomegaly, proteinuria, and increased autoantibodies, and their ocular presentations included corneal epithelial defects and decreased tear secretion. Histological analysis revealed a reduction in corneal nerve fiber density and corneal endothelial cells, along with conjunctival fibrosis and loss of goblet cells. Moreover, cGVHD induced progressive aggravation of immune cell infiltration and fibrosis in the lacrimal glands. RNA-Sequencing (RNA-seq) results of the lacrimal glands demonstrated that the differentially expressed genes (DEGs) between the control and cGVHD groups were associated with GVHD pathways. Immune infiltration analysis using RNA-seq and flow cytometry confirmed that CD8+ T lymphocytes predominantly constituted the inflammatory infiltrating cells within the lacrimal glands.

Conclusions: This lupus-like cGVHD model (bm12→C57BL/6J) exhibited persistent ocular surface manifestations, characterized by immune infiltration of CD8+ T lymphocytes in the lacrimal glands. Thus, this ocular cGVHD model may be used to explore the underlying mechanisms and discover novel therapeutic interventions.


Conflict of interest statement

Disclosure: Y. Sun, None; Y. Zhang, None; J. Shen, None; F. Shi, None; Y. Li, None; C. Wang, None; X. Dong, None; T. Chen, None; F. Yu, None; Y. Zhou, None; P. Wan, None

Figures

Figure 1.
Figure 1.
Systemic manifestations in the lupus-like cGVHD model. (A) Experimental design and workflow of establishing the lupus-like cGVHD model by transferring spleen lymphocytes from bm12 mice into the C57BL/6J mice. The workflow was drawn with www.biorender.com. (B) Gross appearances of the spleens and (C) the ratios of spleen/body weight (mg/g) in the control and cGVHD groups at week 2, week 6, and week 10 (n = 5 mice). (D) The percentage of mice with proteinuria > 1+ at week 2, week 6, and week 10 (n = 12 mice). (E) Serum anti-dsDNA autoantibody titers at week 2, week 6, and week 10 (n = 5 mice). (F) Body weight changes over time after transplantation (n = 12 mice). Data were presented as mean ± SD. ns = not significant. * P < 0.05, ** P < 0.01, *** P < 0.001.
Figure 2.
Figure 2.
Ocular surface phenotypes in the lupus-like cGVHD model. The evaluation of the ocular surface was conducted at week 2, week 6, and week 10 following transplantation (n = 3 mice). (A) Representative photographs of corneal fluorescein sodium staining under slit lamp and (B) scoring of corneal fluorescein. (C) Central corneal sensitivity was measured with Cochet–Bonnet esthesiometry. (D) Tear secretion was measured using phenol red cotton threads, with damp threads indicated by a red coloration. (E) Tear volume was quantitated as the length (mm) of the red-colored threads. Data were presented as mean ± SD. * P < 0.05, ** P < 0.01, *** P < 0.001.
Figure 3.
Figure 3.
Effects of lupus-like cGVHD on the retina. The evaluation of the retina was conducted at week 10 following transplantation (n = 3 mice). (A) Representative photographs of the fundus and FFA were obtained at week 10 of follow-up. (B) H&E staining of the retina across the optic nerve (left; Bar = 100 µm) and higher-magnification images (right; Bar = 50 µm) at week 10 post-transplantation.
Figure 4.
Figure 4.
Histological changes of the cornea in the lupus-like cGVHD model. The cornea underwent histological analysis at week 2, week 6, and week 10 following transplantation (n = 5 mice). (A) Immunofluorescence staining of corneal fiber nerves stained with β-III Tubulin in corneal whole mounts (Bar = 500 µm) and higher-magnification images of the central cornea (Bar = 100 µm). (B) H&E staining was performed to assess the histological changes in the central cornea (Bar = 50 µm). (C) Higher-magnification images of the central cornea were obtained to quantitatively assess the number of corneal endothelial cells (blue arrows; Bar = 25 µm). (D) Quantification of corneal endothelial cell density in two groups. Data were presented as mean ± SD. ns = not significant. * P < 0.05, ** P < 0.01, *** P < 0.001.
Figure 5.
Figure 5.
Histological changes of the conjunctiva in the lupus-like cGVHD model. The conjunctiva underwent histological analysis 10 weeks post-transplantation (n = 5 mice). (A) H&E staining was conducted to evaluate the structural alterations of the conjunctiva (Bar = 50 µm). (B) PAS staining of the conjunctiva (Bar = 50 µm). (C) Quantification analysis of PAS-positive goblet cells. (D) Masson staining of the conjunctiva (Bar = 50 µm). Data were presented as mean ± SD. * P < 0.05, ** P < 0.01, *** P < 0.001.
Figure 6.
Figure 6.
Histological analysis of the lacrimal gland in the lupus-like cGVHD model. The lacrimal gland underwent histological analysis at week 2, week 6, and week 10 following transplantation (n = 5 mice). (A) Gross appearances of the lacrimal glands and (B) the ratios of bilateral lacrimal glands/body weight (mg/g) in 2 groups at week 2, week 6, and week 10 post-transplantation. (C) H&E staining of the lacrimal glands (Bar = 100 µm) and higher-magnification images (Bar = 25 µm) revealed that immune cell infiltration commenced as early as 2 weeks post-transplantation in the lacrimal glands and exhibited a progressive increased trend every week thereafter. (D) Masson staining of the lacrimal glands (Bar = 100 µm). (E) Blue fibrotic areas by Masson staining were measured using ImageJ. (F) Oil red O staining of the lacrimal glands at week 10 post-transplantation (Bar = 50 µm). (G) Immunofluorescence staining of E-cadherin and α-SMA (Bar = 100 µm) and higher-magnification images (Bar = 20 µm) in the lacrimal glands at week 10 post-transplantation. Data were presented as mean ± SD. ns = not significant. * P < 0.05, ** P < 0.01, *** P < 0.001.
Figure 7.
Figure 7.
RNA-seq analysis of the lacrimal glands. RNA-seq analysis was used to compare the genetic changes of the lacrimal glands between the control (n = 4 mice) and cGVHD groups at week 10 post-transplantation (n = 4 mice). (A) Histogram of differently expressed gene numbers. (B) GO enrichment analysis in biological process, cellular component, and molecular function. (C) KEGG pathway enrichment analysis. (D) Wiki pathway enrichment analysis. (E) GSEA analysis based on the GO gene set, the KEGG gene set, and the Wiki gene set. (F) Comparisons of immune-cell proportions between the cGVHD and control lacrimal glands by using the CIBERSORT algorithm. (G, H) Among these immune cell subsets, the proportions of CD8+ T cells and M1 macrophages were significantly increased in the cGVHD group. Data were presented as mean ± SD.
Figure 8.
Figure 8.
Inflammatory cell infiltration of the lacrimal glands. The infiltration of inflammatory cells in the lacrimal glands was analyzed by multichannel flow cytometric analysis at week 10 after transplantation (n = 3 mice). (A) Gating strategy and representative flow cytometry plots to analyze inflammatory cells in the lacrimal glands. (B) The quantitative proportion of CD45+ cells among total live cells. (C) The quantitative proportion of T cells among CD19- cells. (D) The percent composition of T cell subsets presented a higher CD8+ T cell composition in the cGVHD group. (E) The ratios of CD4+/CD8+ cells were significantly lower in the cGVHD group compared to the control group. (F) Immunohistochemical staining of CD8 in the lacrimal glands (Bar = 50 µm). (G) Immunohistochemical staining of CD4 in the lacrimal glands (Bar = 50 µm). Data were presented as mean ± SD. * P < 0.05, ** P < 0.01, *** P < 0.001.

Similar articles

References

    1. Blazar BR, Murphy WJ, Abedi M.. Advances in graft-versus-host disease biology and therapy. Nat Rev Immunol. 2012; 12: 443–458. - PMC - PubMed
    1. Hong C, Jin R, Dai X, Gao X. Functional contributions of antigen presenting cells in chronic graft-versus-host disease. Front Immunol. 2021; 12: 614183. - PMC - PubMed
    1. Jagasia MH, Greinix HT, Arora M, et al. .. National Institutes of Health Consensus Development Project on Criteria for Clinical Trials in Chronic Graft-versus-Host Disease: I. The 2014 Diagnosis and Staging Working Group report. Biol Blood Marrow Tr. 2015; 21: 389–401. - PMC - PubMed
    1. Westeneng AC, Hettinga Y, Lokhorst H, Verdonck L, van Dorp S, Rothova A.. Ocular graft-versus-host disease after allogeneic stem cell transplantation. Cornea. 2010; 29: 758–763. - PubMed
    1. Tabbara KF, Al-Ghamdi A, Al-Mohareb F, et al. .. Ocular findings after allogeneic hematopoietic stem cell transplantation. Ophthalmology. 2009; 116: 1624–1629. - PubMed