. 2024 Oct 3;26(10):1878-1894.
doi: 10.1093/neuonc/noae109.

Super-enhancer-driven IRF2BP2 enhances ALK activity and promotes neuroblastoma cell proliferation

Affiliations

Super-enhancer-driven IRF2BP2 enhances ALK activity and promotes neuroblastoma cell proliferation

Yanling Chen et al. Neuro Oncol. .

Abstract

Background: Super-enhancers (SEs) typically govern the expression of critical oncogenes and play a fundamental role in the initiation and progression of cancer. Focusing on genes that are abnormally regulated by SE in cancer may be a new strategy for understanding pathogenesis. In the context of this investigation, we have identified a previously unreported SE-driven gene IRF2BP2 in neuroblastoma (NB).

Methods: The expression and prognostic value of IRF2BP2 were detected in public databases and clinical samples. The effect of IRF2BP2 on NB cell growth and apoptosis was evaluated through in vivo and in vitro functional loss experiments. The molecular mechanism of IRF2BP2 was investigated by the study of chromatin regulatory regions and transcriptome sequencing.

Results: The sustained high expression of IRF2BP2 results from the activation of a novel SE established by NB master transcription factors MYCN, MEIS2, and HAND2, and they form a new complex that regulates the gene network associated with the proliferation of NB cell populations. We also observed a significant enrichment of the AP-1 family at the binding sites of IRF2BP2. Remarkably, within NB cells, AP-1 plays a pivotal role in shaping the chromatin accessibility landscape, thereby exposing the binding site for IRF2BP2. This orchestrated action enables AP-1 and IRF2BP2 to collaboratively stimulate the expression of the NB susceptibility gene ALK, thereby upholding the highly proliferative phenotype characteristic of NB.

Conclusions: Our findings indicate that SE-driven IRF2BP2 can bind to AP-1 to maintain the survival of tumor cells via regulating chromatin accessibility of the NB susceptibility gene ALK.

Keywords: AP-1; IRF2BP2; chromatin accessibility; neuroblastoma; super-enhancer.


Conflict of interest statement

The authors have declared that no conflict of interest exists.

Figures

Graphical Abstract
Graphical Abstract
Graphical representation of the regulatory mechanism of SE-driven-IRF2BP2 mediation in NB. The master TFs MYCN, HAND2, and MEIS2 bind to the IRF2BP2 SE region, thereby enhancing its transcriptional activation, and resulting in the upregulation of IRF2BP2 expression in NB. Meanwhile, IRF2BP2 recruits the chromatin pioneer factor AP-1 family, enhancing the transcriptional activation of ALK by regulating chromatin accessibility. Image created with Figdraw.com.
Figure 1.
Figure 1.
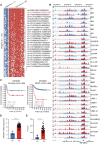
Identification of IRF2BP2 as a SE-driven gene in NB which is associated with poor prognosis. (A) Heatmap of the high-frequency SE occurrences (1 or 0) in at least 70% of the analyzed samples (the chromosome coordinates of SEs listed on the right) based on 26 NB cell lines and 7 NB patients. (B) The H3K27ac activity profile of SE-driven oncogenic gene on chr1:234598806–234615169 ranked second, and is shown in 26 NB cell lines (the back 26 tracks) and 7 NB patients (the front 7 tracks). SE regions are indicated by horizontal lines. (C) The Kaplan–Meier curves depicting the overall survival probability of patients with NB, categorized by the expression levels of IRF2BP2, were sourced from the TCGA database. The available prognostic data samples were sorted into IRF2BP2 high or low expression using the Kaplan Scan method, which identifies the optimal cutoff through statistical analysis. (D) The mRNA expression levels of IRF2BP2 were compared between a dataset comprising neural crest tissue (NC) samples and neuroblastoma (NB) samples obtained from a microarray dataset available in the Gene Expression Omnibus (GEO) database. ****P < .0001; P-values are determined by t-tests. (E) A standard semi-quantitative histological scoring system score (H-score) was determined by IRF2BP2 staining intensity and area of NB tissue microarray. ****P < .0001, P-values are determined by t-tests.
Figure 2.
Figure 2.
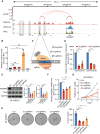
IRF2BP2 is the SE-driven gene in NB. (A) Interactions between the SE and promoter region in SK-N-BE(2), as predicted by HiChIP sourced from the ENCODE database, were visualized using the WashU Epigenome Browser. The predicted SE and promoter were depicted as connecting lines. (B) Four enhancer constituents within IRF2BP2-SE (E1–E4) along with a negative control (NC) region were individually cloned into luciferase reporter vectors. The activity of these enhancers was assessed through dual-luciferase reporter assays conducted in SK-N-BE(2). Mean ± SD is shown, n = 4 (biological replicates). ****P < .0001, ns means no significance; P-values are determined byone-way ANOVA. (C) The schematic illustrates the suppression of constitutive enhancers associated with IRF2BP2 using a dCas9 fused with a transcriptional repressor domain (KRAB). (D) The H3K27ac CUT&RUN PCR findings are presented for SK-N-BE(2) cells expressing dCas9/KRAB vector together with nontargeting negative control or E3-targeting sgRNAs. Mean ± SD is shown, n = 3 (biological replicates). ****P < .0001; P-values are determined by one-way ANOVA. (E) Western blot and protein quantification of Cas9 and IRF2BP2 in SK-N-BE(2) after sgRNA-dCas9 vectors transfected. Mean ± SD is shown, n = 3 (biological replicates). ***P < .001, **P < .01, *P < .05; P-values are determined by one-way ANOVA. (F) The mRNA expression of IRF2BP2 in SK-N-BE(2) after sgRNA-dCas9 vectors were transfected. Mean ± SD is shown, n = 3 (biological replicates). ***P < .001, ****P < .0001; P-values are determined by one-way ANOVA. (G) The CCK8 assays were employed to evaluate the survival rate of SK-N-BE(2) cells upon transfection with nontargeting negative control or E3-targeting sgRNAs, thereby assessing their cellular viability. Mean ± SD is shown, n = 3 (biological replicates). ****P < .0001; P-values are determined by one-way ANOVA. (H) The effect of specifically suppressing the IRF2BP2 E3 cis-regulatory elements on SK-N-BE(2) colony formation. Mean ± SD is shown, n = 3 (biological replicates). ****P < .0001, ***P < .001, **P < .01; P-values are determined by one-way ANOVA.
Figure 3.
Figure 3.
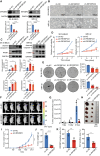
NB master TFs (HAND2, MYCN, and MEIS2) cooperatively active the IRF2BP2-SE. (A) Integrative genomic viewer (IGV) shows the ChIP-seq or CUT&Tag profiles of NB master TFs at IRF2BP2 SE loci. (B) Correlation among the expression of the NB master TFs and IRF2BP2 in SK-N-BE(2). (C) The luciferase activities of IRF2BP2 enhancer elements measured in SK-N-BE(2) after knockdown of each of the 3 TFs. The luciferase signal is normalized to a Renilla transfection control. Mean ± SD is shown, n = 4 (biological replicates). ****P < .0001, ns means no significance; P-values are determined by t-tests. (D) Western blotting and protein quantification of IRF2BP2 in SK-N-BE(2) upon knockdown of each of the 3 master TFs. Mean ± SD is shown, n = 3 (biological replicates). **P < .01, *P < .05; P-values are determined by one-way ANOVA. (E) RT-qPCR analysis showing the mRNA level of IRF2BP2 in SK-N-BE(2) upon knockdown of each of 3 master TFs. Mean ± SD is shown, n = 3 (biological replicates). ****P < .0001, ***P < .001; P-values are determined by t-tests.
Figure 4.
Figure 4.
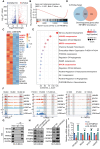
IRF2BP2 deficiency promotes NB apoptosis and inhibits NB proliferation in vitro and in vivo. (A) Western blotting and protein quantification to verify the IRF2BP2 knockdown efficiency in NB cells. Mean ± SD is shown, n = 3 (biological replicates). ****P < .0001, ***P < .001; P-values are determined by one-way ANOVA. (B) The knockdown of IRF2BP2 results in a significant increase in apoptosis, as shown by the cell image. (C) Western blot and protein quantification showing the expression levels of cleaved caspase-3 and cleaved PARP in NB cells after the knockdown of IRF2BP2. Mean ± SD is shown, n = 3 (biological replicates). ***P < .001, **P < .01, ns means no significance; P-values are determined by one-way ANOVA. (D) The proliferation of NB cells transfected sh-NC or sh-IRF2B2P was detected by CCK8 assay. Mean ± SD is shown, n = 3 (biological replicates). ****P < .0001; P-values are determined by one-way ANOVA. (E) The effect of IRF2BP2 on colony formation is evaluated by colony formation assay. Mean ± SD is shown, n = 3 (biological replicates). ****P < .0001; P-values are determined by one-way ANOVA. (F and G) Representative sequential BLI images of the tumor-bearing mice in both the control group and the IRF2BP2-depleted group at intervals of 7, 14 and 21 days following the subcutaneous implantation of NB cells. Scale is in counts per second (cps). Mean ± SD is shown, n = 5 (biological replicates). *P < .05, **P < .01, ns means no significance; P-values are determined by t-tests. (H–J) Images (H), Growth curve (I), and tumor weights (J) in xenografts of the control group and IRF2BP2-depletion group. Mean ± SD is shown, n = 5 (biological replicates). ****P < .0001; P-values are determined by t-tests. (K) IHC staining statistics of IRF2BP2 and Ki-67 in xenograft tumors from sh-NC or sh-IRF2BP2 mice. Mean ± SD is shown, n = 5 (biological replicates). ***P < .001, **P < .01; P-values are determined by t-tests.
Figure 5.
Figure 5.
IRF2BP2 promotes tumorigenicity by regulating critical oncogenes of NB. (A) The volcano plots illustrate genes exhibiting differential expression levels between sh-NC and sh-IRF2BP2 as detected by RNA-seq. Each dot on the plot represents an individual gene. In all panels, the blue dots represent genes significantly downregulated in NB cells, and the red dots represent genes significantly upregulated in SK-N-BE(2). log2FoldChange ≤ 1 or >1, adjusted P < .05. (B) Gene set enrichment analysis (GSEA) was conducted on the differentially expressed genes. (See online version for color figure) (C) Heatmap of differentially expressed genes produced by IRF2BP2-depletion. (D) The Venn diagram shows the overlapped genes between the downregulated genes after IRF2BP2-depletion and the genes located at the IRF2BP2-binding sites according to the CUT&Tag data. (E) EnrichR analysis for overlap of genes located at the IRF2BP2-binding sites and downregulated genes in SK-N-BE(2) after IRF2BP2-knockdown. (F) IGV shows ATAC-seq and CUT&Tag (ChIP-seq) of indicated antibodies surrounding each master TFs (MEIS2, HAND2, and MYCN) and IRF2BP2 locus. (G) The interaction between HAND2, MEIS2, N-Myc, and IRF2BP2 protein in SK-N-BE(2). The protein coupled with IgG served as a negative control. (H) Western blotting examining the protein expression of HAND2, MEIS2, and N-Myc after IRF2BP2 knockdown or expression in NB cells. (I) RT-qPCR examines the mRNA expression of HAND2, MEIS2, and MYCN after IRF2BP2 knockdown or overexpression in NB cells. Mean ± SD is shown, n = 3 (biological replicates). *P < .05, **P < .01, ***P < .001, ****P < .0001; P-values are determined by one-way ANOVA.
Figure 6.
Figure 6.
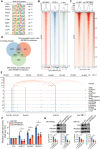
IRF2BP2/AP-1 regulates chromatin accessibility to affect the transcription of the oncogene ALK in NB. (A) Top consensus motif recognized by HOMER with IRF2BP2 binding peaks in SK-N-BE(2). (B) Heatmap shows CUT&Tag signals at ±2 kb window around IRF2BP2 binding loci in SK-N-BE(2) overexpressing IRF2BP2, rank ordered by the intensity of IRF2BP2 peaks, measured in reads per million mapped reads (RPM). Lines, peaks; and color scale of peak intensity are shown at the bottom. (C) Heatmap shows the lower intensity of ATAC-seq peaks at IRF2BP2 occupied regions in IRF2BP2-depletion SK-N-BE(2) than NC. Lines, peaks; and color scale of peak intensity are shown at the right. (D) Overlap of genes displaying loss-of-chromatin accessibility, IRF2BP2 binding, and expression in IRF2BP2-knockdown SK-N-BE(2). (E) Specific regions of altered accessibility after IRF2BP2 knockdown. IGV tracks show the ALK, with altered accessibility (accessibility is shown in front 4 tracks), and the corresponding IRF2BP2/FOSL2/c-Jun binding (endogenous IRF2BP2, FOSL2, and c-Jun bindings are shown in back 3 tracks). The scales are consistent for the ATAC-seq data within each sample, while for the IRF2BP2, FOSL2, and c-Jun CUT&Tag data the scales are set to the max peak height for each of them independently. (F) Luciferase reporter activities driven by different ALK gene fragments in IRF2BP2-depletion SK-N-BE(2). Mean ± SD is shown, n = 3 (biological replicates). **P < .01, *P < .05; P-values are determined by one-way ANOVA. (G) Western blot and protein quantification of ALK after IRF2BP2 knockdown in NB cells. Mean ± SD is shown, n = 3 (biological replicates). *P < .05, **P < .01, ***P < .001, ****P < .0001; P-values are determined by one-way ANOVA.

Similar articles

Cited by

References

    1. Sperling J; Society for Maternal-Fetal Medicine (SMFM). Adrenal neuroblastoma. Am J Obstet Gynecol. 2021;225(5):B5–B6. - PubMed
    1. Tonini GP, Capasso M.. Genetic predisposition and chromosome instability in neuroblastoma. Cancer Metastasis Rev. 2020;39(1):275–285. - PubMed
    1. Mlakar V, Jurkovic Mlakar S, Lopez G, et al. 11q deletion in neuroblastoma: a review of biological and clinical implications. Mol Cancer. 2017;16(1):114. - PMC - PubMed
    1. Zafar A, Wang W, Liu G, et al. Molecular targeting therapies for neuroblastoma: progress and challenges. Med Res Rev. 2021;41(2):961–1021. - PMC - PubMed
    1. Perri P, Ponzoni M, Corrias MV, et al. A focus on regulatory networks linking microRNAs, transcription factors and target genes in neuroblastoma. Cancers (Basel). 2021;13(21):5528. - PMC - PubMed

MeSH terms