. 2024 Aug 15;30(16):3578-3591.
doi: 10.1158/1078-0432.CCR-24-0221.

Targeting GPC2 on Intraocular and CNS Metastatic Retinoblastomas with Local and Systemic Delivery of CAR T Cells

Affiliations

Targeting GPC2 on Intraocular and CNS Metastatic Retinoblastomas with Local and Systemic Delivery of CAR T Cells

Guillem Pascual-Pasto et al. Clin Cancer Res. .

Abstract

Purpose: Retinoblastoma is the most common intraocular malignancy in children. Although new chemotherapeutic approaches have improved ocular salvage rates, novel therapies are required for patients with refractory intraocular and metastatic disease. Chimeric antigen receptor (CAR) T cells targeting glypican-2 (GPC2) are a potential new therapeutic strategy.

Experimental design: GPC2 expression and its regulation by the E2F1 transcription factor were studied in retinoblastoma patient samples and cellular models. In vitro, we performed functional studies comparing GPC2 CAR T cells with different costimulatory domains (4-1BB and CD28). In vivo, the efficacy of local and systemic administration of GPC2 CAR T cells was evaluated in intraocular and leptomeningeal human retinoblastoma xenograft models.

Results: Retinoblastoma tumors, but not healthy retinal tissues, expressed cell surface GPC2, and this tumor-specific expression was driven by E2F1. GPC2-directed CARs with 4-1BB costimulation (GPC2.BBz) were superior to CARs with CD28 stimulatory domains (GPC2.28z), efficiently inducing retinoblastoma cell cytotoxicity and enhancing T-cell proliferation and polyfunctionality. In vivo, GPC2.BBz CARs had enhanced persistence, which led to significant tumor regression compared with either control CD19 or GPC2.28z CARs. In intraocular models, GPC2.BBz CAR T cells efficiently trafficked to tumor-bearing eyes after intravitreal or systemic infusions, significantly prolonging ocular survival. In central nervous system (CNS) retinoblastoma models, intraventricular or systemically administered GPC2.BBz CAR T cells were activated in retinoblastoma-involved CNS tissues, resulting in robust tumor regression with substantially extended overall mouse survival.

Conclusions: GPC2-directed CAR T cells are effective against intraocular and CNS metastatic retinoblastomas.


Conflict of interest statement

K.R.B., J.B.F. and G.P.-P have applied for patents for the discovery and development of immunotherapies for cancer, including patents related to GPC2-directed immunotherapies. K.R.B receives royalties from Tmunity/Kite Pharma and ConjugateBio, Inc. for licensing of GPC2-related technology and funding from Tmunity/Kite Pharma and ConjugateBio, Inc. for research on GPC2-directed immunotherapies. K.R.B. is on the ConjugateBio Scientific Advisory Board. J.B.F. receives royalties from Tmunity/Kite Pharma for licensing of GPC2-related technology. The other authors declare no potential conflicts of interest.

Figures

Figure 1.
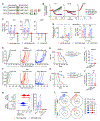
Figure 1.. GPC2 is expressed in retinoblastoma tumors but not in the healthy retina.
A) GPC2 gene expression in 11 different pediatric malignancies included in the St. Jude PeCan Portal. Neuroblastoma (n=186), retinoblastoma (n=7), medulloblastoma (n=15), B-ALL (n=663), rhabdomyosarcoma (n=44), pediatric gliomas (n=138), T-ALL (n=295), Wilms tumor (n=125), ependymoma (n=82), AML (n=320), and osteosarcoma (n=109). P<0.0001 indicates significant difference in expression between retinoblastoma and other non-neural pediatric malignancies (One-Way ANOVA plus Dunnett’s multiple comparison test). B) Graphical scheme of the intraocular and metastatic retinoblastoma patient samples stained for GPC2 by IHC. C) GPC2 expression by IHC in an enucleated eye from a retinoblastoma patient. A magnified area of tumor cells infiltrating the normal retina is shown. Scale bars are indicated. D) (left) Brain magnetic resonance imaging (MRI) showing skull bone marrow infiltration with osseous destruction and associated intracranial/extradural and scalp masses (white arrow; Patient 1). Computed tomography (CT) scan showing a mass in the posterior skull and overlying scalp (white arrow; Patient 2). (right) H&E, GPC2, and CRX expression by IHC in the 2 different metastatic retinoblastoma scalp/skull lesions. Scale bars are indicated. GPC2 IHC H-scores are indicated. E) Flow cytometry histograms showing GPC2 cell surface expression in 2 retinoblastoma cell lines (WERI-1 and Y79), 2 patient-derived primary tumorspheres (HSJD-RBT-7 and HSJD-RBT-34), a control retinal-derived non-tumor cell line (RPE1), and a positive control neuroblastoma cell line (NB-EbC1). F) Western blot images showing GPC2 (left panel) and MYCN and E2F1 (right panel) expression in the same samples as E. (B, Created with BioRender.com)
Figure 2.
Figure 2.. GPC2 expression is regulated by the E2F1 transcription factor in retinoblastoma.
A) Correlation of GPC2 and E2F1 expression obtained from 3 different retinoblastoma datasets from the R2 Genomics Analysis and Visualization Platform. B) GPC2 and E2F1 staining by IHC in 2 consecutive slides of an enucleated eye from a retinoblastoma patient. Areas of tumor (top) and conserved retina (bottom) are shown. Scale bars are indicated. C) Chromatin immunoprecipitation sequencing (ChIP-seq) data for E2F1 at the GPC2 promoter region in U87 human glioblastoma cells (GEO accession number: GSM2634759). Location of the consensus GPC2 promoter and oligos for ChIP-quantitative PCR (qPCR) studies (in D) are indicated by black bars. D) E2F1 binding at GPC2 promoter in Y79 cells measured by qPCR [4 different regions covering −552 to +49 base pairs from transcriptional start site (TSS) and 2 random intragenic regions]. Y-axis represents the enrichment ratio (% Input) of samples immunoprecipitated with anti-E2F1 antibody relative to input control of control immunoglobulin G (IgG). Technical replicates are shown (n=3). E) E2F1 western blot images from HEK293T cells overexpressing E2F1 (HEK239T-E2F1) compared to retinoblastoma cell lines Y79 and WERI-1. F) Fold-change luciferase signal in HEK293T-E2F1 cells compared to HEK293T wild-type cells both transfected with GPC2 promoter-luciferase plasmids from LightSwitch system. Empty-luciferase plasmid was used as negative control. Replicates from 3 independent experiments are shown. *P=0.041 (WT vs HEK293T-E2F1, both with GPC2 promoter; student t-test). G) E2F1 and GPC2 western blot images from Y79 cells transduced with 5 different E2F1 shRNA lentiviruses compared to WT Y79 cells (left). Quantification of GPC2 and E2F1 relative to β-actin (shown in logarithmic scale) in WT and E2F1 shRNA-transduced Y79 cells (right).
Figure 3.
Figure 3.. GPC2-directed CAR T-cells with 4-1BB co-stimulatory domains are cytotoxic to retinoblastoma tumor cells in vitro and in vivo.
A) Graphical scheme of CAR constructs utilized. B) Incucyte-based time-course killing assay of GPC2.28z, GPC2.BBz, and control CD19.CAR T-cells against GFP-tagged Y79, WERI-1, and RPE1 cells at a 1:1 E:T ratio. T-cells were added 24 hours after plating tumor cells. Graphs show means ± SEM of 3 different T-cell donors. Tumor cells alone are also shown. C) Quantification of IFN-γ secretion measured by ELISA from GPC2.28z, GPC2.BBz, and control CD19.CAR T-cells co-cultured with GFP-tagged Y79, WERI-1, and RPE1 cells. T-cells alone are also shown. Graphs show individual values and the mean ± SEM of 3 different T-cell donors. **P<0.01 and *P<0.05 (2-way ANOVA plus Tukey’s multiple comparison test). D) (left) Quantification of residual tumor cells from HSJD-RBT-7 primary tumorspheres after 48 hours of co-culture with GPC2.28z, GPC2.BBz, and control CD19.CAR T-cells at 1:1 and 1:5 E:T ratios. Graphs show individual values and the mean ± SEM of 3 different T-cell donors. Residual tumor cells were detected in the co-cultures by flow cytometry (GD2+, CD45 cells). (right) Quantification of IFN-γ secretion measured by ELISA from the same samples. ***P<0.001 and **P<0.01 (2-way ANOVA plus Tukey’s multiple comparison test). E) Individual tumor growth curves of subcutaneous (s.c.) WERI-1 xenografts treated intravenously (IV) with 10 million CAR+ T-cells (CD19, n=7; GPC2.28z, n=7; and GPC2.BBz, n=7 CARs). F) Individual tumor growth curves of subcutaneous (s.c.) Y79 xenografts treated IV with 10 million CAR+ T-cells from (CD19, n=8; GPC2.28z, n=8; and GPC2.BBz, n=9 CARs). G) Progression-free survival (PFS) of WERI-1-xenograft bearing animals from E. *P=0.032, **P=0.016, and ***P=0.0004 (log-rank test). H) Progression-free survival (PFS) of Y79-xenograft bearing animals from F. *P=0.0062, **P=0.0072, and ***P<0.0001 (log-rank test). I) Quantification of human T-cells in the blood of GPC2.CAR T-cell-treated WERI-1-xenograft-bearing mice from E (day 25). J) Quantification of human T-cells in the blood of GPC2.CAR T-cell-treated Y79-xenograft bearing mice from F (day 21). *P=0.025 (Mann Whitney test). K) (left) Flow cytometry histograms showing CFSE (FITC) signal in GPC2.BBz or GPC2.28z CAR T-cells (CD3+) cultured alone or co-incubated with Y79, WERI-1, or RPE1 cells at a 1:10 E:T ratio for 7 days. (right) Quantification of T-cell proliferation (loss of CFSE signal) in co-cultures compared to T-cells alone. Plot shows individual values and mean ± SEM of 4 different T-cell donors. *P=0.038 (2-way ANOVA plus Tukey’s multiple comparison test). L) Polyfunctionality pie charts indicating the percentage of GPC2.28z or GPC2.BBz CAR T-cells secreting more than 1 cytokine per T-cell when co-cultured with WERI-1 (retinoblastoma) or RPE1 (control) cells. Mean ± SDs of 2 different T-cell donors are indicated in plots.
Figure 4.
Figure 4.. Intravitreal and intravenous administration of GPC2 CAR T-cells is efficacious against intraocular retinoblastoma
A) Representative pictures of CRX and GPC2 IHC staining of the Y79 intraocular retinoblastoma model at endpoint (20 days after tumor injection). Magnified pictures of tumor and surrounding mouse retina are shown. Circle, triangle, and square represent anterior chamber, sclera/choroid, and retinal tumor invasion, respectively. Scale bars are indicated. B) Graphical schema of the in vivo CAR biodistribution and efficacy studies. IV, intravenous; ITVi, intravitreal. Intraocular tumors were implanted in one eye. ITVi injections were performed unilaterally in tumor-bearing eyes. C) Total human CD3+ T-cell numbers quantified by flow cytometry in the intraocular compartment of both retinoblastoma-bearing and the contralateral healthy eyes of mice 7 days after IV and ITVi GPC2 and CD19 CAR T-cell infusion (n=7-8 samples per group). *P<0.05, **P=0.0014, and ***P=0.0010 (2-way ANOVA plus Šidák multiple comparison test). D) CD3 IHC staining in tumor-bearing eyes from mice treated with CD19.CAR IV, GPC2.CAR ITVi, and GPC2.CAR IV at day 7 post T-cell infusion. Higher-magnification pictures of the tumor and conserved mouse retina are shown. Scale bars are indicated. E) Total human CD3+ T-cell numbers 7 days after CAR T-cell infusion quantified by flow cytometry in the blood of mice shown in C. ***P<0.0001 (One-Way ANOVA plus Tukey’s multiple comparison test). F) Residual GFP+ retinoblastoma cells detected by flow cytometry in the intraocular compartment of tumor-bearing eyes shown in C. Percentage of residual tumor cells in GPC2 CAR groups was determined via normalization to the tumor burden in CD19 CAR T-cell IV and ITVi cohorts, respectively. **P=0.004 (One-Way ANOVA plus Tukey’s multiple comparison test). G) Serial IVIS bioluminescence images of mice with Y79 intraocular retinoblastoma xenografts at indicated timepoints after treatment with CAR T-cells [CD19.CAR ITV (n=4), GPC2.BBz.CAR IV (n=4), and GPC2.BBz.CAR ITV (n=4)]. H) Serial luciferase flux curves from IVIS bioluminescent quantification in tumor-bearing eyes after treatments indicated in G. Medians and error (interquartile range) are indicated. I) Representative pictures showing mouse eyes (tumor-bearing and contralateral) at day 20 after treatments indicated in G. J) Ocular survival of mice from G. Follow-up of the IV GPC2 CAR group ended at day 50 due to the development of xenogeneic graft-vs-host disease. **P=0.002 (log-rank test).
Figure 5.
Figure 5.. Intraventricular and intravenous administration of GPC2 CAR T-cells is efficacious against leptomeningeal retinoblastoma
A) CRX and GPC2 IHC staining of the Y79 leptomeningeal retinoblastoma xenografts at endpoint (20 days after tumor injection). A higher magnification of the tumor region is also shown. Scale bars are indicated. B) Graphical schema of the in vivo efficacy and pharmacodynamic CAR T-cell studies performed using the leptomeningeal human retinoblastoma xenograft model. C) Serial IVIS bioluminescence images of mice with Y79 CNS retinoblastoma xenografts at indicated timepoints after treatment with CAR T-cells [CD19.CAR ITV (n=7), GPC2.IBBz.CAR IV (n=7), and GPC2.IBBz.CAR ITV (n=8)]. D) Serial luciferase flux curves from IVIS bioluminescent quantification of mice bearing CNS Y79 xenografts treated with CAR T-cells from C. Quantifications were performed in both brain (left) and spinal cord (right) anatomic regions. Means and SD are shown. E) Overall mouse survival after CAR T-cell treatments indicated in C. Grey boxes indicate time from tumor implantation (day 0) to T-cell infusion (day 7), also indicated with arrows. **P=0.0002 and ***P<0.0001 (log-rank test). F) Quantification of human T-cells in the blood of mice from C 28 days after treatment with GPC2.BBz ITV or IV CAR T-cells. **P=0.0025 (Mann Whitney test). G) Heatmap of cytokines detected in the CSF and serum of mice at day 2 and 6 (combined) after CAR T-cell treatment [GPC2.BBz CAR ITV, GPC2.BBz.CAR IV, CD19.CAR ITV, or CD19.CAR IV (n=2 per timepoint)] measured using CodePlex Secretome: Adaptive Immune Chip run on an IsoSpark System (IsoPlexis). Cytokine values (pg/mL) are shown in log2 scale and represented in colors from high (blue) to low (white) expression. In the CSF, IFN-γ and IL-9 significantly changed after GPC2 CAR therapy (IFN-γ: P<0.01 for GPC2.BBz CAR ITV vs CD19.CARs; P<0.0001 for GPC2.BBz CAR IV vs CD19.CARs, and IL-9: P<0.05 for GPC2.BBz CAR IV vs CD19.CARs; P<0.01 for GPC2.BBz CAR ITV vs CD19.CARs). H) (left) Representative pictures of human CD3 staining (for detecting human T-cells) in the brain lateral ventricles of mice bearing Y79 CNS xenografts after 6 days of treatment with CAR T-cells. Scale bars are indicated. (right) Quantification of the percentage of CD3+ cells in the same areas at both 2 and 6 days after CAR T-cell infusion. Means ± SEM are indicated (n=2 per timepoint and treatment group). (H, Created with BioRender.com).

References

    1. Dimaras H, Corson TW, Cobrinik D, White A, Zhao J, Munier FL, et al. Retinoblastoma. Nat Rev Dis Primers 2015;1:15021 doi 10.1038/nrdp.2015.21. - DOI - PMC - PubMed
    1. Abramson DH, Shields CL, Munier FL, Chantada GL. Treatment of Retinoblastoma in 2015: Agreement and Disagreement. JAMA Ophthalmol 2015;133(11):1341–7 doi 10.1001/jamaophthalmol.2015.3108. - DOI - PubMed
    1. Ancona-Lezama D, Dalvin LA, Shields CL. Modern treatment of retinoblastoma: A 2020 review. Indian J Ophthalmol 2020;68(11):2356–65 doi 10.4103/ijo.IJO_721_20. - DOI - PMC - PubMed
    1. Pavlidou E, Burris C, Thaung C, Scheimberg I, Kingston J, Hungerford JL, et al. Anterior Segment Seeding in Eyes With Retinoblastoma Failing to Respond to Intraophthalmic Artery Chemotherapy. JAMA Ophthalmol 2015;133(12):1455–8 doi 10.1001/jamaophthalmol.2015.2861. - DOI - PubMed
    1. MacKay CJ, Abramson DH, Ellsworth RM. Metastatic patterns of retinoblastoma. Arch Ophthalmol 1984;102(3):391–6 doi 10.1001/archopht.1984.01040030309025. - DOI - PubMed

MeSH terms