

Healthy dietary pattern is associated with lower glycemia independently of the genetic risk of type 2 diabetes: a cross-sectional study in Finnish men
- PMID: 38864868
- PMCID: PMC11490453
- DOI: 10.1007/s00394-024-03444-5
Healthy dietary pattern is associated with lower glycemia independently of the genetic risk of type 2 diabetes: a cross-sectional study in Finnish men
Abstract
Purpose: Hyperglycemia is affected by lifestyle and genetic factors. We investigated if dietary patterns associate with glycemia in individuals with high or low genetic risk for type 2 diabetes (T2D).
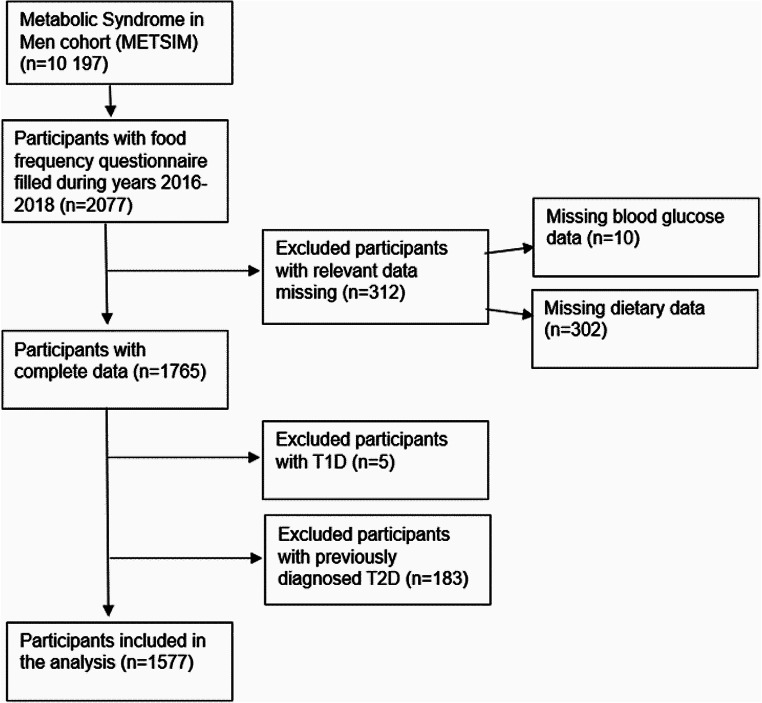
Methods: Men (n = 1577, 51-81 years) without T2D from the Metabolic Syndrome in Men (METSIM) cohort filled a food-frequency questionnaire and participated in a 2-hour oral glucose tolerance test. Polygenetic risk score (PRS) including 76 genetic variants was used to stratify participants into low or high T2D risk groups. We established two data-driven dietary patterns, termed healthy and unhealthy, and investigated their association with plasma glucose concentrations and hyperglycemia risk.
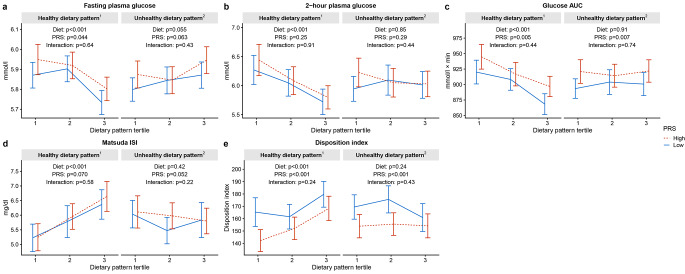
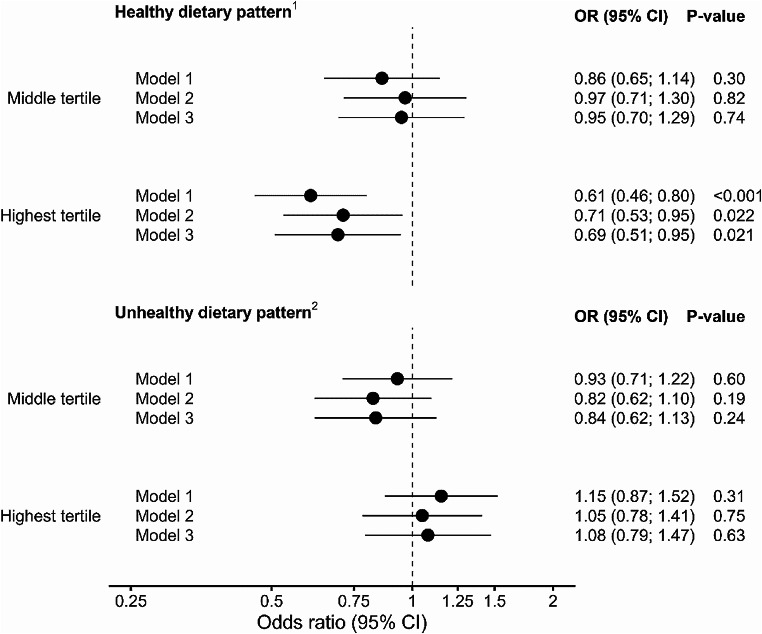
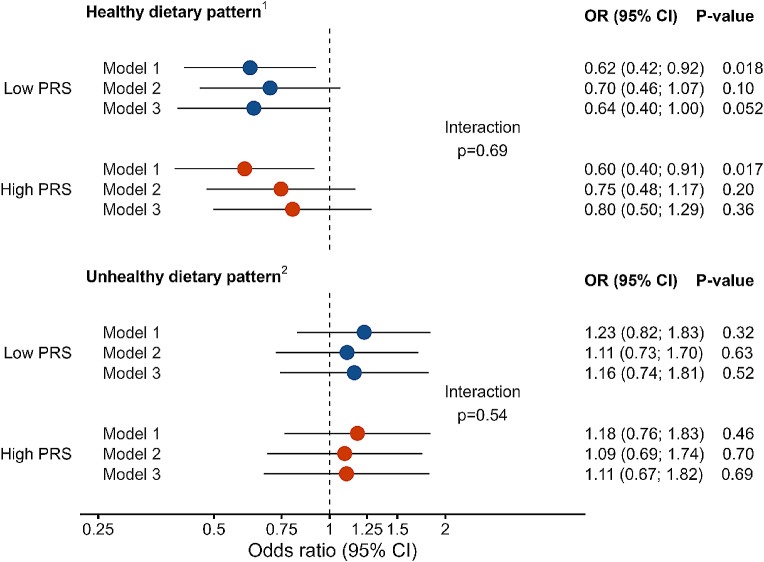
Results: Healthy dietary pattern was associated with lower fasting and 2-hour plasma glucose, glucose area under the curve, and better insulin sensitivity (Matsuda insulin sensitivity index) and insulin secretion (disposition index) in unadjusted and adjusted models, whereas the unhealthy pattern was not. No interaction was observed between the patterns and PRS on glycemic measures. Healthy dietary pattern was negatively associated with the risk for hyperglycemia in an adjusted model (OR 0.69, 95% CI 0.51-0.95, in the highest tertile), whereas unhealthy pattern was not (OR 1.08, 95% CI 0.79-1.47, in the highest tertile). No interaction was found between diet and PRS on the risk for hyperglycemia (p = 0.69 for healthy diet, p = 0.54 for unhealthy diet).
Conclusion: Our findings suggest that healthy diet is associated with lower glucose concentrations and lower risk for hyperglycemia in men with no interaction with the genetic risk.
Keywords: Diabetes; Diet; Gene; Glucose; Glycemia; Human.
© 2024. The Author(s).
Conflict of interest statement
The authors have no competing interests to declare that are relevant to the content of this article.
Figures
Similar articles
-
Development of a Diabetes Dietary Quality Index: Reproducibility and Associations with Measures of Insulin Resistance, Beta Cell Function, and Hyperglycemia.Nutrients. 2024 Oct 16;16(20):3512. doi: 10.3390/nu16203512. Nutrients. 2024. PMID: 39458507 Free PMC article.
-
Association of ketone body levels with hyperglycemia and type 2 diabetes in 9,398 Finnish men.Diabetes. 2013 Oct;62(10):3618-26. doi: 10.2337/db12-1363. Epub 2013 Apr 4. Diabetes. 2013. PMID: 23557707 Free PMC article.
-
Both fasting and glucose-stimulated proinsulin levels predict hyperglycemia and incident type 2 diabetes: a population-based study of 9,396 Finnish men.PLoS One. 2015 Apr 8;10(4):e0124028. doi: 10.1371/journal.pone.0124028. eCollection 2015. PLoS One. 2015. PMID: 25853252 Free PMC article.
-
Short Adult Stature Predicts Impaired β-Cell Function, Insulin Resistance, Glycemia, and Type 2 Diabetes in Finnish Men.J Clin Endocrinol Metab. 2017 Feb 1;102(2):443-450. doi: 10.1210/jc.2016-2933. J Clin Endocrinol Metab. 2017. PMID: 27906553
-
Interactions between genetic factors that predict diabetes and dietary factors that ultimately impact on risk of diabetes.Curr Opin Lipidol. 2010 Feb;21(1):31-7. doi: 10.1097/MOL.0b013e3283346cb6. Curr Opin Lipidol. 2010. PMID: 19915463 Free PMC article. Review.
Cited by
-
Metabotype identification via fasting and postprandial metabolomics and its association with type 2 diabetes incidence.Cardiovasc Diabetol. 2025 Jul 8;24(1):269. doi: 10.1186/s12933-025-02821-6. Cardiovasc Diabetol. 2025. PMID: 40629373 Free PMC article.
-
Insulinemic potential of diet and the risk of type 2 diabetes: a meta-analysis and systematic review.Diabetol Metab Syndr. 2024 Oct 10;16(1):246. doi: 10.1186/s13098-024-01474-x. Diabetol Metab Syndr. 2024. PMID: 39385247 Free PMC article. Review.
References
-
- IDF Diabetes Atlas (2022) 10th edition. https://diabetesatlas.org/atlas/tenth-edition/. Accessed 22
-
- Edwards CM, Cusi K (2016) Prediabetes: a Worldwide Epidemic. Endocrinol Metab Clin North Am 45:751–764. 10.1016/j.ecl.2016.06.007 - PubMed
-
- Tuomilehto J, Lindström J, Eriksson JG et al (2001) Prevention of type 2 diabetes mellitus by changes in lifestyle among subjects with impaired glucose tolerance. N Engl J Med 344:1343–1350. 10.1056/NEJM200105033441801 - PubMed
MeSH terms
Substances
LinkOut - more resources
Full Text Sources
Medical
