. 2024 Aug 5;223(8):e202402144.
doi: 10.1083/jcb.202402144. Epub 2024 Jun 12.

DBF4, not DRF1, is the crucial regulator of CDC7 kinase at replication forks

Affiliations

DBF4, not DRF1, is the crucial regulator of CDC7 kinase at replication forks

Anja Göder et al. J Cell Biol. .

Abstract

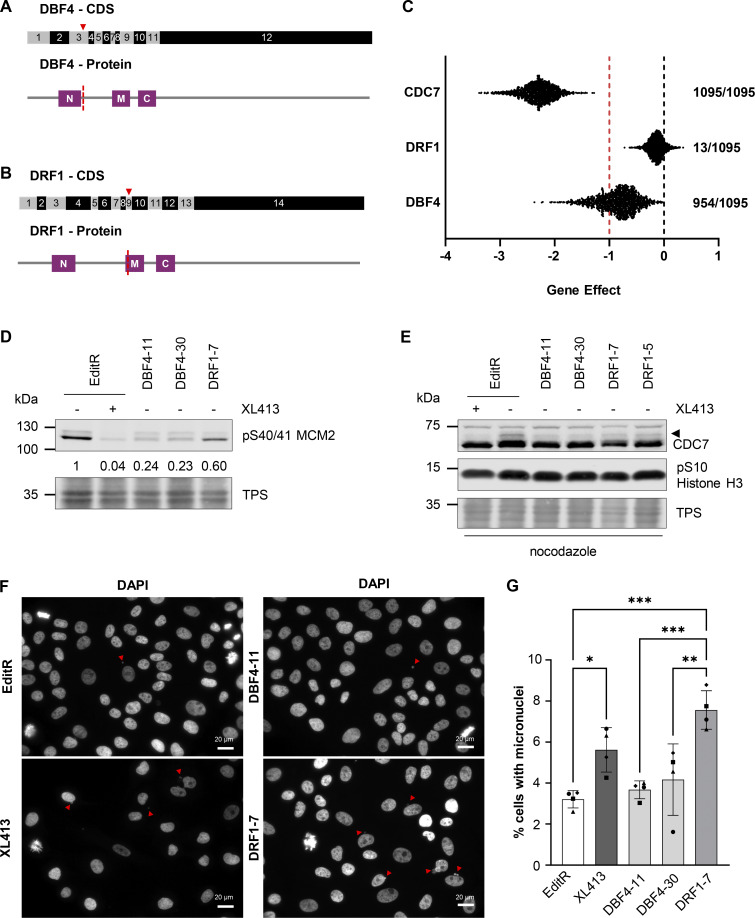
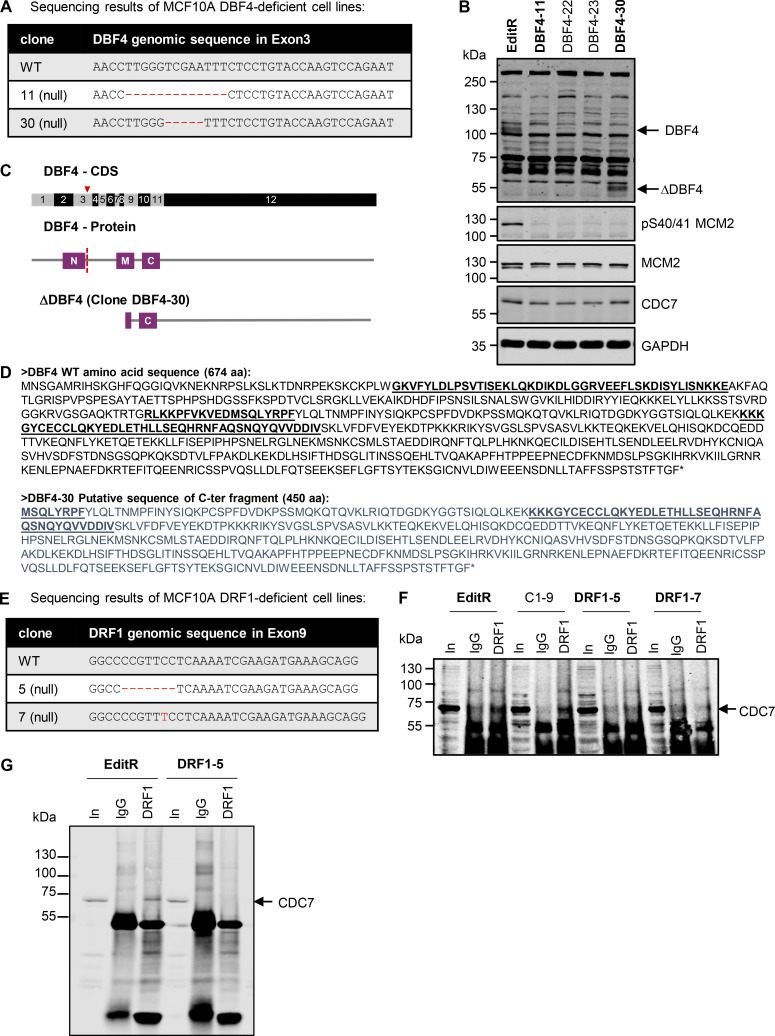
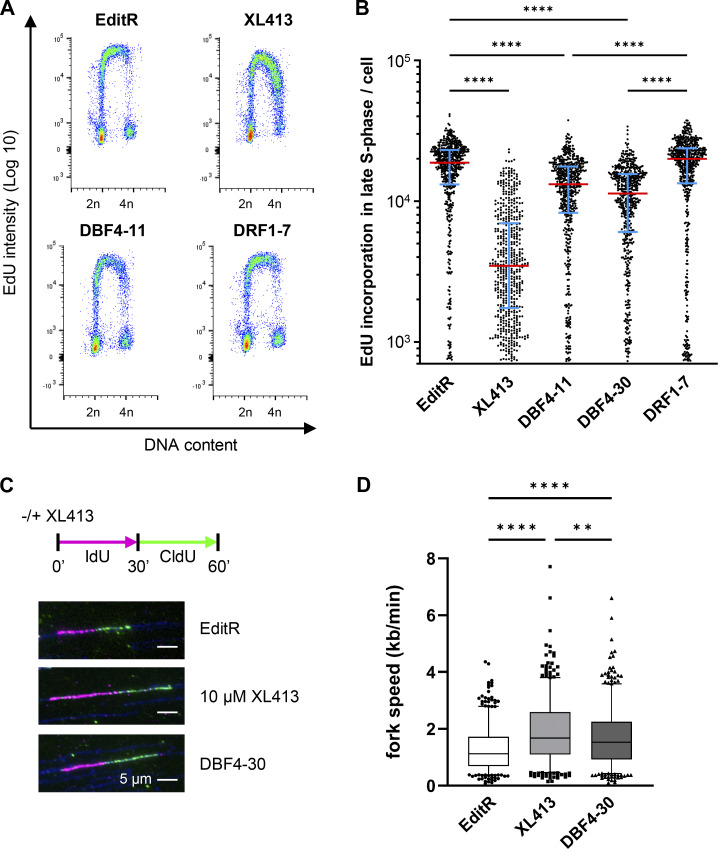
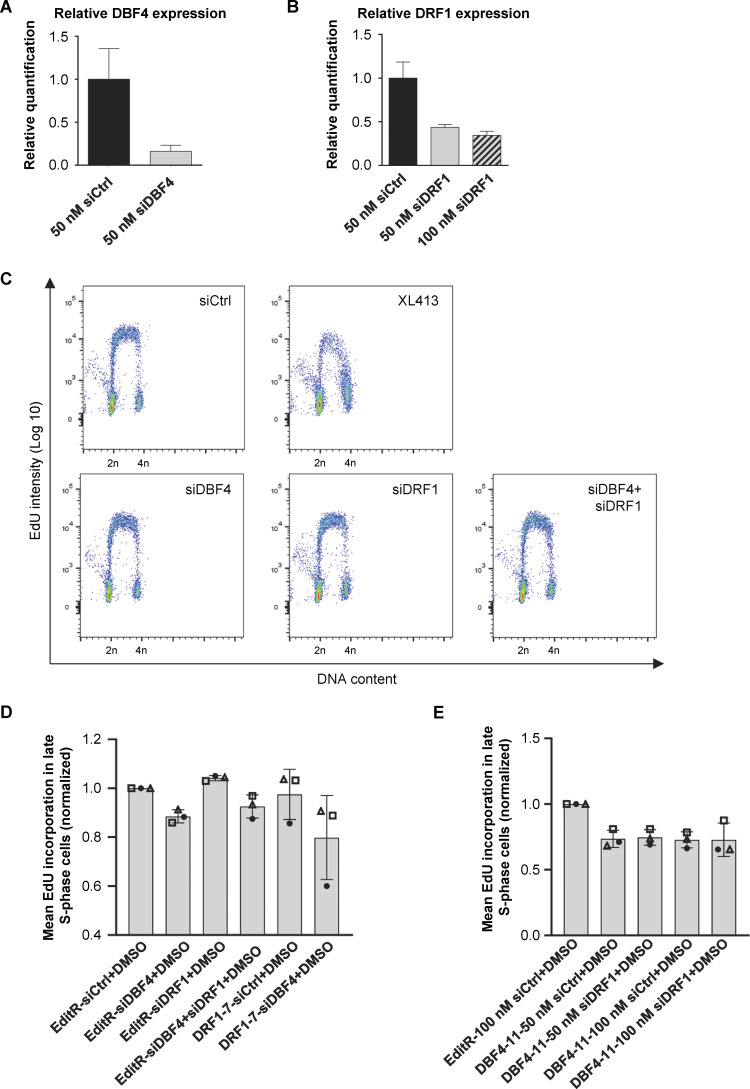
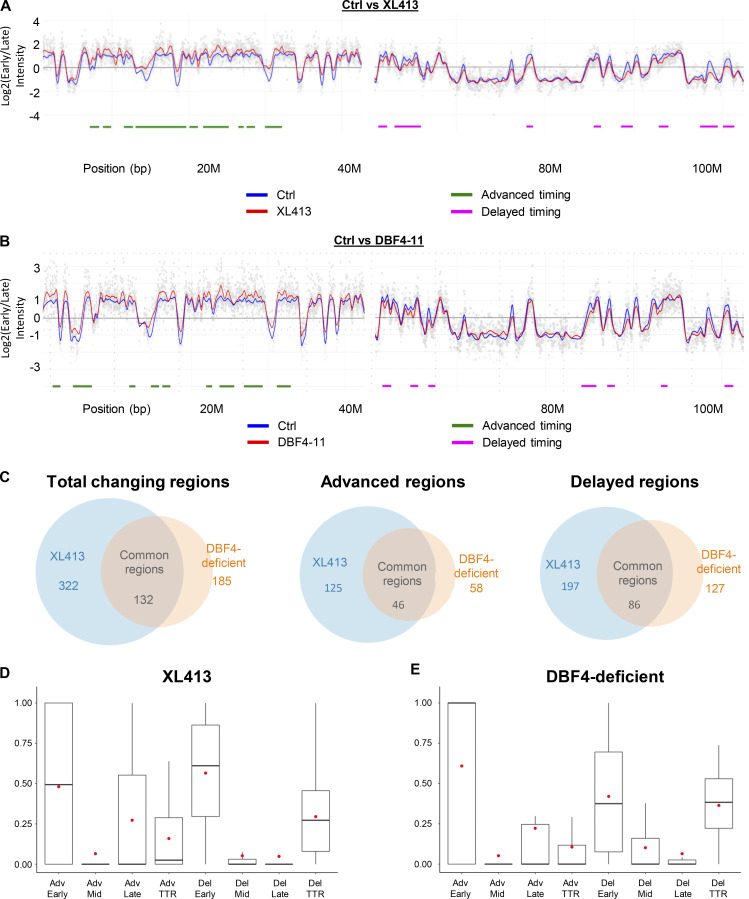
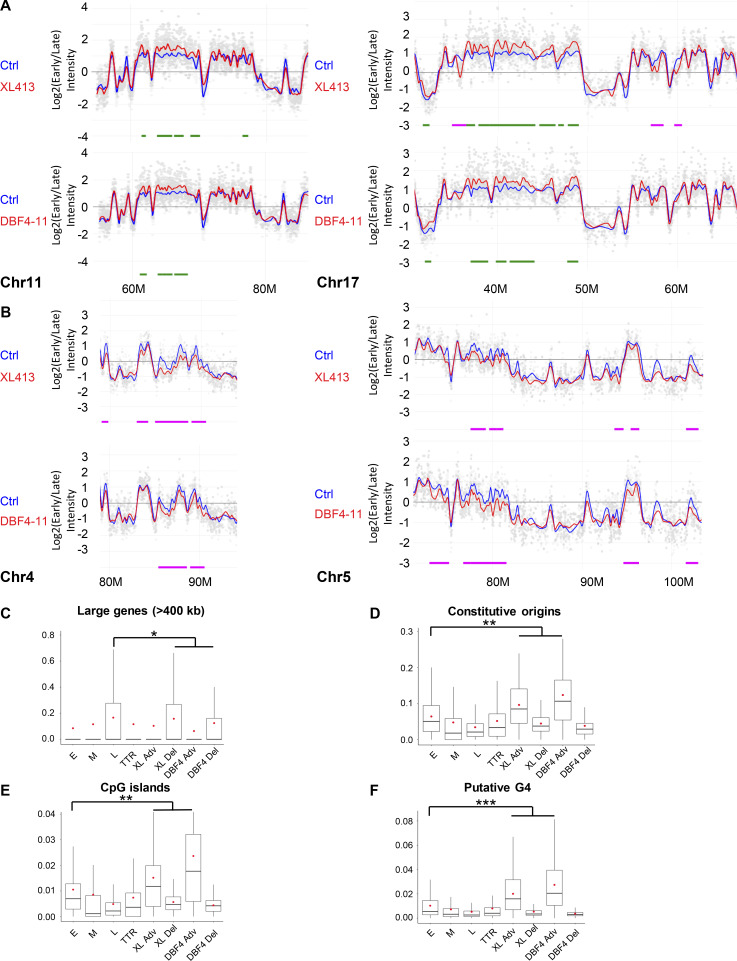
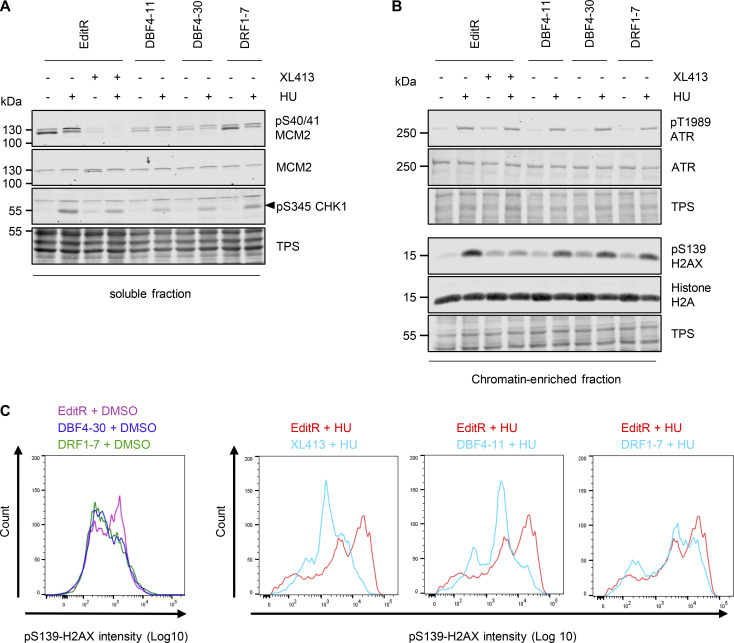
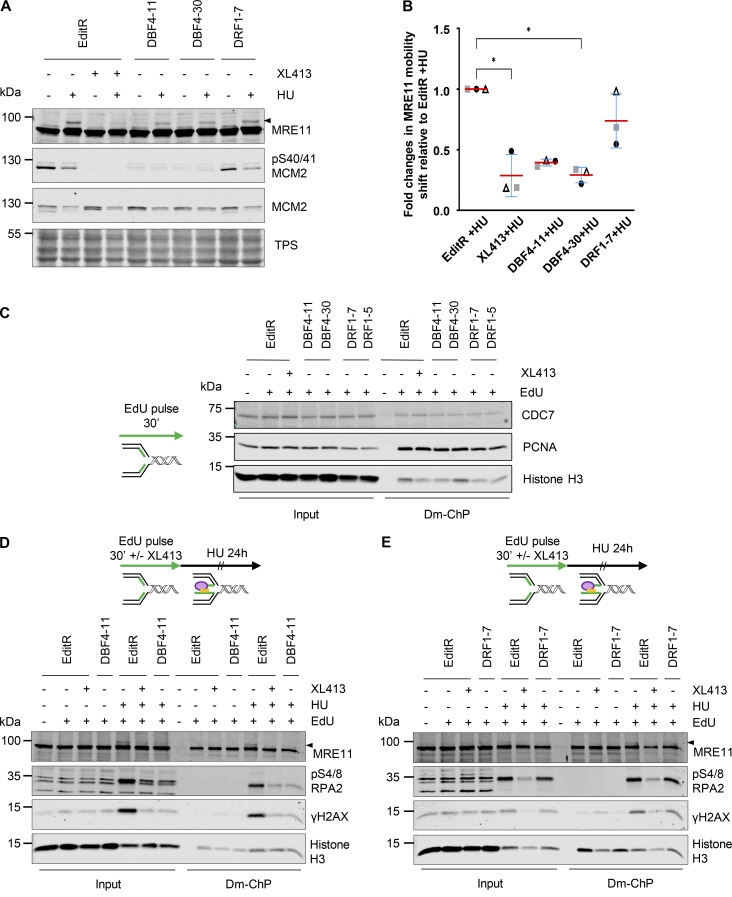
CDC7 kinase is crucial for DNA replication initiation and is involved in fork processing and replication stress response. Human CDC7 requires the binding of either DBF4 or DRF1 for its activity. However, it is unclear whether the two regulatory subunits target CDC7 to a specific set of substrates, thus having different biological functions, or if they act redundantly. Using genome editing technology, we generated isogenic cell lines deficient in either DBF4 or DRF1: these cells are viable but present signs of genomic instability, indicating that both can independently support CDC7 for bulk DNA replication. Nonetheless, DBF4-deficient cells show altered replication efficiency, partial deficiency in MCM helicase phosphorylation, and alterations in the replication timing of discrete genomic regions. Notably, we find that CDC7 function at replication forks is entirely dependent on DBF4 and not on DRF1. Thus, DBF4 is the primary regulator of CDC7 activity, mediating most of its functions in unperturbed DNA replication and upon replication interference.


Conflict of interest statement

Disclosures: A. Göder reported personal fees from AstraZeneca outside the submitted work; and “While unrelated to the submitted work, A. Göder would like to disclose that she is currently employed by AstraZeneca and has stock ownership and/or stock options or interests in the company.” C. Santocanale reported personal fees from Turbine LTD outside the submitted work; in addition, C. Santocanale had a patent to EP4275686A1 pending. No other disclosures were reported.

Figures

Figure 1.
Figure 1.
CDC7 activity is primarily mediated by DBF4 and only to a minimal extent by DRF1. (A and B) Schematic representation of gene editing approach for the generation of DBF4- (A) and DRF1-deficient (B) cells. Red triangle marks the position of the Cas9 cut site in the coding sequence (CDS) for DBF4 or DRF1, exons are numbered. M, N, and C motifs in both proteins are aligned with the CDS and marks indicate the position of the Cas9 cut site relative to the protein sequence. (C) Comparison of CHRONOS dependency scores (gene effect) obtained in CRISPR/Cas9 knockout screens for CDC7, DBF4, and DRF1 available from DepMap portal. A score of 0 (black line) or higher would describe a non-essential gene, a score of −1 (red line) corresponds to the median of all pan-essential genes. A lower score describes a higher chance of the gene of interest being essential. Numbers represent the number of cell lines, which have been classified as dependent on CDC7, DBF4, or DRF1 of 1,095 tested cell lines. (D) MCF10A EditR, MCF10A DBF4-11 and -30, and MCF10A DRF1-7 were treated with 10 µM XL413 or DMSO for 24 h. Whole-cell extracts were prepared and analyzed by immunoblotting with indicated antibodies. TPS was used as loading control. Numbers indicate relative changes in MCM2 phosphorylation compared with the DMSO-treated control cell line and normalized to TPS in the displayed blot. Data are representative of at least three independent experiments. (E) MCF10A EditR, MCF10A DBF4-11 and -30, and MCF10A DRF1-5 and -7 were treated with 10 µM XL413 or DMSO for 24 h. 16 h before harvesting, cells were additionally treated with 0.2 µg/ml nocodazole. Whole-cell extracts were prepared and analyzed by immunoblotting with indicated antibodies. TPS was used as loading control. Triangle marks the mobility shift of CDC7. Data are representative of three independent experiments. (F) MCF10A EditR were either mock or treated with 10 µM XL413 for 24 h. MCF10A DBF4-11 and -30 and MCF10A DRF1-7 were only mock-treated. Cells were fixed, stained with DAPI to visualize DNA, and analyzed by fluorescence microscopy. Representative images of four independent experiments are shown (scale bar, 20 µm). Red triangles indicate micronuclei. The brightness of images was adjusted for all samples to aid visualization. (G) Graph shows the percentage of cells with micronuclei for four independent experiments, mean ± SD. At least 275 cells were analyzed per condition for each experiment. Statistical analysis was performed using one-way ANOVA with Tukey’s multiple comparison test (*P < 0.05, **P < 0.01, ***P < 0.001). Source data are available for this figure: SourceData F1.
Figure S1.
Figure S1.
Characterization of MCF10A DBF4- and DRF1-deficient cells. (A) Genomic DNA was extracted from MCF10A, DBF4-11, and DBF4-30 cells, and PCR products spanning DBF4 exon 3 were sequenced. (B) Protein extracts prepared from MCF10A EditR, DBF4-11, and DBF4-30 (bold) as well as from two other clones that were not used in the study were analyzed by immunoblotting with the indicated antibodies. Arrows indicate full-length DBF4 and DBF4 C-terminus fragment. (C) Scheme of DBF4 gene and protein, indicating the position of the deletions and position where the change in protein sequence occurs, and scheme of the predicted DBF4 fragment detected in clone DBF4-30. The red triangle marks the position of the Cas9 cut site in the coding sequence (CDS) for DBF4, and the red dotted line indicates where the change in the sequence of the DBF4 protein occurs in the mutants. (D) Sequences of full-length DBF4 and possible translated DBF4 product expressed in the clone DBF4-30; N, M, and C motifs are underlined and in bold. (E) Genomic DNA was extracted from MCF10A, DRF1-5, and DRF1-7 cells, and PCR products spanning DRF1 exon 9 were sequenced. (F) Protein extracts were prepared from MCF10A EditR, DRF1-5, DRF1-7 (bold), and a different clone not used in this study. IP was then performed with either anti-DRF1 mAb 5G4 or unrelated IgGs and probed with the indicated antibodies. Protein extract was loaded as control (In); arrow indicates CDC7 protein. (G) Protein extracts were prepared from MCF10A EditR or DRF1-5 and an independent IP experiment was performed as in panel F; arrow indicates CDC7 protein. Source data are available for this figure: SourceData FS1.
Figure 2.
Figure 2.
DBF4, not DRF1, is the major contributor to CDC7 activity in DNA replication. (A) MCF10A EditR, MCF10A DBF4-11 and -30, and MCF10A DRF1-7 were treated with 10 µM XL413 or DMSO for 24 h. For flow cytometry analysis, cells were labeled with 10 µM EdU 30 min prior to harvest. Representative images from one of three independent experiments are shown. (B) Fluorescence intensity, proportional to EdU incorporation, in late S-phase cells for representative experiment displayed in A. Red lines indicate the medians and blue lines show the interquartile range extending from the 25th to the 75th percentile of 552 cells. Statistical analysis was performed using one-way ANOVA with Tukey’s multiple comparison test (****P < 0.0001). (C) MCF10A EditR and MCF10A DBF4-30 were treated with 10 µM XL413 or DMSO for 24 h and then labeled with IdU (magenta) for 30 min. IdU was washed off and cells were labeled with CldU (green) for 30 min in the presence of 10 µM XL413 or DMSO. Representative fibers for each treatment/cell line are shown. (D) Analysis of replication fork speed in the experiment described in C. At least 100 tracks were analyzed for each condition of three independent experiments. Box plots display the median and 5–95% range. Statistical analysis was performed using one-way ANOVA with Tukey’s multiple comparison test (**P < 0.01, ****P < 0.0001).
Figure S2.
Figure S2.
DBF4 depletion partially reduces DNA replication rate in MCF10A cells. (A and B) MCF10A EditR cells were transfected with siCtrl, siDBF4 (A), or siDRF1 (B) at indicated concentrations over 72 h. DBF4 and DRF1 mRNA levels were assessed using real-time qPCR. Data are representative of one independent experiment performed in technical triplicates. (C) MCF10A EditR was transfected with 50 nM of indicated siRNAs for 48 h followed by treatment with 10 µM XL413 or DMSO for 24 h. For flow cytometry analysis, cells were labeled with 10 µM EdU 30 min prior to harvest. Representative images from one of three independent experiments are shown. (D) Analysis of fluorescence intensity, proportional to EdU incorporation, in late S-phase cells described in C and including additional samples of DRF1-7 cells transfected with 50 nM siCtrl or siDBF4 of the same experiment. Mean fluorescence intensity in late S-phase cells of three independent experiments was expressed as a ratio relative to MCF10A EditR cells transfected with siCtrl. Experiments are represented with different symbols, and columns are displayed as mean ± SDs. (E) Analysis of fluorescence intensity, proportional to EdU incorporation, in MCF10A EditR and DBF4-11 cells transfected and treated as indicated in late S-phase of three independent experiments. Mean fluorescence intensity was expressed as a ratio relative to MCF10A EditR cells transfected with siCtrl. Experiments are represented with different symbols, and columns are displayed as mean ± SDs.
Figure 3.
Figure 3.
Loss of DBF4 and CDC7 inhibition induces similar changes in global RT. MCF10A EditR and MCF10A DBF4-deficient cells were treated with 10 µM XL413 or DMSO for 24 h before RT analysis. (A) Part of chromosome 1 RT profiles in untreated or XL413-treated MCF10A EditR cells. RT profiles display the log ratio between early and late replicated fractions along the chromosome. Positive log ratios correspond to early replicated regions whereas negative ones correspond to late replicated regions. The blue line represents MCF10A EditR cells treated with DMSO and the red one, cells treated with 10 µM XL413. Chromosome coordinates are indicated below the profile in megabases (M). Differences in RT are marked below the profile with advanced regions in green and delayed regions in magenta. Data is representative of two replicates of four independent experiments. (B) Part of chromosome 1 RT profiles for MCF10A EditR compared with MCF10A DBF4-deficient cells (DBF4-11). Analysis was performed and graphs were generated as described in A. (C) Summary of changes in RT in MCF10A EditR treated with 10 µM XL413 (blue) and MCF10A DBF4-deficient cells (orange) displayed as a Venn diagram for total changing regions (left), advanced regions (middle), and delayed regions (right). Numbers represent the numbers of changed regions for indicated samples. Four independent experiments were performed for XL413-treated MCF10A cells and for DBF4-deficient cells. (D) Analysis of RT changes in MCF10A EditR treated with 10 µM XL413 for 24 h relative to the RT regions they originated from; either early, mid, and late replicating regions or TTR. Advanced regions (Adv) and delayed regions (Del) are displayed separately. The box plots show the dispersion of the data with a range from the 25th to 75th percentile, the sample median is represented by the line inside the box and the mean by a red dot. (E). Analysis of RT changes in MCF10A DBF4-deficient cells treated with DMSO for 24 h as described in D.
Figure S3.
Figure S3.
Regions with changed RT in MCF10A cells treated with XL413 or in DBF4-deficient cells share similar properties. (A) Part of chromosomes 11 and 17 RT profiles with mostly advanced regions upon CDC7 inhibition with XL413 (top profiles) or in DBF4-deficient cells (bottom profiles). RT profiles display the log ratio between early and late replicated fractions along the chromosome. Positive log ratios correspond to early replicated regions whereas negative ones correspond to late replicated regions. The blue line represents MCF10A EditR cells treated with DMSO, the red one, cells treated with 10 µM XL413 or DBF4-deficient cells (DBF4-11). Chromosome coordinates are indicated below the profile in megabases (M). Differences in RT are marked below the profiles with advanced regions in green and delayed regions in magenta. Data are representative of two replicates of four independent experiments. (B) Part of chromosomes 4 and 5 RT profiles with delayed regions upon CDC7 inhibition with XL413 (top profiles) or in DBF4-deficient cells (bottom profiles). Analysis was performed and graphs were generated as described in A. (C–F) Coverage of large genes (>400 kb; C), constitutive origins (D), CpG islands (E), and regions rich in putative G4 sequences (F) in RT changing regions of MCF10A EditR and DBF4-deficient cells treated with 10 µM XL413 or DMSO for 24 h. Results were compared to the coverage of these factors in early (E), mid (M), and late (L) replicating regions or TTR of MCF10A EditR cells. Advanced regions (Adv) and delayed regions (Del) are displayed separately. The box plots show the dispersion of the data with a range from the 25th to 75th percentile, the sample median represented by the line inside the box, and the mean by a red dot. The significance of the differences was estimated with a Wilcoxon test (*P < 10−3, **P < 7.5 10−5, and ***P < 7.3 10−13).
Figure 4.
Figure 4.
DBF4 mediates CDC7 activity in the replication stress response. (A and B) MCF10A EditR, MCF10A DBF4-11 and -30, and MCF10A DRF1-7 were pretreated with 10 µM XL413 or DMSO for 30 min before the addition of 4 mM HU for 16 h. Soluble (A) and chromatin-enriched (B) fractions were prepared and analyzed by immunoblotting with indicated antibodies. TPS was used as loading control. Triangle marks the pS345 CHK1 band. Data are representative of three independent experiments. (C) MCF10A EditR, MCF10A DBF4 -30, and MCF10A DRF1-7 were pretreated with 10 µM XL413 or DMSO for 30 min before the addition of 4 mM HU for 24 h. For flow cytometry analysis of pS139-H2AX intensity, cells were harvested, fixed, and stained with the indicated antibody. Representative images from one of three independent experiments are shown. MCF10A EditR treated with HU in the panels is the same sample in pairwise comparison with other samples for better visualization. Source data are available for this figure: SourceData F4.
Figure 5.
Figure 5.
CDC7’s activity at replication forks is solely mediated by DBF4. (A) MCF10A EditR, MCF10A DBF4-11, and -30, and MCF10A DRF1-7 were pretreated with 10 µM XL413 or DMSO for 30 min before the addition of 4 mM HU for 24 h. Whole-cell extracts were prepared and analyzed by immunoblotting with indicated antibodies. TPS was used as loading control. Triangle marks MRE11 electrophoretic mobility shift. Data are representative of three independent experiments. (B) Quantification of MRE11 mobility shift. Data shows fold change in MRE11 mobility shift of HU-treated DBF4-11, DBF4-30, DRF1-7, and XL413-treated EditR samples relative to MCF10A EditR cotreated with DMSO and HU in three independent experiments. Data were normalized to TPS to account for differences in loading. Data are presented as mean fold change ± SD. Statistical analysis was performed using Kruskal–Wallis test, with Dunn’s multiple comparison test (*<0.05). (C) MCF10A EditR, MCF10A DBF4-11, and MCF10A DRF1-7 were treated with 10 µM XL413 or DMSO for 24 h. Before harvesting, cells were labeled with EdU for 30 min, then cells were fixed and proteins binding to EdU-labeled DNA were captured by Dm-ChP. A graphical representation of the experiment is shown on the left of the western blot analysis. Both input and captured material (Dm-ChP) were analyzed by western blot with indicated antibodies. Histone H3 was used as a loading control. Unlabeled cells (− EdU) were used as a negative control for the Dm-ChP samples. Data are representative of two independent experiments for EditR and clone DBF4-11 and once for the other clones. (D) MCF10A EditR and MCF10A DBF4-11 were pretreated with 10 µM XL413 or DMSO and 10 µM EdU for 30 min followed by a treatment with 4 mM HU for 24 h. Samples were prepared as described in C. Triangle marks MRE11 electrophoretic mobility shift. Data are representative of three independent experiments. (E) MCF10A EditR and MCF10A DRF1-7 were pretreated with 10 µM XL413 or DMSO and 10 µM EdU for 30 min followed by a treatment with 4 mM HU for 24 h. Samples were prepared as described in C. Triangle marks MRE11 electrophoretic mobility shift. Data are representative of two independent experiments. Source data are available for this figure: SourceData F5.

Similar articles

References

    1. Alver, R.C., Chadha G.S., and Blow J.J.. 2014. The contribution of dormant origins to genome stability: From cell biology to human genetics. DNA Repair. 19:182–189. 10.1016/j.dnarep.2014.03.012 - DOI - PMC - PubMed
    1. Alver, R.C., Chadha G.S., Gillespie P.J., and Blow J.J.. 2017. Reversal of DDK-mediated MCM phosphorylation by Rif1-PP1 regulates replication initiation and replisome stability independently of ATR/Chk1. Cell Rep. 18:2508–2520. 10.1016/j.celrep.2017.02.042 - DOI - PMC - PubMed
    1. Bass, T.E., and Cortez D.. 2019. Quantitative phosphoproteomics reveals mitotic function of the ATR activator ETAA1. J. Cell Biol. 218:1235–1249. 10.1083/jcb.201810058 - DOI - PMC - PubMed
    1. Cazzaniga, C., Göder A., Rainey M.D., Quinlan A., Coughlan S., Bernard S., and Santocanale C.. 2024. CDC7 inhibition drives an inflammatory response and a p53-dependent senescent-like state in breast epithelial cells. Febs j. 10.1111/febs.17127 - DOI - PubMed
    1. Cheng, J., Li N., Huo Y., Dang S., Tye B.K., Gao N., and Zhai Y.. 2022. Structural Insight into the MCM double hexamer activation by Dbf4-Cdc7 kinase. Nat. Commun. 13:1396. 10.1038/s41467-022-29070-5 - DOI - PMC - PubMed

MeSH terms