. 2024 Aug 1;9(8):741-747.
doi: 10.1001/jamacardio.2024.1310.

Individual Variation in the Distribution of Apolipoprotein B Levels Across the Spectrum of LDL-C or Non-HDL-C Levels

Affiliations

Individual Variation in the Distribution of Apolipoprotein B Levels Across the Spectrum of LDL-C or Non-HDL-C Levels

Ahmed Sayed et al. JAMA Cardiol. .

Abstract

Importance: Although apolipoprotein B (apoB) is a superior marker of lipid-related risk compared with low-density lipoprotein cholesterol (LDL-C), few data exist to translate the goals and thresholds from LDL-C to their apoB equivalent. In addition, although current American College of Cardiology/American Heart Association guidelines provide a relative indication for apoB measurement among individuals with hypertriglyceridemia, whether discordance is limited to those subgroups is unknown.

Objectives: To assess the variability in apoB level across the spectrum of LDL-C or non-high-density lipoprotein cholesterol (non-HDL-C) levels and evaluate whether discordance between apoB and LDL-C or non-HDL-C is limited to specifiable subgroups.

Design, setting, and participants: This cross-sectional study used data from a nationally representative sample of 12 688 adult participants not using statins in the National Health and Nutrition Examination Survey between 2005 and 2016. Statistical analysis was performed from April 2023 to February 2024.

Main outcomes and measures: Quantile regression was used to assess the population distribution of apoB across LDL-C or non-HDL-C levels. Discordance between apoB and LDL-C was the difference between measured apoB and median apoB levels for an individual's LDL-C level. Discordance was evaluated by age, sex, race and ethnicity, obesity, diabetes, triglyceride level, hemoglobin A1c level, body mass index (BMI), statin use, and metabolic health (defined as a BMI between 18.5 and 24.9, triglyceride level <150 mg/dL, and no diabetes).

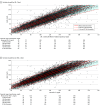
Results: Among the sample of 12 688 participants (median age, 41.0 years [IQR, 29.0-54.0 years]; 52.9% women) for LDL-C values of 55, 70, 100, and 190 mg/dL, the corresponding population median apoB levels were 49, 60, 80, and 140 mg/dL, respectively. For given levels of LDL-C, a range of apoB values was observed. At an LDL-C level of 100 mg/dL, the 95% population distribution of apoB ranged from 66 mg/dL to 99 mg/dL. ApoB variability was highest for LDL-C values estimated using the Friedewald equation, lower when using Sampson or Martin-Hopkins equations, and lowest for non-HDL-C. Although individuals with metabolic risk factors were more likely to have discordantly high apoB levels (ie, had higher median observed apoB levels relative to what was estimated based on LDL-C), significant variability in apoB levels was observed even among metabolically healthy individuals.

Conclusions and relevance: This study suggests that even metabolically healthy individuals may have discordantly high apoB levels relative to LDL-C or non-HDL-C levels. The current guideline approach for apoB testing only for those with hypertriglyceridemia appears too narrow. Population percentile data can be used to translate LDL-C goals and thresholds to their apoB equivalent to facilitate clinical adoption.


Conflict of interest statement

Conflict of Interest Disclosures: Dr Peterson reported receiving grants from Amgen and Esperion Therapeutics during the conduct of the study and personal fees from Novo Nordisc and Janssen outside the submitted work. Dr Virani reported receiving grants and research endowments from the National Institutes of Health, UK National Institute for Health and Care Research, US Department of Veterans Affairs, Tahir and Jooma Family, and Asharia Family outside the submitted work. No other disclosures were reported.

Figures

Figure 1.
Figure 1.. Population Distribution of Apolipoprotein B (ApoB) Levels Across the Spectrum of Low-Density Lipoprotein Cholesterol (LDL-C) and Non–High-Density Lipoprotein Cholesterol (Non–HDL-C) Levels
A, Distribution of apoB levels across the spectrum of LDL-C levels (Martin-Hopkins equation). B, Distribution of apoB levels across the spectrum of non–HDL-C levels.
Figure 2.
Figure 2.. Discordance Between Low-Density Lipoprotein Cholesterol (LDL-C) and Apolipoprotein B (ApoB) Levels by Sex, Race and Ethnicity, Obesity, Diabetes, Metabolic Health, and Statin Use
Each panel shows the distribution of LDL-C–apoB discordance among individuals across different subgroups, including sex (A), race and ethnicity (B), obesity (defined as body mass index [BMI; calculated as weight in kilograms divided by height in meters squared] ≥30) (C), diabetes status (D), metabolic health (E), and statin use (F). A metabolically healthy profile was defined as a BMI between 18.5 and 24.9, a triglyceride level lower than 150 mg/dL, and no diabetes. Discordance between LDL-C and apoB levels is defined as the difference between an individual’s observed apoB level and their estimated apoB level based on the population median (50th percentile) for their observed level of LDL-C (estimated using the Martin-Hopkins equation). The thick lines in the middle of each box indicate the median level of LDL-C–apoB discordance in the subgroup. The lower and upper edges of the box indicate the 25th and 75th percentile of discordance, respectively. The lower and upper whiskers indicate the 2.5th and 97.5th percentiles of discordance, respectively. Each dot represents 1 participant. Positive values for discordance indicate individuals with higher apoB levels than estimated based on LDL-C level, and negative values for discordance indicate individuals with apoB levels lower than estimated based on LDL-C level. The solid line at 0 indicates no discordance. See eTable 3 in Supplement 1 for detailed data.
Figure 3.
Figure 3.. Discordance Between Low-Density Lipoprotein Cholesterol (LDL-C) and Apolipoprotein B (ApoB) Levels by Age, Triglyceride Level, Body Mass Index (BMI), and Hemoglobin A1c (HbA1c) Level
Each panel shows the distribution of LDL-C–apoB discordance among individuals by age (A), triglyceride level (B), BMI (calculated as weight in kilograms divided by height in meters squared) (C), and HbA1c (D). Discordance between LDL-C and apoB level is defined as the difference between an individual’s observed apoB level and their estimated apoB level based on the population median (50th percentile) for their observed level of LDL-C (estimated using the Martin-Hopkins equation). The solid black line indicates perfect concordance (actual apoB = estimated apoB). The area below the line indicates negative concordance (actual apoB < estimated apoB), and the area above the line indicates positive concordance (actual apoB > estimated apoB).

References

    1. Marston NA, Giugliano RP, Melloni GEM, et al. Association of apolipoprotein B–containing lipoproteins and risk of myocardial infarction in individuals with and without atherosclerosis: distinguishing between particle concentration, type, and content. JAMA Cardiol. 2022;7(3):250-256. doi: 10.1001/jamacardio.2021.5083 - DOI - PMC - PubMed
    1. Pencina MJ, D’Agostino RB, Zdrojewski T, et al. Apolipoprotein B improves risk assessment of future coronary heart disease in the Framingham Heart Study beyond LDL-C and non–HDL-C. Eur J Prev Cardiol. 2015;22(10):1321-1327. doi: 10.1177/2047487315569411 - DOI - PubMed
    1. Benn M, Nordestgaard BG, Jensen GB, Tybjaerg-Hansen A. Improving prediction of ischemic cardiovascular disease in the general population using apolipoprotein B: the Copenhagen City Heart Study. Arterioscler Thromb Vasc Biol. 2007;27(3):661-670. doi: 10.1161/01.ATV.0000255580.73689.8e - DOI - PubMed
    1. Sniderman AD, Williams K, Contois JH, et al. A meta-analysis of low-density lipoprotein cholesterol, non–high-density lipoprotein cholesterol, and apolipoprotein B as markers of cardiovascular risk. Circ Cardiovasc Qual Outcomes. 2011;4(3):337-345. doi: 10.1161/CIRCOUTCOMES.110.959247 - DOI - PubMed
    1. Mora S, Buring JE, Ridker PM. Discordance of low-density lipoprotein (LDL) cholesterol with alternative LDL-related measures and future coronary events. Circulation. 2014;129(5):553-561. doi: 10.1161/CIRCULATIONAHA.113.005873 - DOI - PMC - PubMed