. 2024 Jun 12:12:RP88375.
doi: 10.7554/eLife.88375.

RAPSYN-mediated neddylation of BCR-ABL alternatively determines the fate of Philadelphia chromosome-positive leukemia

Affiliations

RAPSYN-mediated neddylation of BCR-ABL alternatively determines the fate of Philadelphia chromosome-positive leukemia

Mengya Zhao et al. Elife. .

Abstract

Philadelphia chromosome-positive (Ph+) leukemia is a fatal hematological malignancy. Although standard treatments with tyrosine kinase inhibitors (TKIs) have achieved remarkable success in prolonging patient survival, intolerance, relapse, and TKI resistance remain serious issues for patients with Ph+ leukemia. Here, we report a new leukemogenic process in which RAPSYN and BCR-ABL co-occur in Ph+ leukemia, and RAPSYN mediates the neddylation of BCR-ABL. Consequently, neddylated BCR-ABL enhances the stability by competing its c-CBL-mediated degradation. Furthermore, SRC phosphorylates RAPSYN to activate its NEDD8 E3 ligase activity, promoting BCR-ABL stabilization and disease progression. Moreover, in contrast to in vivo ineffectiveness of PROTAC-based degraders, depletion of RAPSYN expression, or its ligase activity decreased BCR-ABL stability and, in turn, inhibited tumor formation and growth. Collectively, these findings represent an alternative to tyrosine kinase activity for the oncoprotein and leukemogenic cells and generate a rationale of targeting RAPSYN-mediated BCR-ABL neddylation for the treatment of Ph+ leukemia.

Keywords: E. coli; cancer biology; cell biology; human; mouse.

Plain language summary

Chronic myeloid leukemia (CML for short) accounts for about 15% of all blood cancers diagnosed in adults in the United States. The condition is characterized by the overproduction of immature immune cells that interfere with proper blood function. It is linked to a gene recombination (a type of mutation) that leads to white blood cells producing an abnormal ‘BCR-ABL’ enzyme which is always switched on. In turn, this overactive protein causes the cells to live longer and divide uncontrollably. Some of the most effective drugs available to control the disease today work by blocking the activity of BCR-ABL. Yet certain patients can become resistant to these treatments over time, causing them to relapse. Other approaches are therefore needed to manage this disease; in particular, a promising avenue of research consists in exploring whether it is possible to reduce the amount of the enzyme present in diseased cells. As part of this effort, Zhao, Dai, Li, Zhang et al. focused on RAPSYN, a scaffolding protein previously unknown in CML cells. In other tissues, it has recently been shown to participate in neddylation – a process by which proteins receive certain chemical ‘tags’ that change the way they behave. The experiments revealed that, compared to healthy volunteers, RAPSYN was present at much higher levels in the white blood cells of CML patients. Experimentally lowering the amount of RAPSYN in CML cells led these to divide less quickly – both in a dish and when injected in mice, while also being linked to decreased levels of BCR-ABL. Additional biochemical experiments indicated that RAPSYN sticks with BCR-ABL to add chemical ‘tags’ that protect the abnormal protein against degradation, therefore increasing its overall levels. Finally, the team showed that SRC, an enzyme often dysregulated in emerging cancers, can activate RAPSYN’s ability to conduct neddylation; such mechanism could promote BCR-ABL stabilization and, in turn, disease progression. Taken together, these experiments indicate a new way by which BCR-ABL levels are controlled. Future studies should investigate whether RAPSYN also stabilizes BCR-ABL in patients whose leukemias have become resistant to existing drugs. Eventually, RAPSYN may offer a new target for overcoming drug-resistance in CML patients.


Conflict of interest statement

MZ, BD, XL, YZ, SW, YY, YC listed as an inventor on Chinese patent 202210107464.7 (patent protection filed for by China Pharmaceutical University on RAPSYN), CQ, YQ, ZL, QL No competing interests declared

Figures
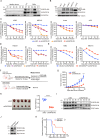
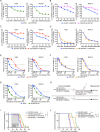
Figure 1.
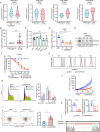
Figure 1.. High protein levels of RAPSYN promotes Ph+ leukemia progression.
(A) Immunoblots of RAPSYN and BCR-ABL in the peripheral blood mononuclear cells (PBMCs) of clinical samples. (B) Immunoblots of RAPSYN and BCR-ABL in Ph+ leukemic cells and normal bone marrow stromal cells (HS-5). (C) Cytotoxicity induced by shRNA-mediated RAPSN knockdown in leukemic and HS-5 cells. (D) Cytotoxicity induced by shRNA-mediated RAPSN knockdown in the PBMCs of chronic myeloid leukemia (CML) patients. (E) Rescue of leukemic cells from shRAPSN #3-induced toxicity by exogenous expression of RAPSN cDNA or NC1. (F) An in vivo experimental design for testing the effects of RAPSYN on tumor growth and survival. (G) The growth curve of subcutaneous xenograft tumors was measured every 2 days from the third day after tumor inoculation for 19 days (five mice in each group). (H) Photograph and weight quantification of excised tumor xenografts from (I). (I) Immunoblots of RAPSYN and BCR-ABL in mouse xenograft tumor biopsies from K562 cells transduced with shRAPSN #3 or shNC. (J) Immunoblots of RAPSYN and BCR-ABL in K562-RAPSNWT and K562-RAPSNKO cells. (K) Kaplan–Meier survival curve of NCG mice following intravenous injection of K562-RAPSNWT or K562-RAPSNKO cells, as shown in (F) (10 mice in each group). All data represent mean ± standard deviation (SD) of at least three independent experiments. p values were calculated using unpaired Student’s t-test (G and H) or log-rank test (K). ***p < 0.001, ****p < 0.0001.
Figure 1—figure supplement 1.
Figure 1—figure supplement 1.. The mRNA levels of RAPSN are not changed by Ph+ leukemia, whereas inhibition of RAPSYN suppresses Ph+ leukemia progression.
(A) Analyses of RAPSN mRNA levels in peripheral blood mononuclear cells (PBMCs) of healthy donors and non-leukemic patients compared to those of patients with chronic myeloid leukemia (CML) from GSE13204, GSE13159, GSE138883, and GSE140385 datasets. (B) Quantification of RAPSN mRNA levels in PBMCs of healthy donors and patients with Ph+ leukemia from the cohort of primary samples using reverse transcription-PCR (RT-PCR). (C) Quantification of RAPSN mRNA levels in Ph+ leukemia cells (K562, KU812, MEG-01, and Jurkat) compared to normal bone marrow stromal cells (HS-5) using RT-PCR (n=4). (D) Quantification of RAPSN mRNA levels in K562 cells transduced with shNC or three independent shRNAs targeting RAPSN using RT-PCR (n=5). (E) Immunoblotting of RAPSYN in K562 cells transduced with shNC or three different shRNAs targeting RAPSN. (F) Cytotoxicity induced by shRNA-mediated RAPSN knockdown in KU812 cells. Representative results from at least three independent experiments are shown. (G) Analysis of SNARF-1 labeling intensity in K562 cells transducted with shNC or shRAPSN #3. (H) Representative Fluorescence-activated cell sorting (FACS) cell cycle profiles of K562 cells transduced with shNC or shRAPSN #3 (n=3). (I) Representative FACS blots of apoptosis analysis of K562 cells transduced with shNC or shRAPSN #3 (n=3). (J) Individual growth curves of subcutaneous xenograft tumors were measured every 2 days from the third day after tumor inoculation for 19 days. (K) Quantification of RAPSYN and BCR-ABL expression in mouse xenograft tumor biopsies from K562 cells transduced with shRAPSN #3 or shNC (n=5). (L) Verification of RAPSNKO in K562 cells. The red dotted line indicates deleted sequences. RAPSN mRNA levels were normalized to that of ACTIN (B) or GAPDH (C, D); error bars, mean ± standard deviation (SD); *p < 0.05, **p < 0.01, ****p < 0.0001, n.s., not significant; unpaired Student’s t-test (A, B, J, K and I) or one-way ANOVA test (C, D).
Figure 2.
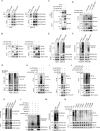
Figure 2.. RAPSYN neddylates BCR-ABL.
(A) Co-immunoprecipitation of BCR-ABL and RAPSYN in leukemic cells. (B) Immunoblots of GST and His after immunoprecipitation of His or GST in HEK293T cells transfected with His-tagged BCR-ABL and GST-tagged RAPSYN. (C) Immunoblots of GST and His following GST pull-down after in vitro incubation of purified His-tagged BCR-ABL and GST or GST-tagged RAPSYN. (D) His-immunoblots of GST immunoprecipitates from HEK293T cells transfected with GST-tagged RAPSYN alone or in combination with His-tagged full-length or truncated BCR-ABL (Δ1: aa 1–927, Δ2: aa 928–2047). (E) Analysis of BCR-ABL neddylation levels in leukemic cells. (F) Analysis of BCR-ABL neddylation levels in primary chronic myeloid leukemia (CML) peripheral blood mononuclear cells (PBMCs). (G) Analysis of BCR-ABL neddylation levels in leukemic cells treated with MLN4924 or dimethyl sulfoxide (DMSO) for 24 hr. (H) HA-immunoblots of His-immunoprecipitate from HEK293T cells transfected with His-tagged BCR-ABL and HA-tagged NEDD8 or NEDD8 ΔGG. (I) HA-immunoblots of His-immunoprecipitate from HEK293T cells transfected with indicated constructs. (J) HA-immunoblots after immunoprecipitation of His-antibody in HEK293T cells transfected with His-tagged BCR-ABL, HA-tagged NEDD8, GFP-tagged WT RAPSYN, or RAPSYN-C366A. (K) Analysis of BCR-ABL neddylation levels in K562 WT, RAPSN KO, and RAPSN KO with exogenous expression of a RAPSN cDNA cells. (L) Assessment of BCR-ABL neddylation by RAPSYN in vitro. Recombinantly expressed and purified RAPSYN and BCR-ABL were incubated with APPBP1/UBA3, UBE2M, or NEDD8 for in vitro neddylation assay. (M) Analysis of BCR-ABL neddylation levels in excised tumor xenografts from Figure 1H. (N) Verification of BCR-ABL neddylation sites in HEK293T cells transfected with indicated constructs.
Figure 2—figure supplement 1.
Figure 2—figure supplement 1.. RAPSYN is an E3 ligase to neddylate BCR-ABL.
(A) Immunoblots of AChR subunits α7, M2, M3, and M4 in Ph+ leukemia cells (K562, KU812, and MEG-01) compared to normal bone marrow stromal cells (HS-5). (B) Immunoblotting analyses of AChR subunit α7, M2, M3, and M4 neddylation levels after immunoprecipitation of NEDD8 in WT and RAPSN KO K562 cells. (C) Heatmap showing the fold change in mRNA level of neddylation-related proteins in chronic myeloid leukemia (CML) patients compared to that in healthy donors. (D) Immunoblots of BCR-ABL and RAPSYN in KU812 cells after co-immunoprecipitation with RAPSYN and BCR-ABL antibodies, respectively. (E) Immunoblotting analyses of BCR-ABL neddylation after immunoprecipitation of BCR-ABL in KU812 and Jurkat cells. (F) Immunoblotting analyses of BCR-ABL neddylation after immunoprecipitation of BCR-ABL in KU812 and Jurkat cells treated with MLN4924 or DMSO for 24 hr. (G) Immunoblotting analyses of BCR-ABL neddylation after immunoprecipitation of BCR-ABL in K562 cells transduced with shAChRα7, shAChRM2, shAChRM3, shAChRM4, or shNC. (H) Immunoblotting analyses of PKC–RAS–ERK and JAK2–AKT changes in K562 cells treated with AChR agonist carbamylcholine chloride (carbachol, 100 μM) and antagonist benzethonium (5 μM) for nAChR or tomatropine bromide (homatropine, 5 μM) for mAChR for 24 hr. (I), Immunoblotting analyses of BCR-ABL neddylation after immunoprecipitation of BCR-ABL in K562 cells treated with AChR agonist carbamylcholine chloride (carbachol, 100 μM) and antagonist benzethonium (5 μM) for nAChR or tomatropine bromide (homatropine, 5 μM) for mAChR for 24 hr. See numerical source data in Figure 2—source data 2.
Figure 2—figure supplement 2.
Figure 2—figure supplement 2.. Liquid chromatography–mass spectrometry (LC–MS/MS) of trypsin-digested peptide fragments of neddylated BCR-ABL.
The neddylation at K257, K500, K739, K802, K1025, K1135, K1590, and K1990 is, respectively, presented with the numbering at Lys residue. Detected peptide sequences are indicated in blue (b ions) and red (y ions).
Figure 3.
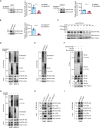
Figure 3.. RAPSYN attenuates BCR-ABL ubiquitination and degradation.
(A) Immunoblots of BCR-ABL in leukemic cells treated with MLN4924 or DMSO for 24 hr and corresponding quantification of three independent replicates. (B) Immunoblots of BCR-ABL in K562 WT and RAPSN KO cells and corresponding quantification of three independent replicates. (C) Assessment of BCR-ABL protein stability in K562 cells expressing DOX-inducible shRAPSN #3 treated with CHX alone or in combination with DOX at indicated time points by immunoblotting. (D) Analysis of BCR-ABL neddylation and ubiquitination levels in leukemic cells treated with MLN4924 or DMSO for 24 hr. (E) Analysis of BCR-ABL neddylation and ubiquitination levels in K562 WT and RAPSN KO cells. (F) Immunoblots of HA and Myc after His-immunoprecipitation in HEK293T cells transfected with His-tagged BCR-ABL, HA-tagged Ub, or without Myc-tagged NEDD8. (G) Analysis of BCR-ABL ubiquitination and neddylation in leukemic cells treated with MG132 or DMSO for 12 hr. (H) Co-immunoprecipitation of BCR-ABL, c-CBL, and RAPSYN in leukemic cells expressing exogenous RAPSN cDNA or empty vector. (I) Co-immunoprecipitation of BCR-ABL, c-CBL, and RAPSYN in K562 WT and RAPSN KO cells. All data represent mean ± standard deviation (SD) of at least three independent experiments. p values were calculated using unpaired Student’s t-test. **p < 0.01, ***p < 0.001.
Figure 3—figure supplement 1.
Figure 3—figure supplement 1.. RAPSYN promotes BCR-ABL stabilization.
Immunoblotting analyses of BCR-ABL in KU812 and Jurkat cells treated with MLN4924 or DMSO for 24 hr (n=3). Error bars, mean ± standard deviation (SD); *p < 0.05; ***p < 0.001; Student’s t-test. See numerical source data Figure 4—figure supplement 1—source data 2.
Figure 4.
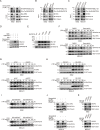
Figure 4.. SRC-mediated phosphorylation at Y336 promotes RAPSYN stability by repressing its proteasomal degradation.
(A) Assessment of RAPSYN phosphorylation levels in leukemic cells treated with saracatinib or DMSO for 24 hr. (B) Assessment of RAPSYN phosphorylation levels in leukemic cells transduced with shSRC or shNC. (C) Assessment of RAPSYN phosphorylation levels in leukemic cells expressing exogenous SRC cDNA or empty vector. (D) Assessment of RAPSYN phosphorylation by SRC in vitro. Purified RAPSYN and SRC were incubated with ATP in the presence or absence of saracatinib for phosphorylation assay. (E) Verification of RAPSYN phosphorylation sites. Purified SRC and RAPSYN WT or indicated mutants were incubated with ATP for phosphorylation assay. (F) Assessment of RAPSYN protein stability in leukemic cells treated with CHX in combination with saracatinib or DMSO at indicated time points by immunoblotting. (G) Assessment of RAPSYN protein stability in leukemic cells transduced with shSRC or shNC by immunoblotting. (H) Assessment of RAPSYN protein stability in leukemic cells transduced with exogenous SRC cDNA or empty vector by immunoblotting. (I) Assessment of RAPSYN protein stability in leukemic cells transduced with exogenous RAPSN WT or Y336F cDNA by immunoblotting. (J) Immunoblots of RAPSYN in leukemic cells treated with saracatinib or DMSO for 12 hr, and subsequently with MG132 or DMSO for another 12 hr. (K) Immunoblots of RAPSYN in leukemic cells transduced with shNC or shSRC and treated with MG132 or DMSO for 12 hr.
Figure 4—figure supplement 1.
Figure 4—figure supplement 1.. SRC-mediated phosphorylation at Y336 promotes RAPSYN stability.
(A) Assessment of RAPSYN phosphorylation in KU812 cells treated with saracatinib or DMSO for 24 hr. (B) Liquid chromatography–mass spectrometry (LC–MS/MS) spectra of trypsin-digested RAPSYN fragments (phosphorylated Y59, Y152, and Y336). The detected products are indicated by green (b ions) and orange (y ions). (C), Sequence alignment of putative phosphorylated site Y336 from indicated species. (D), Quantification of RAPSN mRNA levels in K562 and MEG-01 cells transduced with shSRC or shNC by reverse transcription-PCR (RT-PCR) (n=4). (E), Quantification of RAPSN mRNA levels in K562 and MEG-01 cells expressing exogenous SRC cDNA or corresponding empty vector by RT-PCR (n=4). RAPSN mRNA levels were normalized to that of GAPDH (D, E); error bars, mean ± standard deviation (SD); n.s., not significant; unpaired Student’s t-test. See numerical source data in Figure 5—source data 2.
Figure 5.
Figure 5.. RAPSYN phosphorylation at Y336 potentiates its E3 ligase activity and promotes BCR-ABL stabilization.
(A) Immunoblots of BCR-ABL neddylation levels in leukemic cells treated with saracatinib or DMSO for 24 hr. (B) Immunoblots of BCR-ABL neddylation levels in leukemic cells transduced with shSRC or shNC. (C) Immunoblots of BCR-ABL neddylation levels in leukemic cells expressing exogenous SRC cDNA or empty vector. (D) Effects of RAPSYN phosphorylation on BCR-ABL neddylation levels in HEK293T cells transfected with indicated constructs. (E) Effects of RAPSYN phosphorylation at Y336 on BCR-ABL neddylation levels in leukemic cells expressing exogenous RAPSN WT, Y336F cDNA, or empty vector. (F) Assessment of BCR-ABL protein stability in leukemic cells transduced with exogenous cDNA for RAPSN-WT, Y336F mutant or empty vector by immunoblotting.
Figure 6.
Figure 6.. SRC-mediated phosphorylation of RAPSYN at Y336 promotes Ph+ leukemia progression.
(A) Cytotoxicity induced by shSRC #2-mediated SRC knockdown in leukemic cells. (B) Rescue of leukemic cells from shSRC #2-induced toxicity by exogenous expression of SRC cDNA. (C) Rescue of leukemic cells from shSRC #2-induced toxicity by exogenous expression of RAPSNWT cDNA. (D) Failed rescue of leukemic cells from shSRC #2-induced toxicity by exogenous expression of RAPSNY336F cDNA. (E) Viability of leukemic cells transduced with either RAPSNWT cDNA or corresponding empty vector after 72 hr of incubation with indicated concentrations of saracatinib. (F) Viability of leukemic cells transduced with either RAPSNY336F cDNA or corresponding empty vector after 72 hr of incubation with indicated concentrations of saracatinib. (G) Viability of leukemic cells transduced with either shNC or shRAPSN #3 after 72 hr of incubation with indicated concentrations of saracatinib. (H) Experimental design used to test in vivo effects of RAPSYN phosphorylation at Y336 on Ph+ leukemia progression and survival time. (I) Kaplan–Meier survival curve of NCG mice following intravenous injection of K562-RAPSNWT or K562-RAPSNY336F cells and intragastric administration of saracatinib or corresponding vehicle from days 6 to 26 as indicated (ten mice in each group). (J) Kaplan–Meier survival curve of NCG mice following intravenous injection of double-transfected K562 cells (ten mice in each group). Representative results from at least three independent experiments are shown (A–G); error bars, mean ± standard deviation (SD); *p < 0.05, **p < 0.01, ***p < 0.001, ****p < 0.0001; log-rank test (I–J).
Figure 6—figure supplement 1.
Figure 6—figure supplement 1.. shSRC #2 is a specific shRNA targeting the 3′UTR of SRC.
(A) Toxicity tests of all shSRCs in Ph+ leukemia. Failed rescue of K562 and MEG-01 cells from shSRC #4 (B) and #5 (C)-induced toxicity by exogenous expression of an SRC cDNA. Representative results from at least three independent experiments are shown (A–C).

Update of

References

    1. Aydın B, Kan B, Cabadak H. The role of intracellular pathways in the proliferation of human K562 cells mediated by muscarinic receptors. Leukemia Research. 2013;37:1144–1149. doi: 10.1016/j.leukres.2013.05.018. - DOI - PubMed
    1. Bahjat M, de Wilde G, van Dam T, Maas C, Bloedjes T, Bende RJ, van Noesel CJM, Luijks DM, Eldering E, Kersten MJ, Guikema JEJ. The NEDD8-activating enzyme inhibitor MLN4924 induces DNA damage in Ph+ leukemia and sensitizes for ABL kinase inhibitors. Cell Cycle. 2019;18:2307–2322. doi: 10.1080/15384101.2019.1646068. - DOI - PMC - PubMed
    1. Barnes DJ, Palaiologou D, Panousopoulou E, Schultheis B, Yong ASM, Wong A, Pattacini L, Goldman JM, Melo JV. Bcr-Abl expression levels determine the rate of development of resistance to imatinib mesylate in chronic myeloid leukemia. Cancer Research. 2005;65:8912–8919. doi: 10.1158/0008-5472.CAN-05-0076. - DOI - PubMed
    1. Békés M, Langley DR, Crews CM. PROTAC targeted protein degraders: the past is prologue. Nature Reviews. Drug Discovery. 2022;21:181–200. doi: 10.1038/s41573-021-00371-6. - DOI - PMC - PubMed
    1. Bhalla KN, Fiskus W. NEDD8 and HDACs: promising cotargets in AML. Blood. 2016;127:2168–2170. doi: 10.1182/blood-2016-02-699058. - DOI - PMC - PubMed

MeSH terms

Associated data