. 2024 Jun 25;43(6):114340.
doi: 10.1016/j.celrep.2024.114340. Epub 2024 Jun 11.

Generation of salivary glands derived from pluripotent stem cells via conditional blastocyst complementation

Affiliations

Generation of salivary glands derived from pluripotent stem cells via conditional blastocyst complementation

Junichi Tanaka et al. Cell Rep. .

Abstract

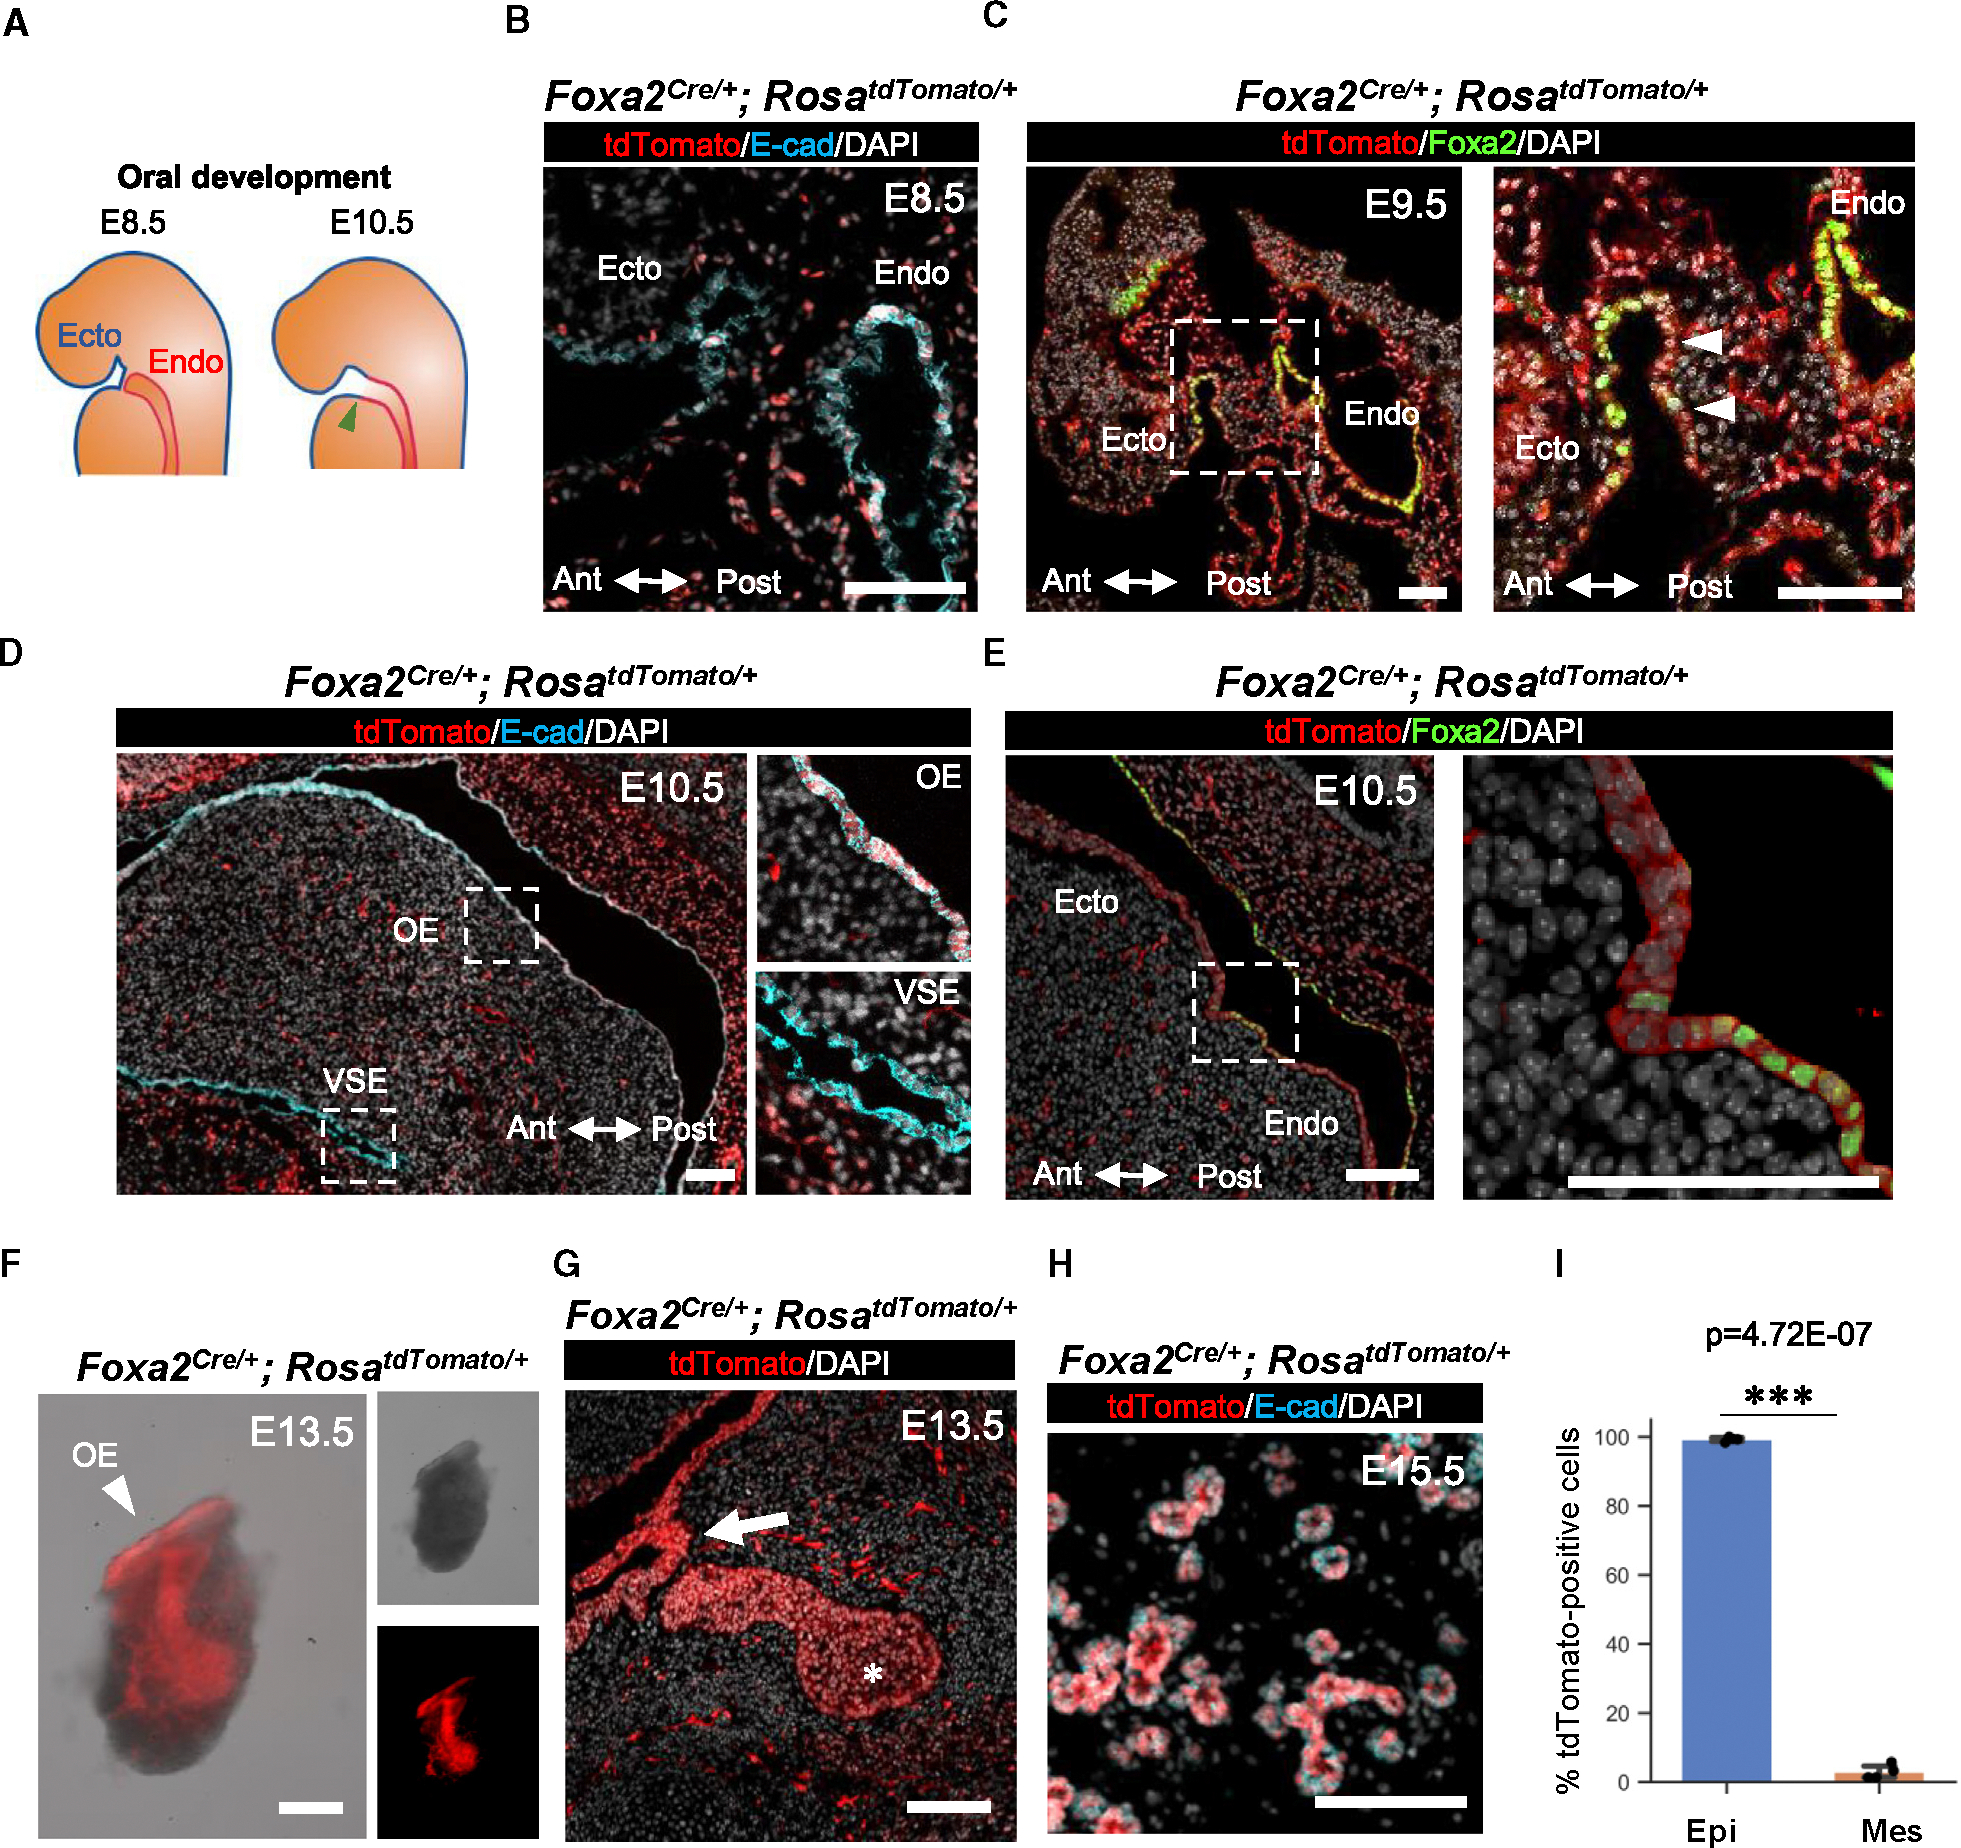
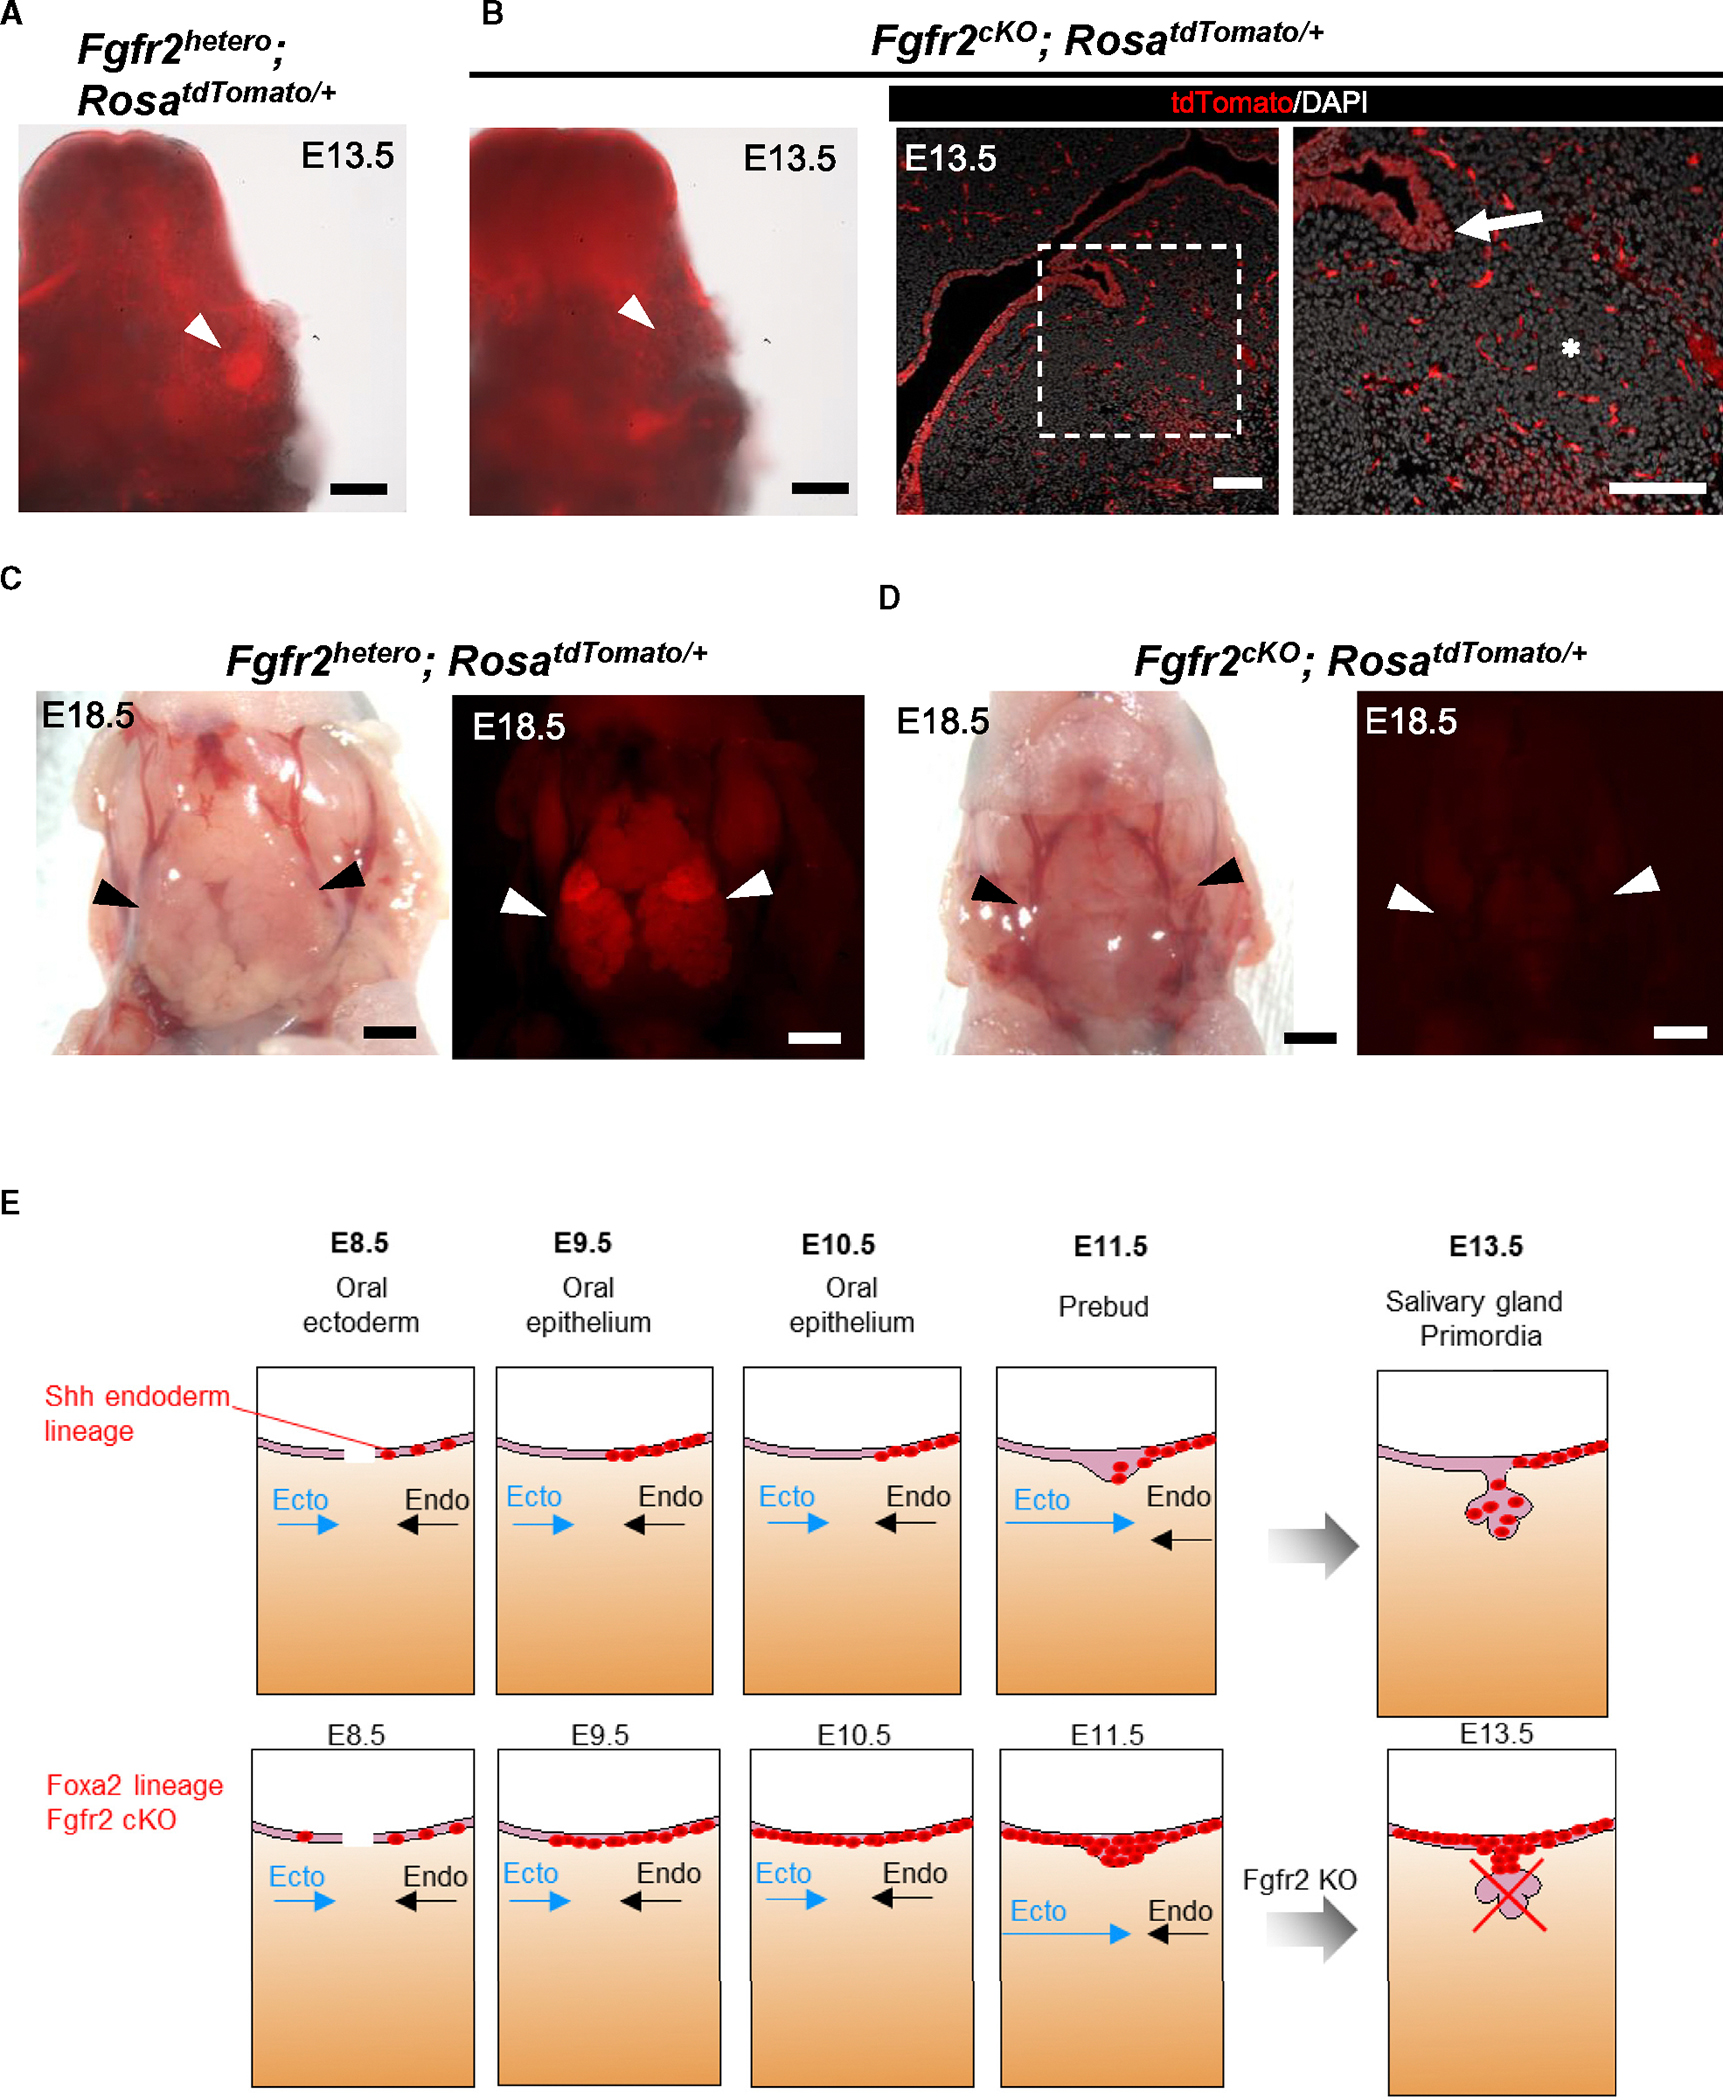
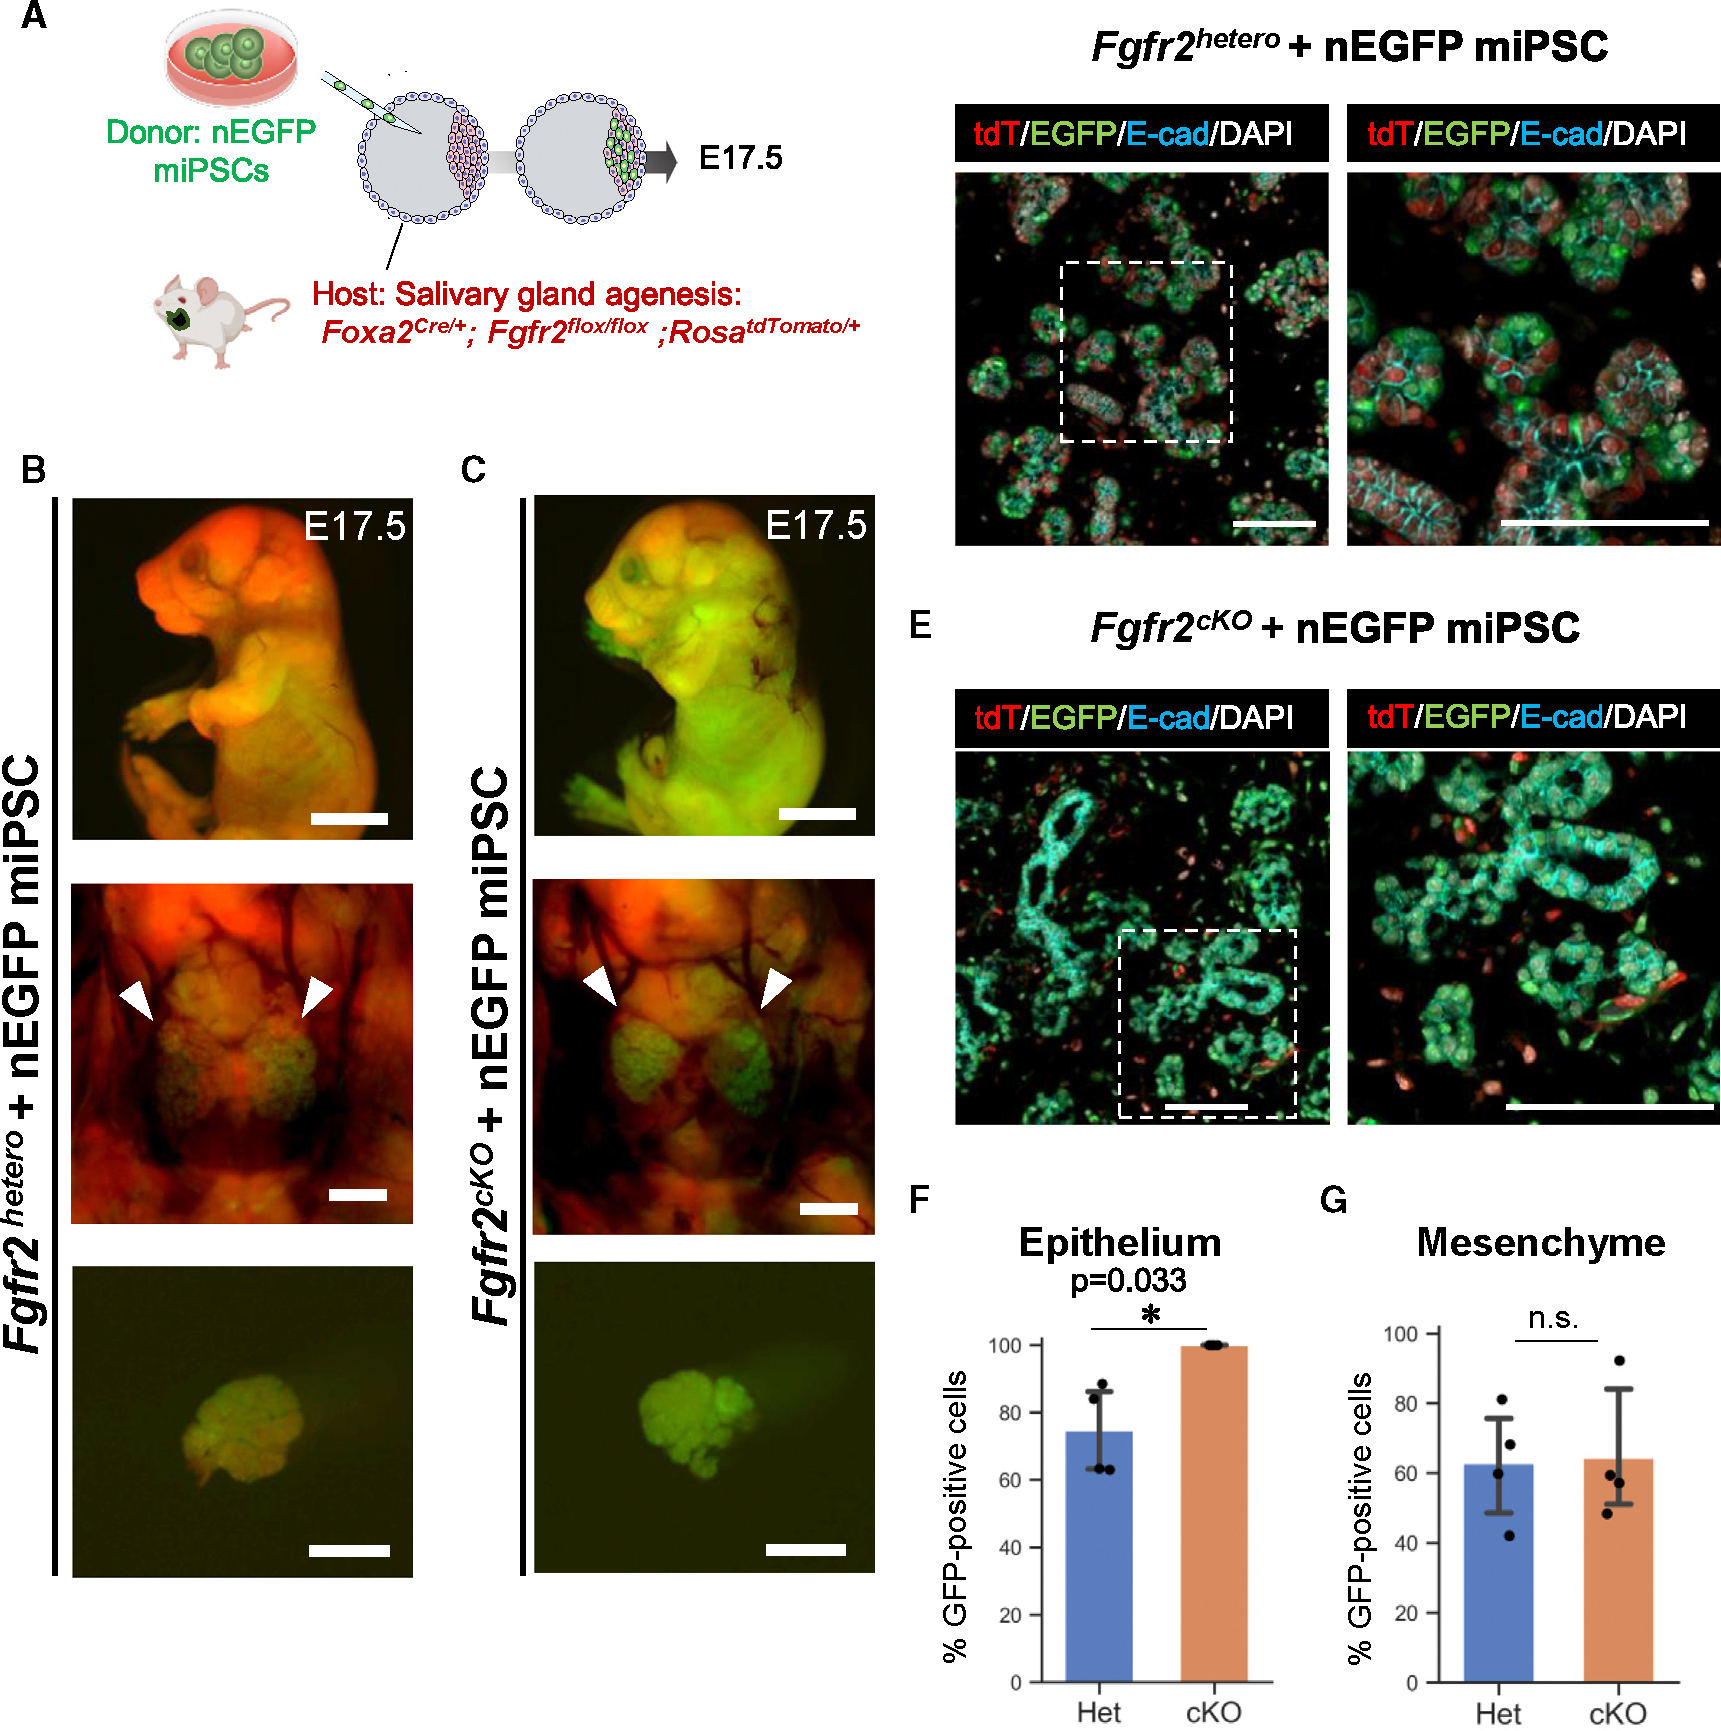
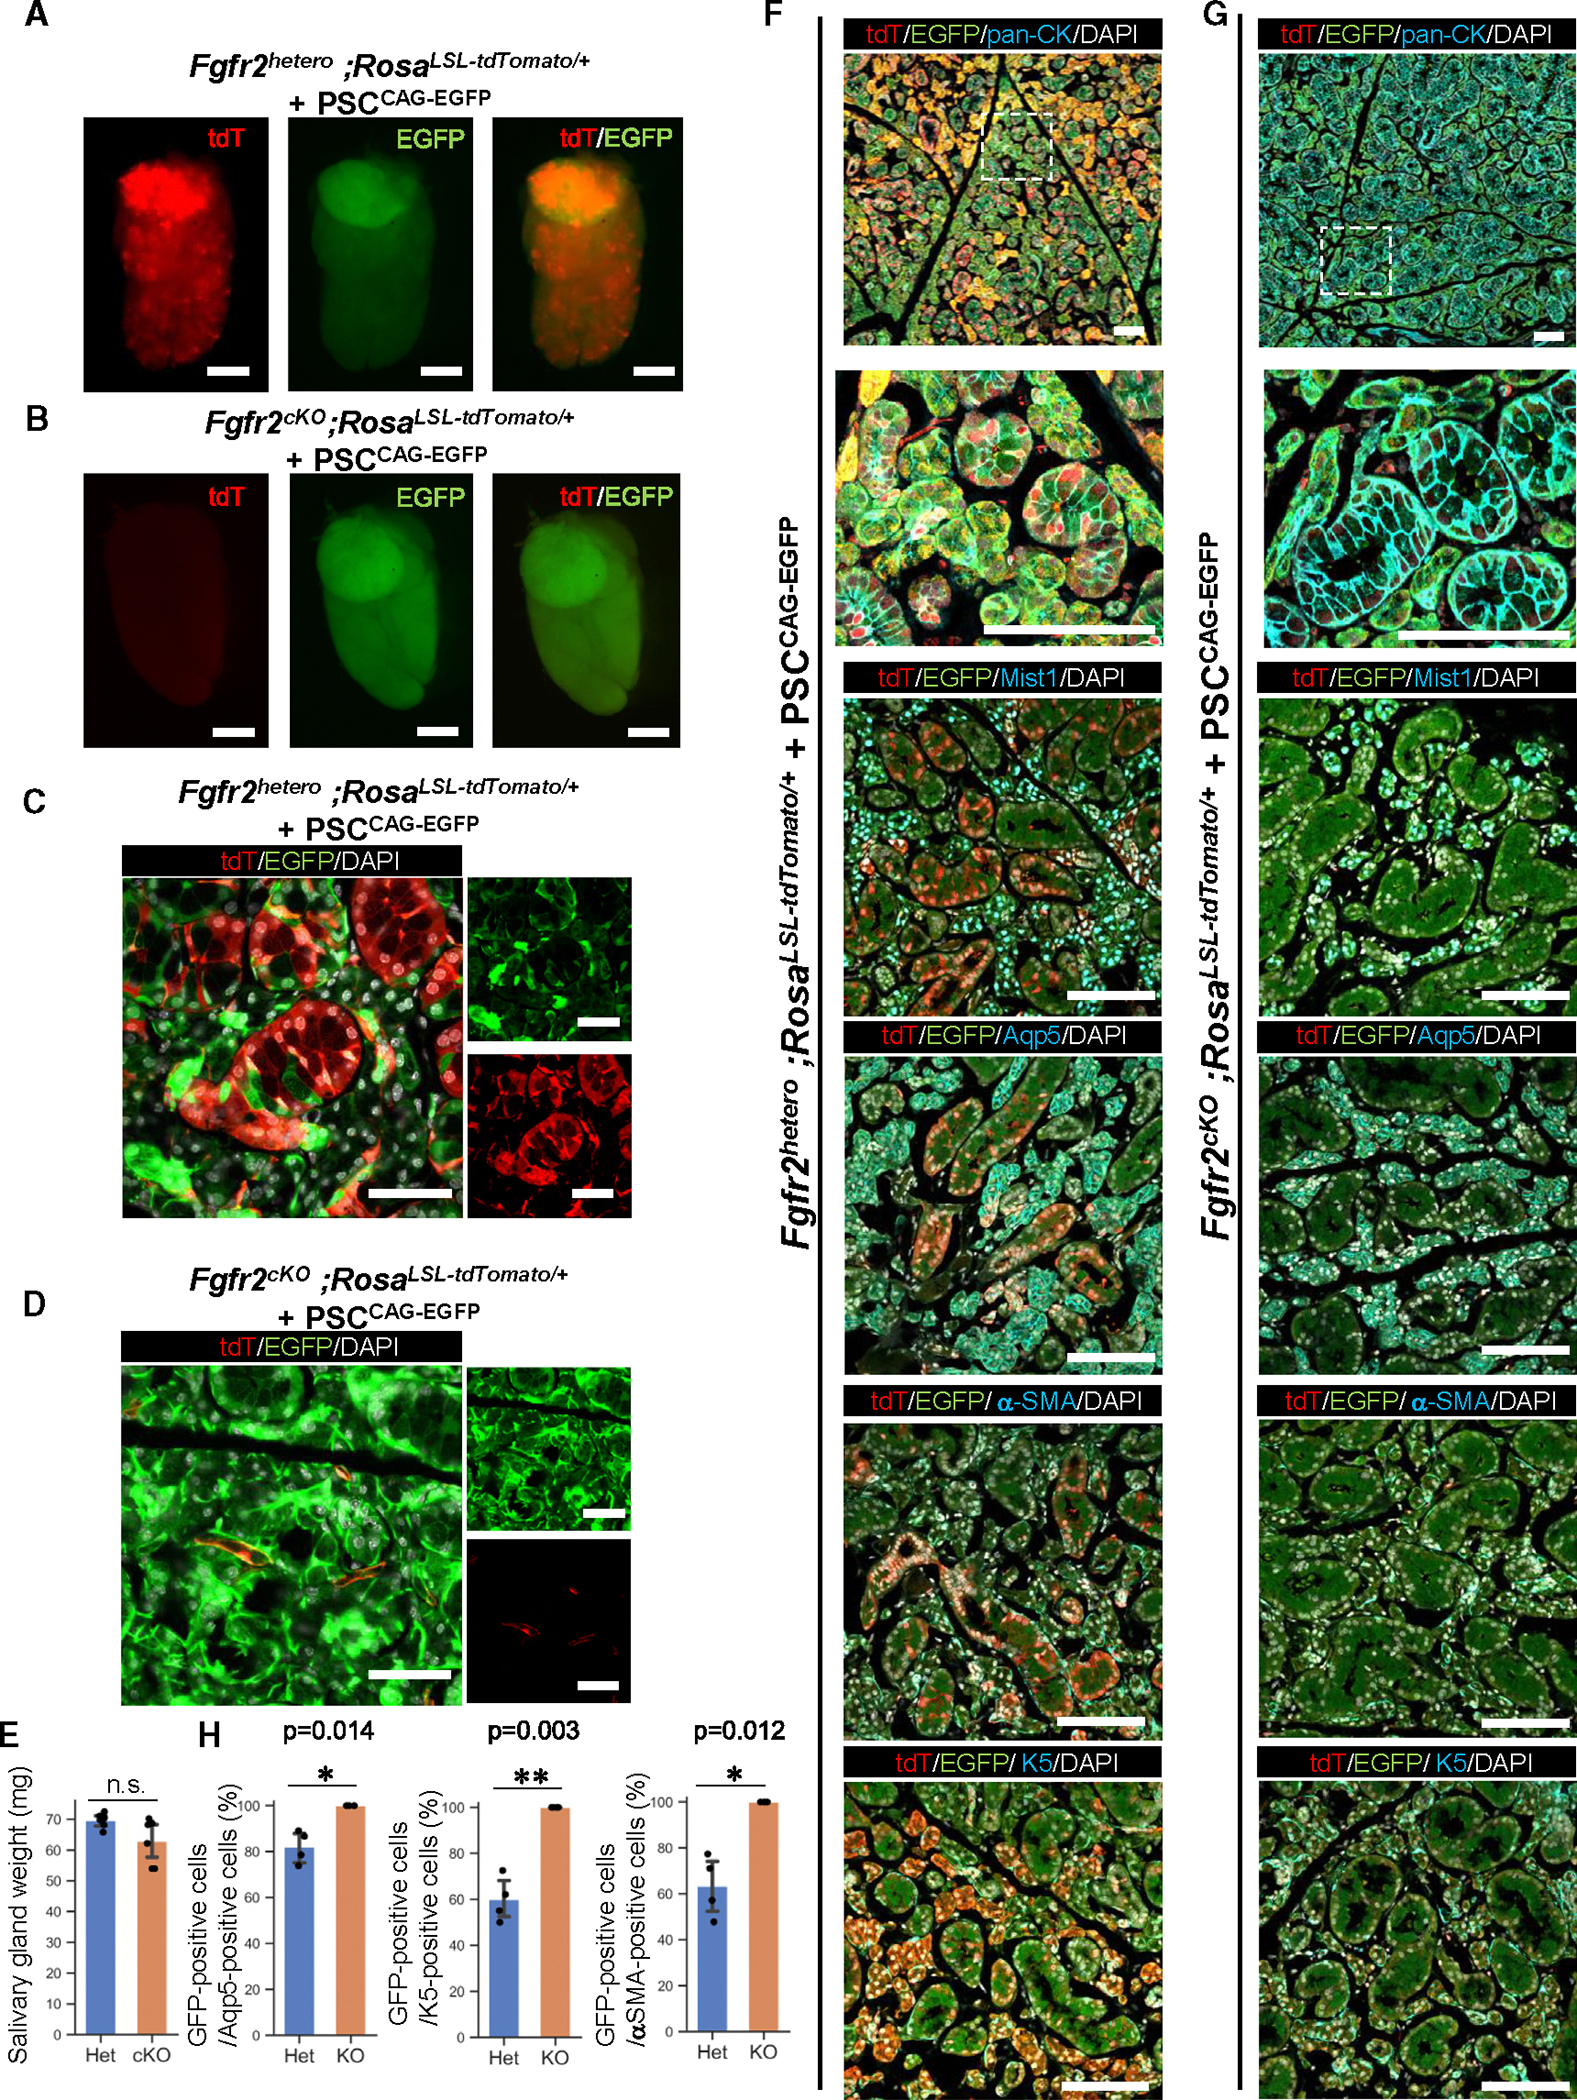
Whole salivary gland generation and transplantation offer potential therapies for salivary gland dysfunction. However, the specific lineage required to engineer complete salivary glands has remained elusive. In this study, we identify the Foxa2 lineage as a critical lineage for salivary gland development through conditional blastocyst complementation (CBC). Foxa2 lineage marking begins at the boundary between the endodermal and ectodermal regions of the oral epithelium before the formation of the primordial salivary gland, thereby labeling the entire gland. Ablation of Fgfr2 within the Foxa2 lineage in mice leads to salivary gland agenesis. We reversed this phenotype by injecting donor pluripotent stem cells into the mouse blastocysts, resulting in mice that survived to adulthood with salivary glands of normal size, comparable to those of their littermate controls. These findings demonstrate that CBC-based salivary gland regeneration serves as a foundational experimental approach for future advanced cell-based therapies.

Keywords: CP: Stem cell research; Fgfr2; blastocyst complementation; chimera; conditional blastocyst complementation; organ generation; pluripotent stem cell; saliva; salivary gland.


Conflict of interest statement

Declaration of interests The authors declare no competing interests.

Figures

Figure 1.
Figure 1.. Foxa2 lineage labeled the boundary region between the endoderm and ectoderm, leading to marking the whole salivary gland epithelium
(A) Schematics of the boundary region development located between endodermal (a red line) and ectodermal oral (a blue line) epithelial cells at embryonic day (E) 8.5 and E10.5 before salivary gland primordial formation. The green arrowhead indicates the boundary region of salivary gland development. Ecto, ectoderm; Endo, endoderm. (B–E) Representative immunofluorescence (IF)-confocal imaging of the ectodermal (Ecto) oral mucosal and endodermal (Endo) epithelial boundary in E8.5 (B), E9.5 (C), and E10.5 (D and E) Foxa2Cre/+; RosaLSL-tdTomato/+ lineage-tracing mice. Immunostaining of tdTomato: red, E-cadherin (E-cad): cyan, DAPI: gray, and Foxa2: green. Each right image of (C)–(E) is an enlarged image of a white dotted box. Ant, arteriolar; Post, posterior axis; VSE, ventral surface epidermis; OE, oral epithelium (n = 3 at each time point, biological replicates). (F) Representative merged image (left) of bright-field (top right) and tdTomato fluorescent signal (bottom right) of the isolated salivary gland from E13.5 Foxa2Cre/+; RosaLSL-tdTomato/+ lineage-tracing mice (n = 3). (G and H) Representative confocal imaging of E13.5 salivary gland primordium (G) and E15.5 salivary glands (H) of Foxa2Cre/+; RosaLSL-tdTomato/+ lineage-tracing mouse (n = 4). (I) Graphs: the morphometric lineage-tracing analysis: percentage of Foxa2 lineage labeling in E-cad+ epithelial (blue bar) and E-cad mesenchymal (orange bar) cells from E15.5 Foxa2Cre/+; RosaLSL-tdTomato/+ lineage-tracing mouse salivary glands (n = 4). Statistical analyses: unpaired Student’s t test, significant: p < 0.05. ***p < 0.001. Error bars represent mean ± SD. Scale bars: 100 μm.
Figure 2.
Figure 2.. Foxa2-driven Fgfr2 conditional knockout (Fgfr2cKO) caused the salivary gland agenesis phenotype
(A and B) Representative macroscopic merged images of bright-field and tdTomato fluorescent signals of salivary gland primordium formation (white arrowheads) from E13.5 Fgfr2hetero (Foxa2Cre/+; Fgfr2flox/+; RosaLSL-tdTomato/+) mice (A) and E13.5 Fgfr2cKO (Foxa2Cre/+; Fgfr2flox/flox; RosaLSL-tdTomato/+) mice: no salivary gland primordia formation (B, left). Representative IF-confocal imaging of the salivary gland rudiment in E13.5 Fgfr2cKO (Foxa2Cre/+; Fgfr2flox/flox; RosaLSL-tdTomato/+) mice (n = 3): no salivary gland primordium formation (asterisk), but invaginating of the OE occurs (arrow), indicating the salivary gland rudiment (B, middle and right). (C and D) Representative macroscopic bright-field images (left) and tdTomato fluorescent signals (right) of salivary glands (arrowhead) from E18.5 Fgfr2hetero (Foxa2Cre/+; Fgfr2flox/+; RosaLSL-tdTomato/+) (C) and E18.5 Fgfr2cKO (Foxa2Cre/+; Fgfr2flox/flox; RosaLSL-tdTomato/+) (D) mice (n = 3): salivary gland agenesis phenotype in the E18.5 Fgfr2cKO (Foxa2Cre/+; Fgfr2flox/flox; RosaLSL-tdTomato/+). tdTomato: red. (E) Proposed schematic models for the initial salivary gland development from the junction of Ecto oral mucosa and Endo epithelium based on Foxa2 or Shh lineage-tracing analysis: when Ecto oral mucosa (blue arrows) and Endo (arrows) epithelium are closer and connecting, Shh lineage (red)-labeled cells appeared only on the oral Endo side (black arrows) of the E8.5 and E9.5 boundary region but not the oral Ecto side of salivary gland precursors (SGPs) before the boundary formation. Later, the Shh lineage labeled nearly the entire E15.5 epithelium, supported by a previous study. In contrast, the Foxa2 lineage initiated labeling of the E8.5 SGP and the entire E9.5 SGP on the boundary region before the invagination of the SGPs. Therefore, the KO of Fgfr2 in the Foxa2 lineage resulted in the invagination of SGPs but failed to form salivary gland primordia, leading to the salivary gland agenesis phenotype. Scale bars: (B, left) 200 μm, (B, right) 100 μm, and (C and D) 1 mm.
Figure 3.
Figure 3.. Rescue of salivary gland agenesis phenotype of Fgfr2cKO mice by Foxa2 lineage-based CBC
(A) Schema of CBC experiment: we injected nuclear EGFP (nEGFP)+ mouse iPSCs (nEGFP miPSCs) into the blastocysts of Foxa2-driven Fgfr2cKO (Foxa2Cre/+; Fgfr2flox/flox; RosaLSL-tdTomato/+) mice or littermate controls: Fgfr2hetero mice (Foxa2Cre/+; Fgfr2flox/+; RosaLSL-tdTomato/+). (B and C) Representative images of fluorescent signals of the host (tdTomato: red) and donor nEGFP signal of nEGFP miPSCs (green) from embryos (top), salivary glands (middle: arrows), and isolated salivary glands (bottom) from the E17.5 chimeric mice of Fgfr2cKO+nEGFP miPSCs (C) or littermate controls: Fgfr2hetero+nEGFP miPSCs (B). (D and E) Representative IF-confocal imaging of the salivary glands in the E17.5 chimeric embryos of Fgfr2cKO+nEGFP miPSCs (E) or littermate controls: Fgfr2hetero+nEGFP miPSCs (D). Immunostaining of tdTomato: red, EGFP: green, E-cad: cyan, and DAPI: gray. Each right image of (D) and (E) is an enlarged image of a white dotted box. (F) Graphs: the morphometric analysis: percentage of nGFP+ donor cells in E-cad+ epithelial cells from E17.5 chimeric embryos of Fgfr2hetero+nEGFP miPSCs (n = 3 per biological replicates, 5 fields per group). (F and G) The morphometric analysis: percentage of nEGFP+ donor cells in E-cad+ epithelium (F) or E-cad mesenchyme (G) from E17.5 chimeric embryos of Fgfr2cKO+nEGFP miPSCs or littermate controls: Fgfr2hetero+nEGFP miPSCs (n = 4 per biological replicates, 5 fields per group). Statistical analyses: unpaired Student’s t test, significant: *p < 0.05. No significant change, n.s. Error bars represent mean ± SD. Scale bars: (B and C) 5 mm (top) and 1 mm (middle and bottom) and (D and E) 100 μm.
Figure 4.
Figure 4.. Fully mature adult salivary gland generation via Foxa2 lineage-based CBC
(A and B) Representative images of fluorescent signals of the host (tdTomato: red) and donor EGFP signal of PSCCAG-EGFP (green) from isolated salivary glands from the 4-week-old chimeric mice of littermate controls: Fgfr2hetero, PSCCAG-EGFP (A) or of Fgfr2cKO, PSCCAG-EGFP (B). (C and D) Representative confocal imaging for native fluorescence signals of the salivary glands in the 4-week-old chimeric embryos of littermate controls:

Fgfr2hetero, PSCCAG-EGFP (C) or Fgfr2cKO, PSCCAG-EGFP (D). (E) Analysis of salivary gland weight. The combined weight of the submandibular gland and the sublingual gland was measured. Het: Fgfr2hetero, PSCCAG-EGFP, cKO: Fgfr2cK, PSCCAG-EGFP. Statistical analyses: unpaired Student’s t test, significant: p < 0.05. No significant change, n.s. Error bars represent mean ± SD. (F and G) Representative IF-confocal imaging of the salivary gland from the 4-week-old chimeric mice of littermate controls: Fgfr2hetero, PSCCAG-EGFP (F) or Fgfr2cKO, PSCCAG-EGFP (G). The second image from the top is an enlarged image of a white dotted box. Scale bars: 100 μm. (H) The morphometric analysis: percentage of EGFP+ donor cells in Aqp5+ acinar cells (left), percentage of EGFP+ donor cells in K5+ basal cells (middle), percentage of EGFP+ donor cells in α-Sma+ myoepithelial cells (right) from the 4-week-old chimeric mice of littermate controls: Fgfr2hetero, PSCCAG-EGFP (Het) or Fgfr2cKO, PSCCAG-EGFP (KO) (n = 4 per biological replicates, 5 fields per group). Statistical analyses: unpaired Student’s t test, significant: p < 0.05. No significant change, n.s. *p < 0.05 and **p < 0.01. Error bars represent mean ± SD. Scale bars: (A and B) 2 mm and (D) 50 μm.

Update of

Similar articles

Cited by

References

    1. Atkinson JC, Grisius M, and Massey W (2005). Salivary hypofunction and xerostomia: diagnosis and treatment. Dent. Clin. North Am. 49, 309–326. - PubMed
    1. Zhang C, Li Y, Zhang X-Y, Liu L, Tong H-Z, Han T-L, Li W-D, Jin X-L, Yin N-B, Song T, et al. (2017). Therapeutic potential of human minor salivary gland epithelial progenitor cells in liver regeneration. Sci. Rep. 7, 12707. - PMC - PubMed
    1. Feng J, van der Zwaag M, Stokman MA, van Os R, and Coppes RP (2009). Isolation and characterization of human salivary gland cells for stem cell transplantation to reduce radiation-induced hyposalivation. Radiother. Oncol. 92, 466–471. - PubMed
    1. Srinivasan PP, Patel VN, Liu S, Harrington DA, Hoffman MP, Jia X, Witt RL, Farach-Carson MC, and Pradhan-Bhatt S (2017). Primary Salivary Human Stem/Progenitor Cells Undergo Microenvironment-Driven Acinar-Like Differentiation in Hyaluronate Hydrogel Culture. Stem Cells Transl. Med. 6, 110–120. - PMC - PubMed
    1. Pringle S, Maimets M, Van Der Zwaag M, Stokman MA, Van Gosliga D, Zwart E, Witjes MJH, De Haan G, Van Os R, and Coppes RP (2016). Human salivary gland stem cells functionally restore radiation damaged salivary glands. Stem Cell. 34, 640–652. - PubMed

MeSH terms

Substances

LinkOut - more resources