. 2024 Jun 25;43(6):114330.
doi: 10.1016/j.celrep.2024.114330. Epub 2024 Jun 11.

CGG repeats in the human FMR1 gene regulate mRNA localization and cellular stress in developing neurons

Affiliations

CGG repeats in the human FMR1 gene regulate mRNA localization and cellular stress in developing neurons

Carissa L Sirois et al. Cell Rep. .

Abstract

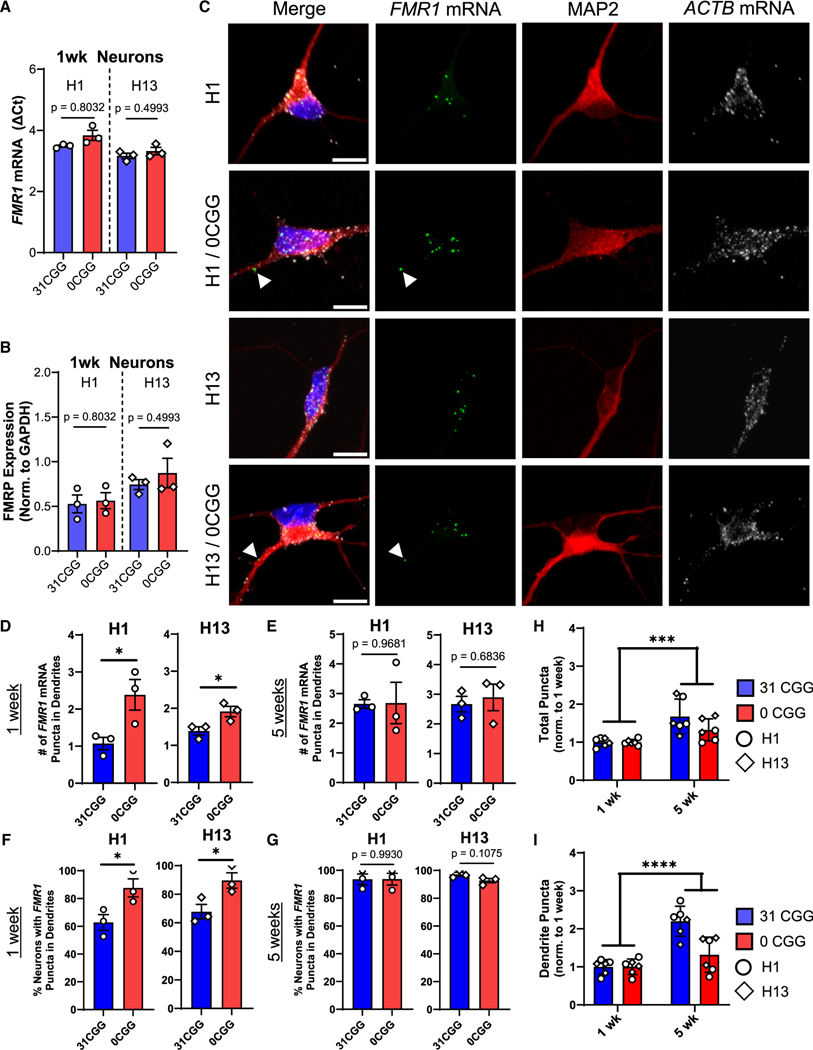
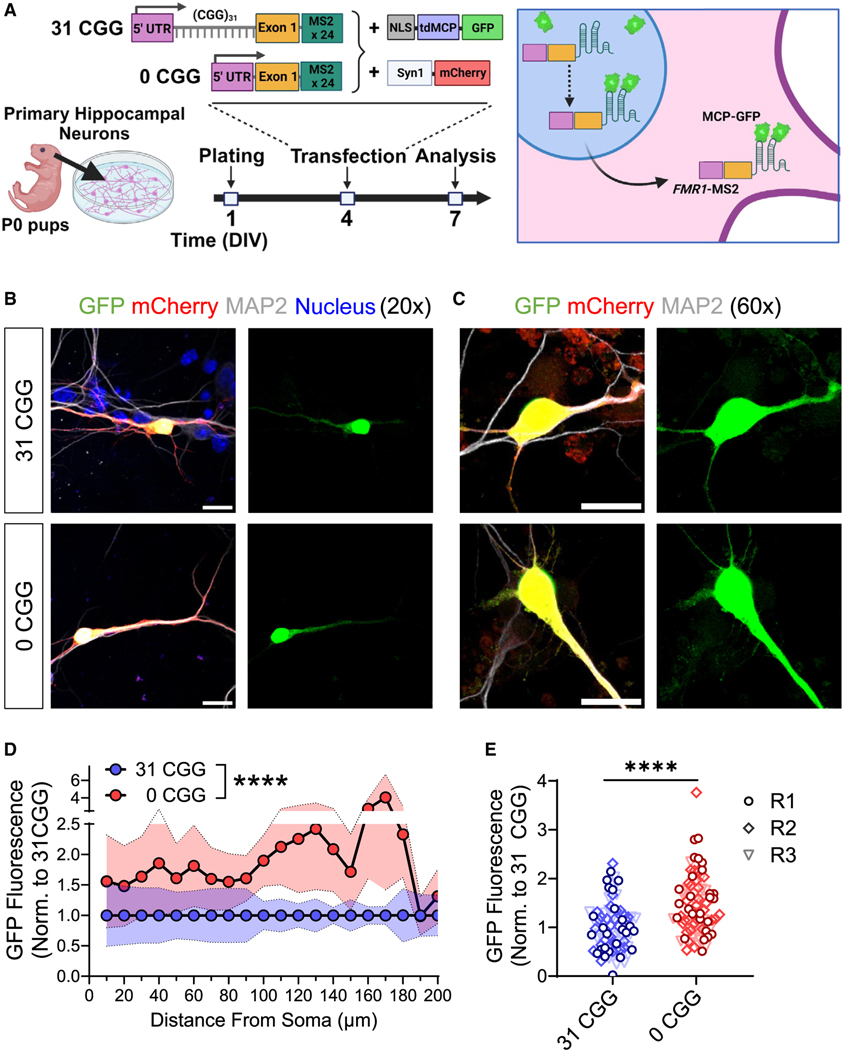
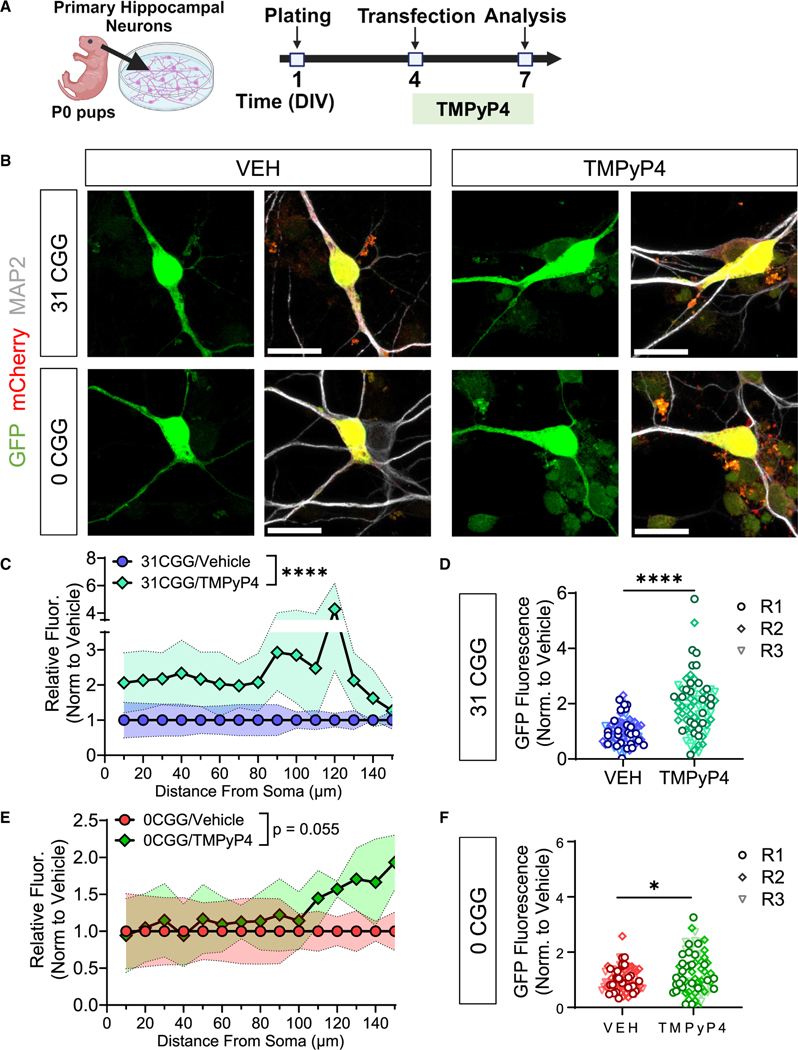
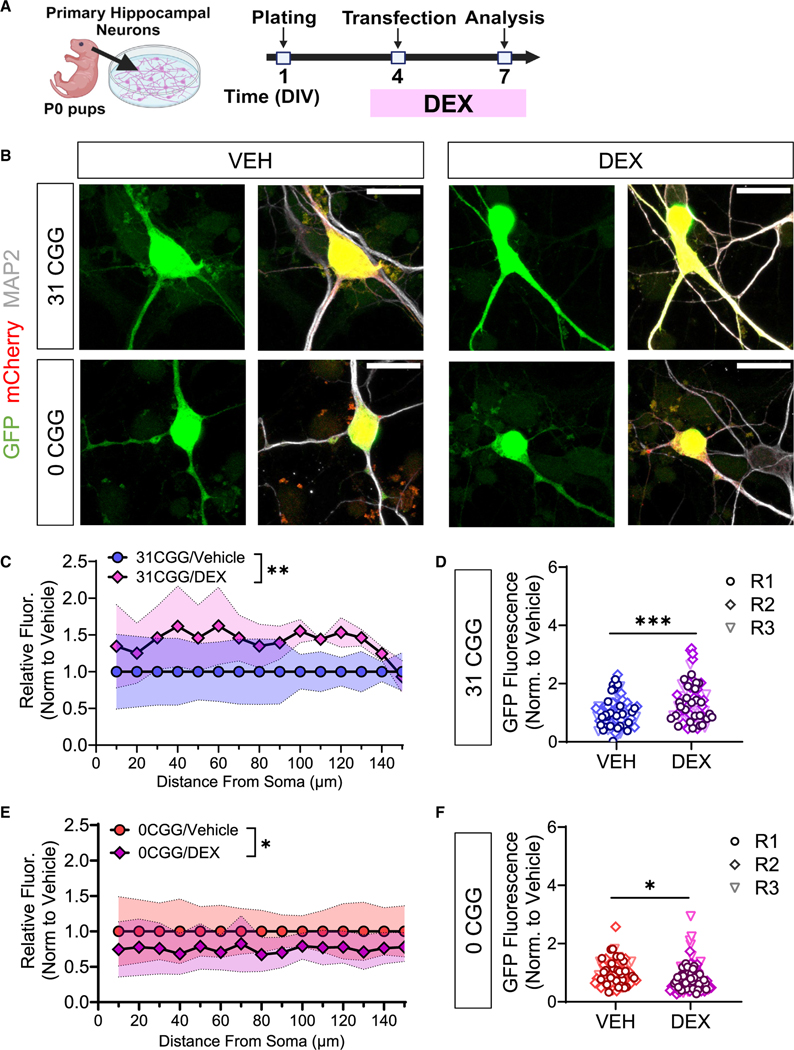
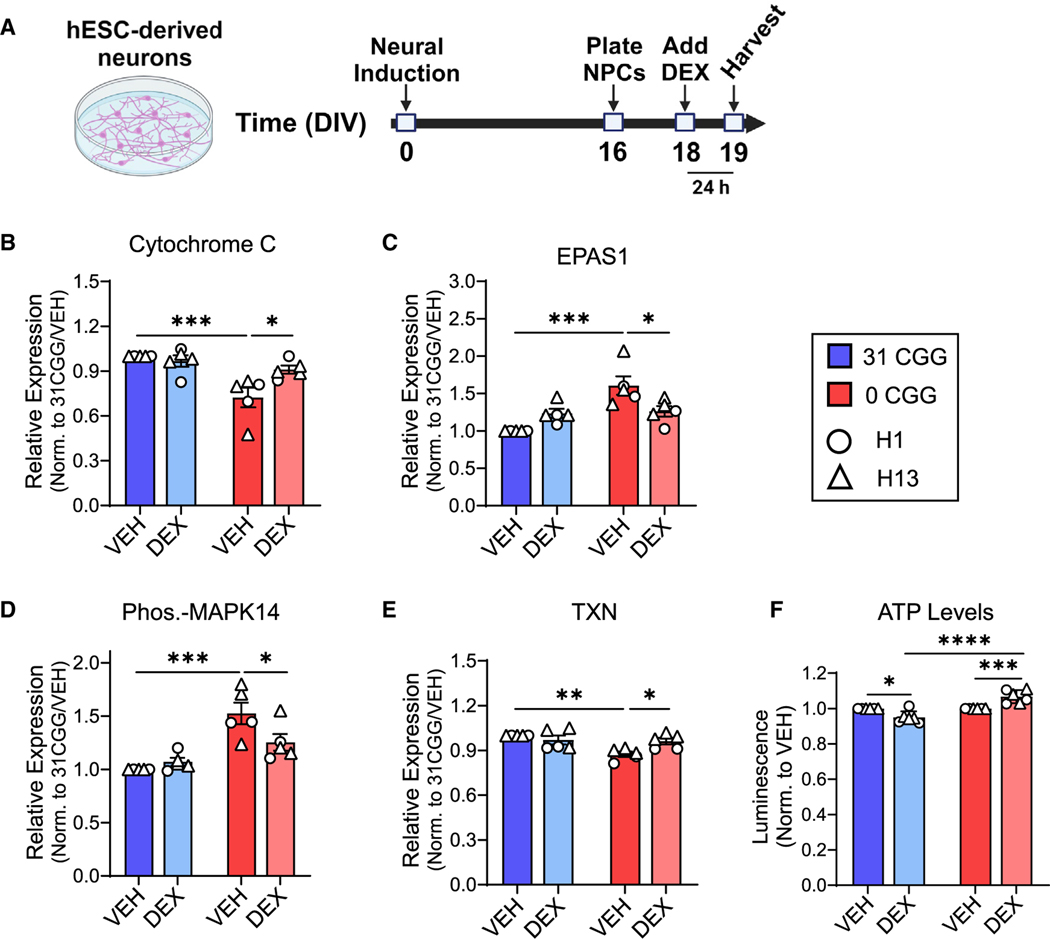
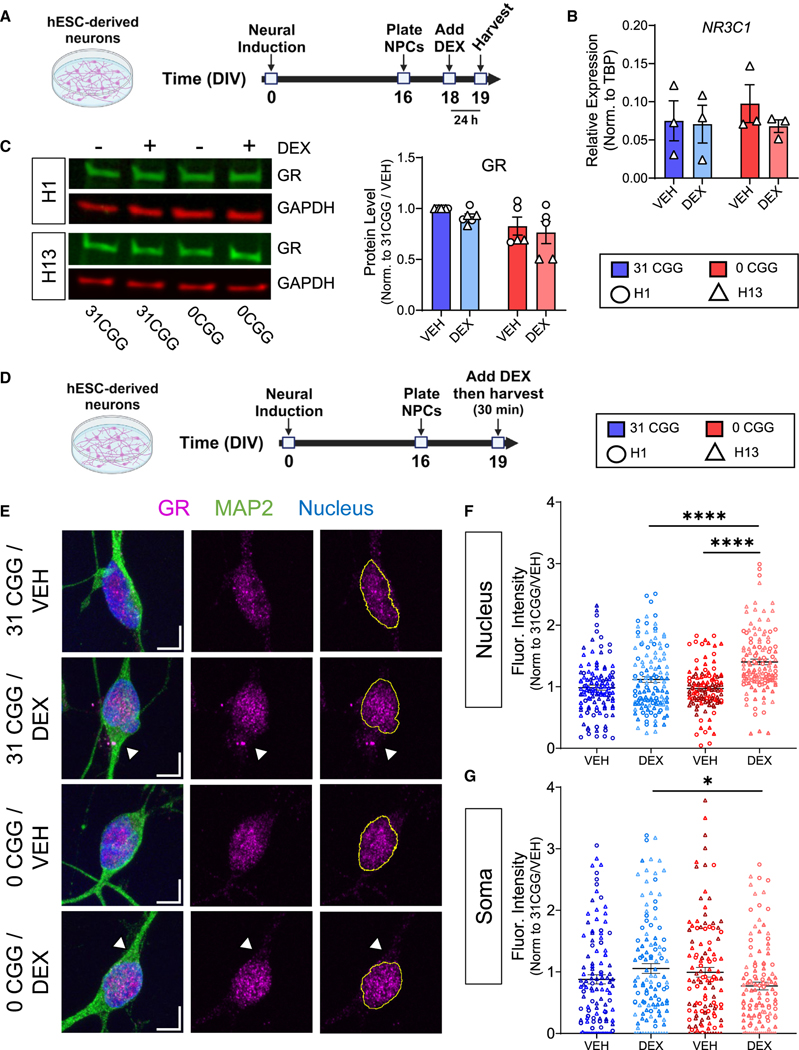
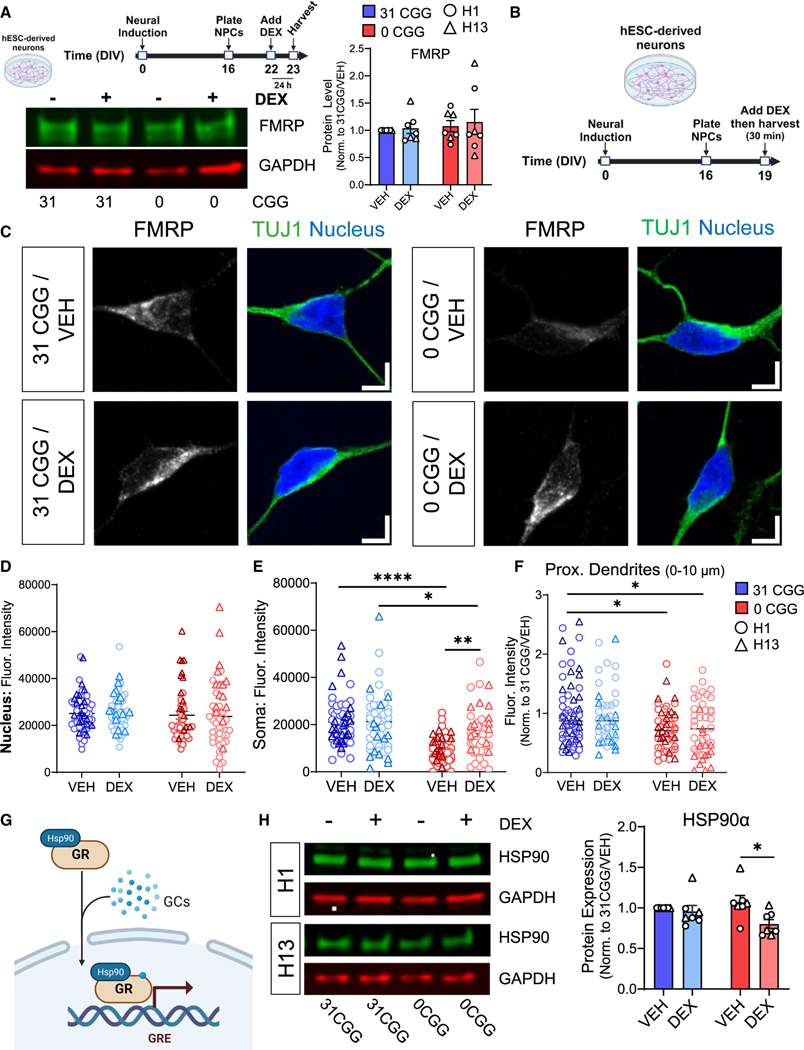
The human genome has many short tandem repeats, yet the normal functions of these repeats are unclear. The 5' untranslated region (UTR) of the fragile X messenger ribonucleoprotein 1 (FMR1) gene contains polymorphic CGG repeats, the length of which has differing effects on FMR1 expression and human health, including the neurodevelopmental disorder fragile X syndrome. We deleted the CGG repeats in the FMR1 gene (0CGG) in human stem cells and examined the effects on differentiated neurons. 0CGG neurons have altered subcellular localization of FMR1 mRNA and protein, and differential expression of cellular stress proteins compared with neurons with normal repeats (31CGG). In addition, 0CGG neurons have altered responses to glucocorticoid receptor (GR) activation, including FMR1 mRNA localization, GR chaperone HSP90α expression, GR localization, and cellular stress protein levels. Therefore, the CGG repeats in the FMR1 gene are important for the homeostatic responses of neurons to stress signals.

Keywords: 5′ UTR; CGG repeats; CP: Molecular biology; CP: Neuroscience; FMR1; FMRP; HSP90; RNA localization; dexamethasone; fragile X syndrome; glucocorticoid receptor; human-specific; neuron; pluripotent stem cells; single molecule FISH; stress; trinucleotide repeats.


Conflict of interest statement

Declaration of interests The authors declare no competing interests.

Figures

Figure 1.
Figure 1.. Removal of CGG repeats promotes localization of FMR1 mRNA to dendrites of early post-mitotic neurons
(A and B) FMR1 mRNA levels (A) and FMRP protein levels (B) in hESC-derived neurons at 1 week of differentiation. See Figure S1J for representative blot images. n = 3 independent batches of differentiation per line. (c) Representative confocal images showing FMR1 and ACTB mRNA puncta in hESC-derived neurons stained for post-mitotic neuron marker, MAP2 (red). Blue, nuclear staining using DAPI. Scale bar, 10 μm. (D and E) Quantification of the number of FMR1 mRNA puncta in the dendrites of neurons. n = 3 technical replicates from a single batch of neurons for N = 2 isogenic hESC lines. Each data point represents the average of ≥11 neurons. (F and G) Percentage of neurons containing at least 1 FMR1 mRNA puncta in their dendrites at 1 week (F) and at 5 weeks (G). (H and I) Comparison of total FMR1 mRNA puncta (H) and dendritic FMR1 mRNA puncta (I) in 1 week versus 5 week neurons, with all data normalized to the 1-week time point. n = 3 technical replicates from a single batch of neurons for N = 2 isogenic hESC lines. Each data point represents the average of ≥11 neurons. Error bars indicate SEM. (A, B, and D–G): two-tailed Student’s t test *p < 0.05. (H and I) Two-way ANOVA, significant main effect of time; ***p < 0.005, ****p < 0.001.
Figure 2.
Figure 2.. Expression of the human FMR1 5′ UTR in mouse neurons recapitulates CGG repeat-mediated differences in dendritic mRNA localization
(A) Schematic illustration of transfection of primary mouse hippocampal neurons with MS2 and Syn1-mCherry constructs and timing of experiments. (B and C) Representative confocal images of MS2-transfected neurons at 20× magnification (B) and 60× magnification (C). Scale bars, 25 μm (B), 20 μm (C). Green, MS2-reporter; red, Synapsin-mCherry reporter; white, MAP2 (post-mitotic neuron label; blue, nuclear staining using Hoechst. (D) Quantification the GFP fluorescence intensity along the length of primary dendrites of GFP+/mCherry+/MAP2+ neurons. Shaded area indicates SEM. (E) Summation of the fluorescence intensity in primary dendrites, normalized for dendritic length. Each data point represents single neurons. Data in D and E are from N = 3 independent neuronal isolations/biological replicates (R1–R3; 22–29 neurons per replicate). Values were normalized to 31 CGG condition for each batch of neurons. (D) Two-way ANOVA, significant main effect of genotype ****p < 0.001. (E) Welch’s t test ****p < 0.001.
Figure 3.
Figure 3.. Localization of mRNA with normal length CGG repeats is mediated by GQs
(A) Schematic illustration of the timing of primary mouse hippocampal neuron transfection and TMPyP4 treatment. (B) Representative confocal images of MS2-transfected neurons treated with VEH (left) or TMPyP4 (right) at 60× magnification. Scale bar, 20 μm. Green, MS2-reporter; red, Synapsin-mCherry reporter; white, MAP2 (postmitotic neuron marker). (C and E) Quantification the GFP fluorescence intensity along the length of primary dendrites of GFP+/mCherry+/MAP2+ neurons transfected with 31 CGG (C) or 0 CGG (E) plasmids. Shaded area indicates SEM. (D and F) Summation of the fluorescence intensity in primary dendrites, normalized for dendritic length in 31 CGG (D) or 0 CGG (F) transfected neurons. Each data point represents single neurons (R1–R3). Data in (C–F) are from N = 3 independent neuronal isolations/biological replicates (18–29 neurons per replicate). Values were normalized to vehicle (VEH) condition for each batch of neurons. (C and E) Two-way ANOVA, significant main effect of treatment ****p < 0.001. (D and F) Welch’s t test; *p < 0.05; ****p < 0.001.
Figure 4.
Figure 4.. CGG repeat-dependent effects of GR activation on FMR1 mRNA localization
(A) Schematic illustration of the timing of primary mouse hippocampal neuron transfection and DEX treatment. (B) Representative maximum intensity confocal images of MS2-transfected neurons treated with VEH (left) or DEX (right). Scale bar, 20 μm. Green, MS2-reporter; red, Synapsin-mCherry reporter; white, MAP2 (postmitotic neuron marker). (C and E) Quantification the GFP fluorescence intensity along the length of primary dendrites of GFP+/mCherry+/MAP2+ neurons transfected with 31 CGG (C) or 0 CGG (E) plasmids. Shaded area indicates SEM. (D and F) Summation of the fluorescence intensity in primary dendrites, normalized for dendritic length in 31 CGG (D) or 0 CGG (F) transfected neurons. Each data point represents single neurons (R1–R3). Data in (C–F) are from N = 3 independent neuronal isolations/biological replicates (19–30 neurons per replicate). Values were normalized to vehicle (VEH) condition for each batch of neurons. (C and E) Two-way ANOVA, significant min effect of treatment *p < 0.05, **p < 0.01. (D and F) Welch’s t test; *p < 0.05; ***p < 0.005.
Figure 5.
Figure 5.. Removal of CGG repeats from the FMR1 5’ UTR leads to altered cellular stress and response to GR activation
(A) Schematic showing the timing of DEX treatment in hESC-derived neurons. (B–E) Quantification of total protein levels in VEH-treated versus DEX-treated neurons: cytochrome c (B), EPAS1 (C), phosphorylated-MAPK14 (D), and TXN (E). Data are from n = 5 independent neuronal differentiations from N = 2 cell lines. (F) ATP levels in DEX-treated neurons. (Left) H1 and H1–0CGG. (Right) H13 and H13–0CGG. Data shown are from n = 3 independent neuronal differentiations per line. DEX data point for each batch of cells was normalized to matched VEH control. Error bars indicate SEM. (B–F) Two-way ANOVA with Tukey’s multiple comparison’s test; *p < 0.05, **p < 0.01, ***p < 0.005, ****p < 0.001.
Figure 6.
Figure 6.. Removal of CGG repeats from the FMR1 5’ UTR affects GR subcellular localization after DEX treatment
(A) Schematic showing the timing of DEX treatment in hESC-derived neurons. (B) qRT-PCR data showing NR3C1 mRNA levels in H13 and H13–0CGG neurons. n = 3 independent differentiations. Error bars indicate SEM. (C) GR protein levels in DEX-treated hESC-derived neurons. (Left) Representative western blot images from H1 and H13 neurons. (Right) Quantification of GR protein levels. n = 5–6 independent batches of differentiation from N = 2 cell lines. Data shown are normalized to 31 CGG-VEH condition. Error bars indicate SEM. (D) Schematic showing the timing of acute DEX treatment of hESC-derived neurons. (E) Representative confocal images of the GR receptor expression in MAP2+ neurons. Scale bars, 5 μm. Arrowheads demonstrate differences in soma GR signal in DEX-treated 31CGG and 0CGG neurons. Magenta, GR; green, MAP2 (postmitotic neuron marker); blue, nuclear staining using Hoechst. (F and G) Quantification of GR fluorescent signal in nucleus (F) and soma (G). n = 111–125 individual neurons from N = 2 cell lines. (B and C) Two-way ANOVA. (F) Brown-Forsythe and Welch ANOVA test followed by Games-Howell’s multiple comparison’s test, ****p < 0.001. (G) One-way ANOVA followed by Tukey’s multiple comparison’s test, *p < 0.05.
Figure 7.
Figure 7.. Removal of CGG repeats from the FMR1 5′ UTR leads to decreased levels of GR chaperone protein HSP90α following DEX treatment
(A) Total FMRP levels in neurons treated with DEX for 24 h. (Top left) A schematic diagram showing the timeline for DEX treatment. (Bottom left) Representative western blots from H13 and H13–0CGG neurons treated with DEX. (Right) Quantification of FMRP protein levels from Western blots. n = 7 technical replicates from N = 2 isogenic pairs of cells (three independent batches of differentiation and DEX treatment per line). Error bars indicate SEM. (B) Schematic showing the timing of DEX treatment in hESC-derived neurons. (C) Representative confocal images showing FMRP localization in TUJ1+ (green) neurons. (Left) 31 CGG. (Right) 0 CGG. Blue, nuclear staining using Hoechst. Scale bar, 5 μm. (D–F) Quantification of FMRP signal in the nucleus (D), soma (E), and proximal dendrites (first 10 μm proximal to soma, F). Data shown in (F) are normalized to 31 CGG-VEH condition. (D and E) n = 48–57 neurons from N = 2 cell lines. (F) n = 44–60 neurons from N = 2 cell lines. (G) Schematic illustrating the role of chaperone protein HSP90α in GR nuclear translocation. (H) HSP90α protein levels in DEX-treated hESC-derived neurons. (Left) Representative western blots from H1 and H13 neurons treated with DEX. (Right) Quantification of GR protein levels. n = 7 independent batches of differentiation from N = 2 cell lines. Error bars indicate SEM. (A, D–F, and H) Two-way ANOVA followed by Tukey’s multiple comparison’s test, *p < 0.05, **p < 0.01, ****p < 0.001.

Similar articles

Cited by

References

    1. Lander ES, Linton LM, Birren B, Nusbaum C, Zody MC, Baldwin J, Devon K, Dewar K, Doyle M, FitzHugh W, et al. (2001). Initial sequencing and analysis of the human genome. Nature 409, 860–921. 10.1038/35057062. - DOI - PubMed
    1. Fan Y, Shen S, Yang J, Yao D, Li M, Mao C, Wang Y, Hao X, Ma D, Li J, et al. (2022). GIPC1 CGG Repeat Expansion Is Associated with Movement Disorders. Ann. Neurol. 91, 704–715. 10.1002/ana.26325. - DOI - PubMed
    1. Erwin GS, Gursoy G, Al-Abri R, Suriyaprakash A, Dolzhenko E, Zhu K, Hoerner CR, White SM, Ramirez L, Vadlakonda A, et al. (2023). Recurrent repeat expansions in human cancer genomes. Nature 613, 96–102. 10.1038/s41586-022-05515-1. - DOI - PMC - PubMed
    1. Rafehi H, Read J, Szmulewicz DJ, Davies KC, Snell P, Fearnley LG, Scott L, Thomsen M, Gillies G, Pope K, et al. (2023). An intronic GAA repeat expansion in FGF14 causes the autosomal-dominant adult-onset ataxia SCA27B/ATX-FGF14. Am. J. Hum. Genet. 110, 1018. 10.1016/j.ajhg.2023.05.005. - DOI - PMC - PubMed
    1. Malik I, Kelley CP, Wang ET, and Todd PK (2021). Molecular mechanisms underlying nucleotide repeat expansion disorders. Nat. Rev. Mol. Cell Biol. 22, 589–607. 10.1038/s41580-021-00382-6. - DOI - PMC - PubMed

Publication types

MeSH terms

LinkOut - more resources