

An α-ketoglutarate conformational switch controls iron accessibility, activation, and substrate selection of the human FTO protein
- PMID: 38865275
- PMCID: PMC11194561
- DOI: 10.1073/pnas.2404457121
An α-ketoglutarate conformational switch controls iron accessibility, activation, and substrate selection of the human FTO protein
Abstract
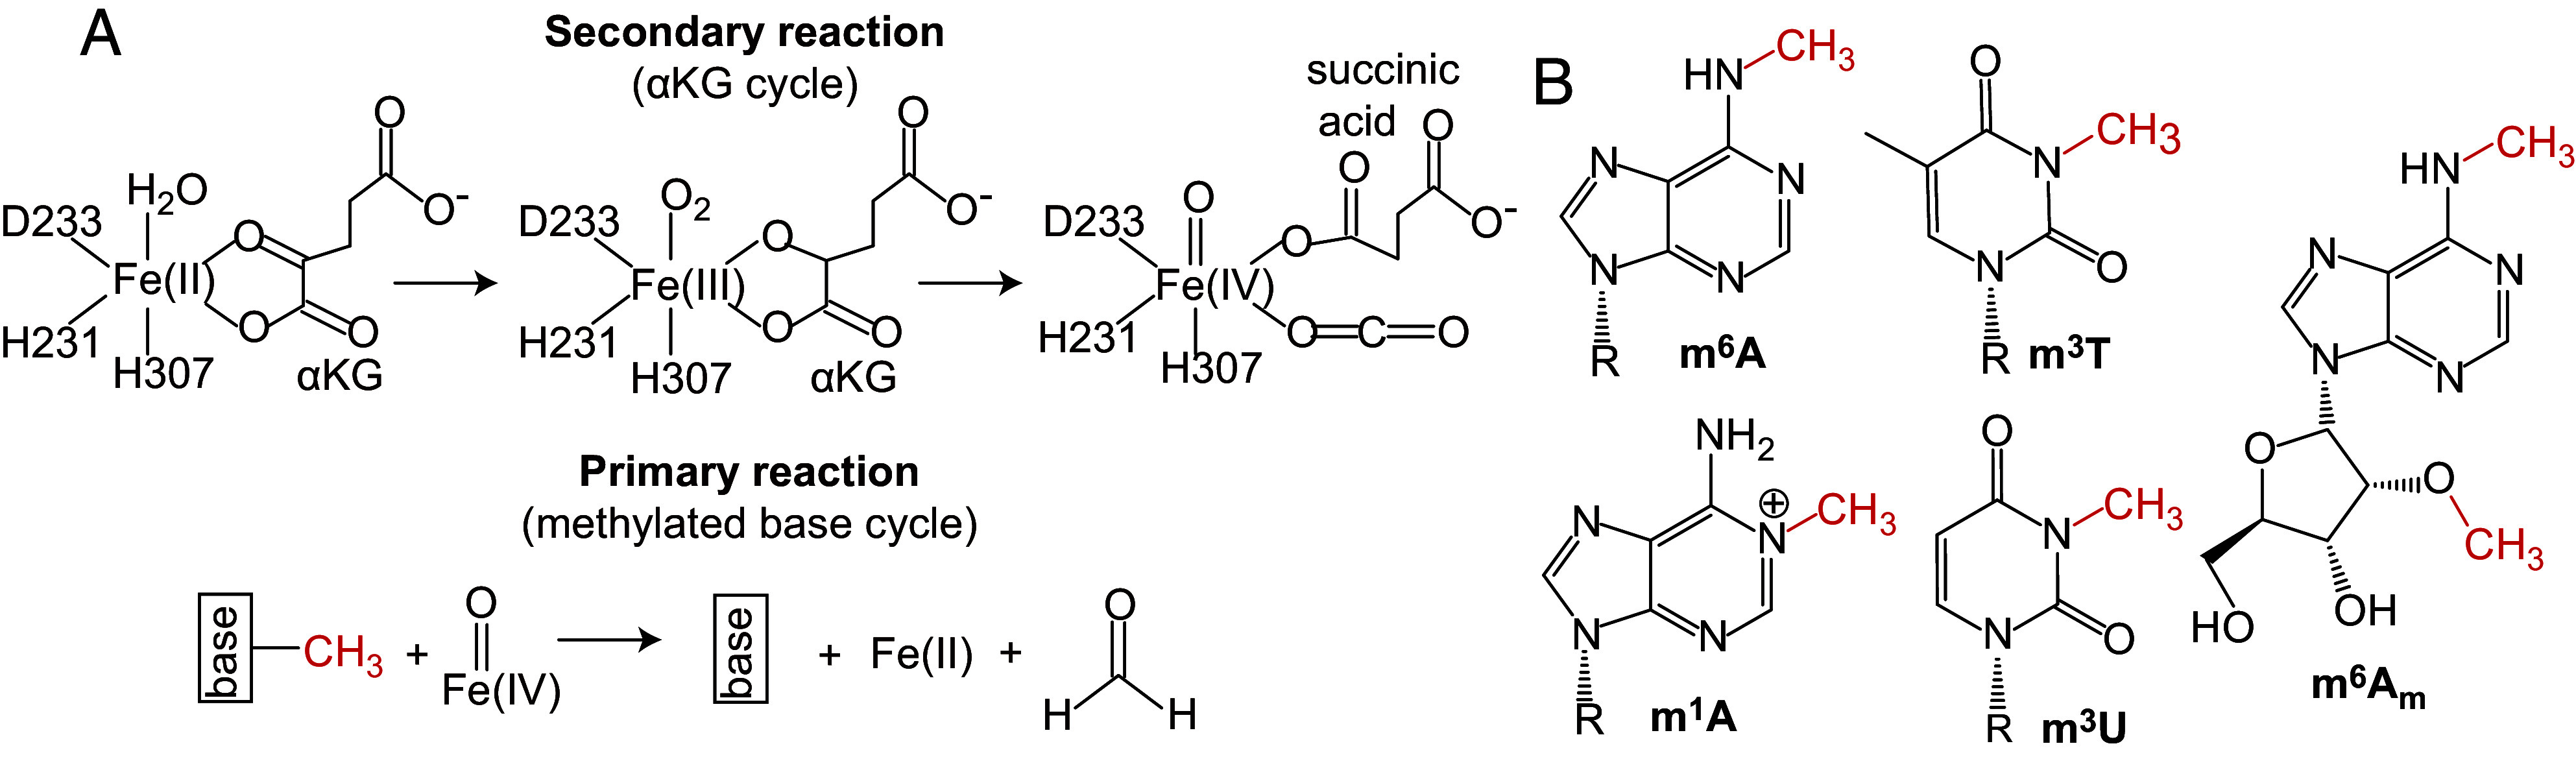
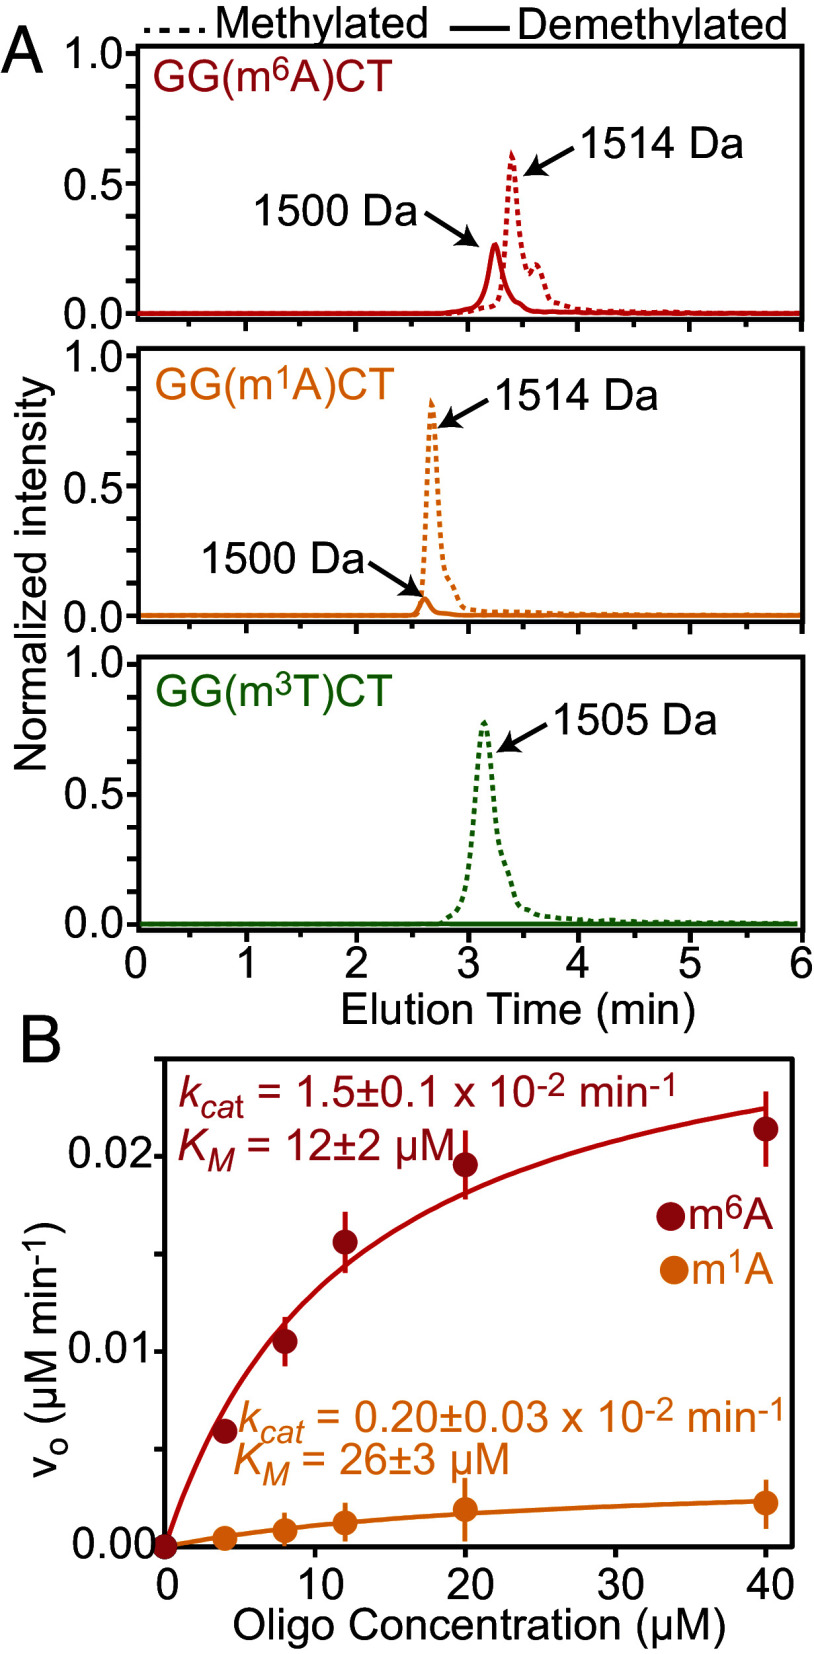
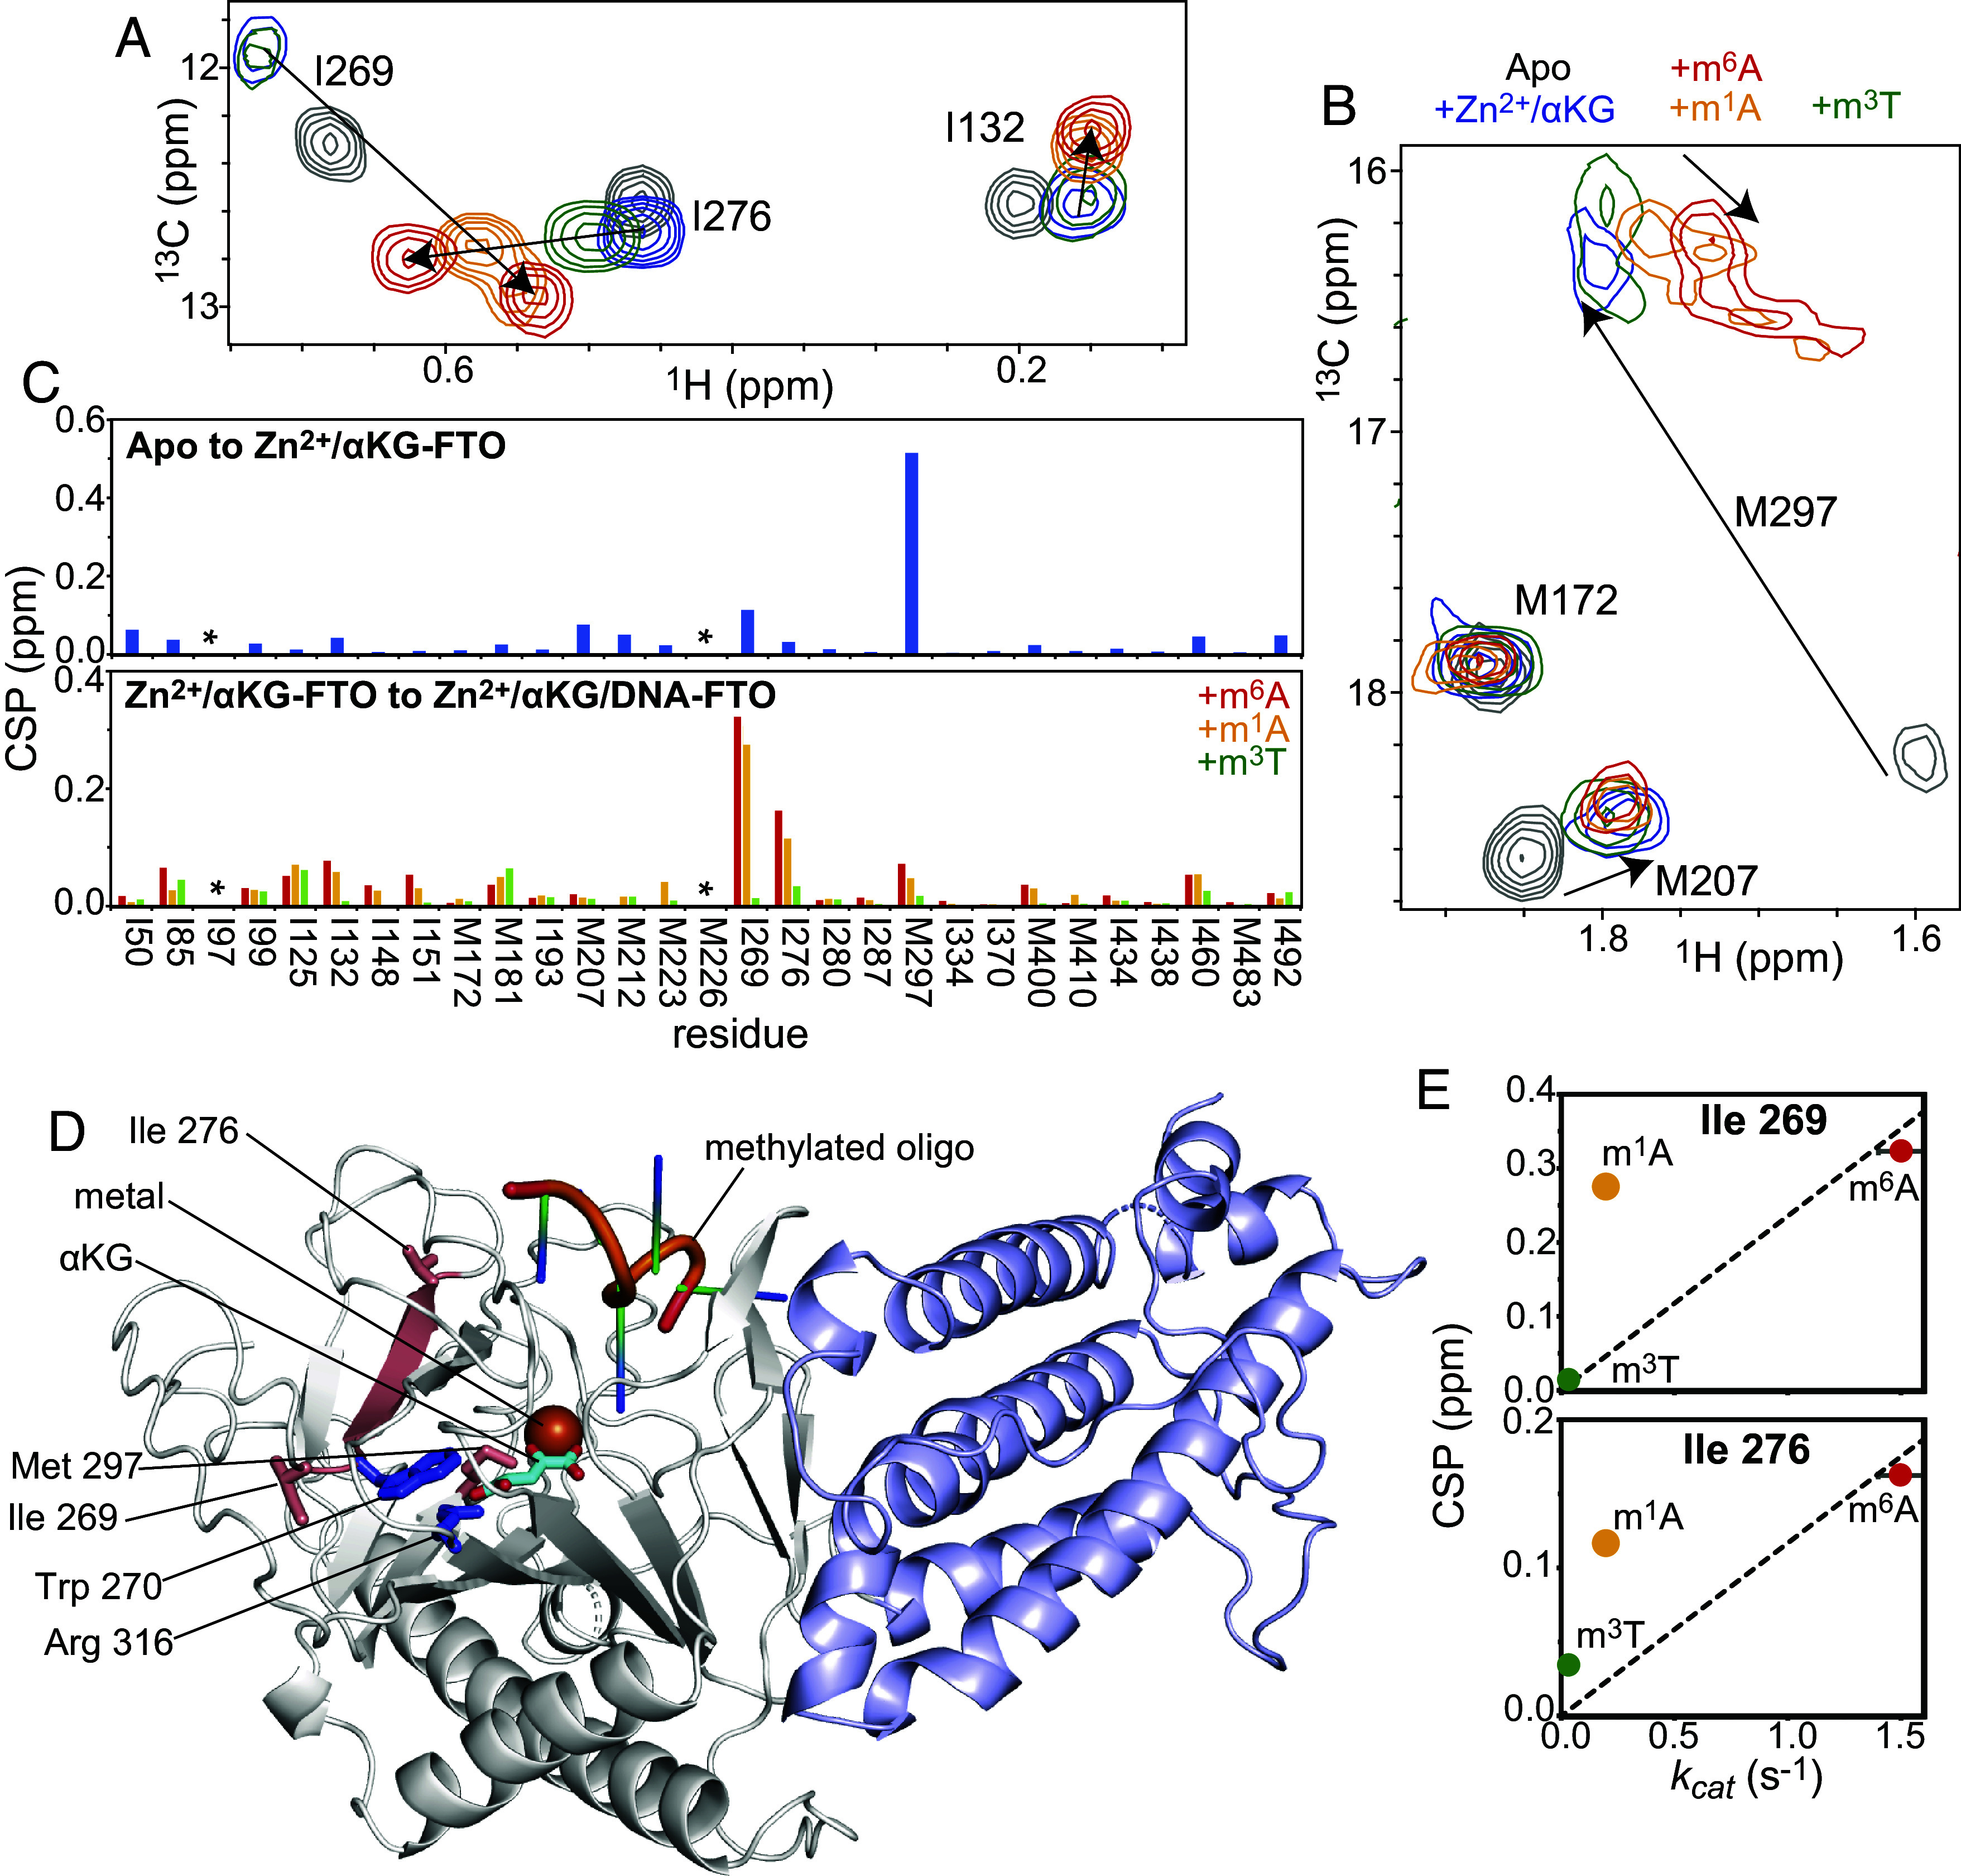
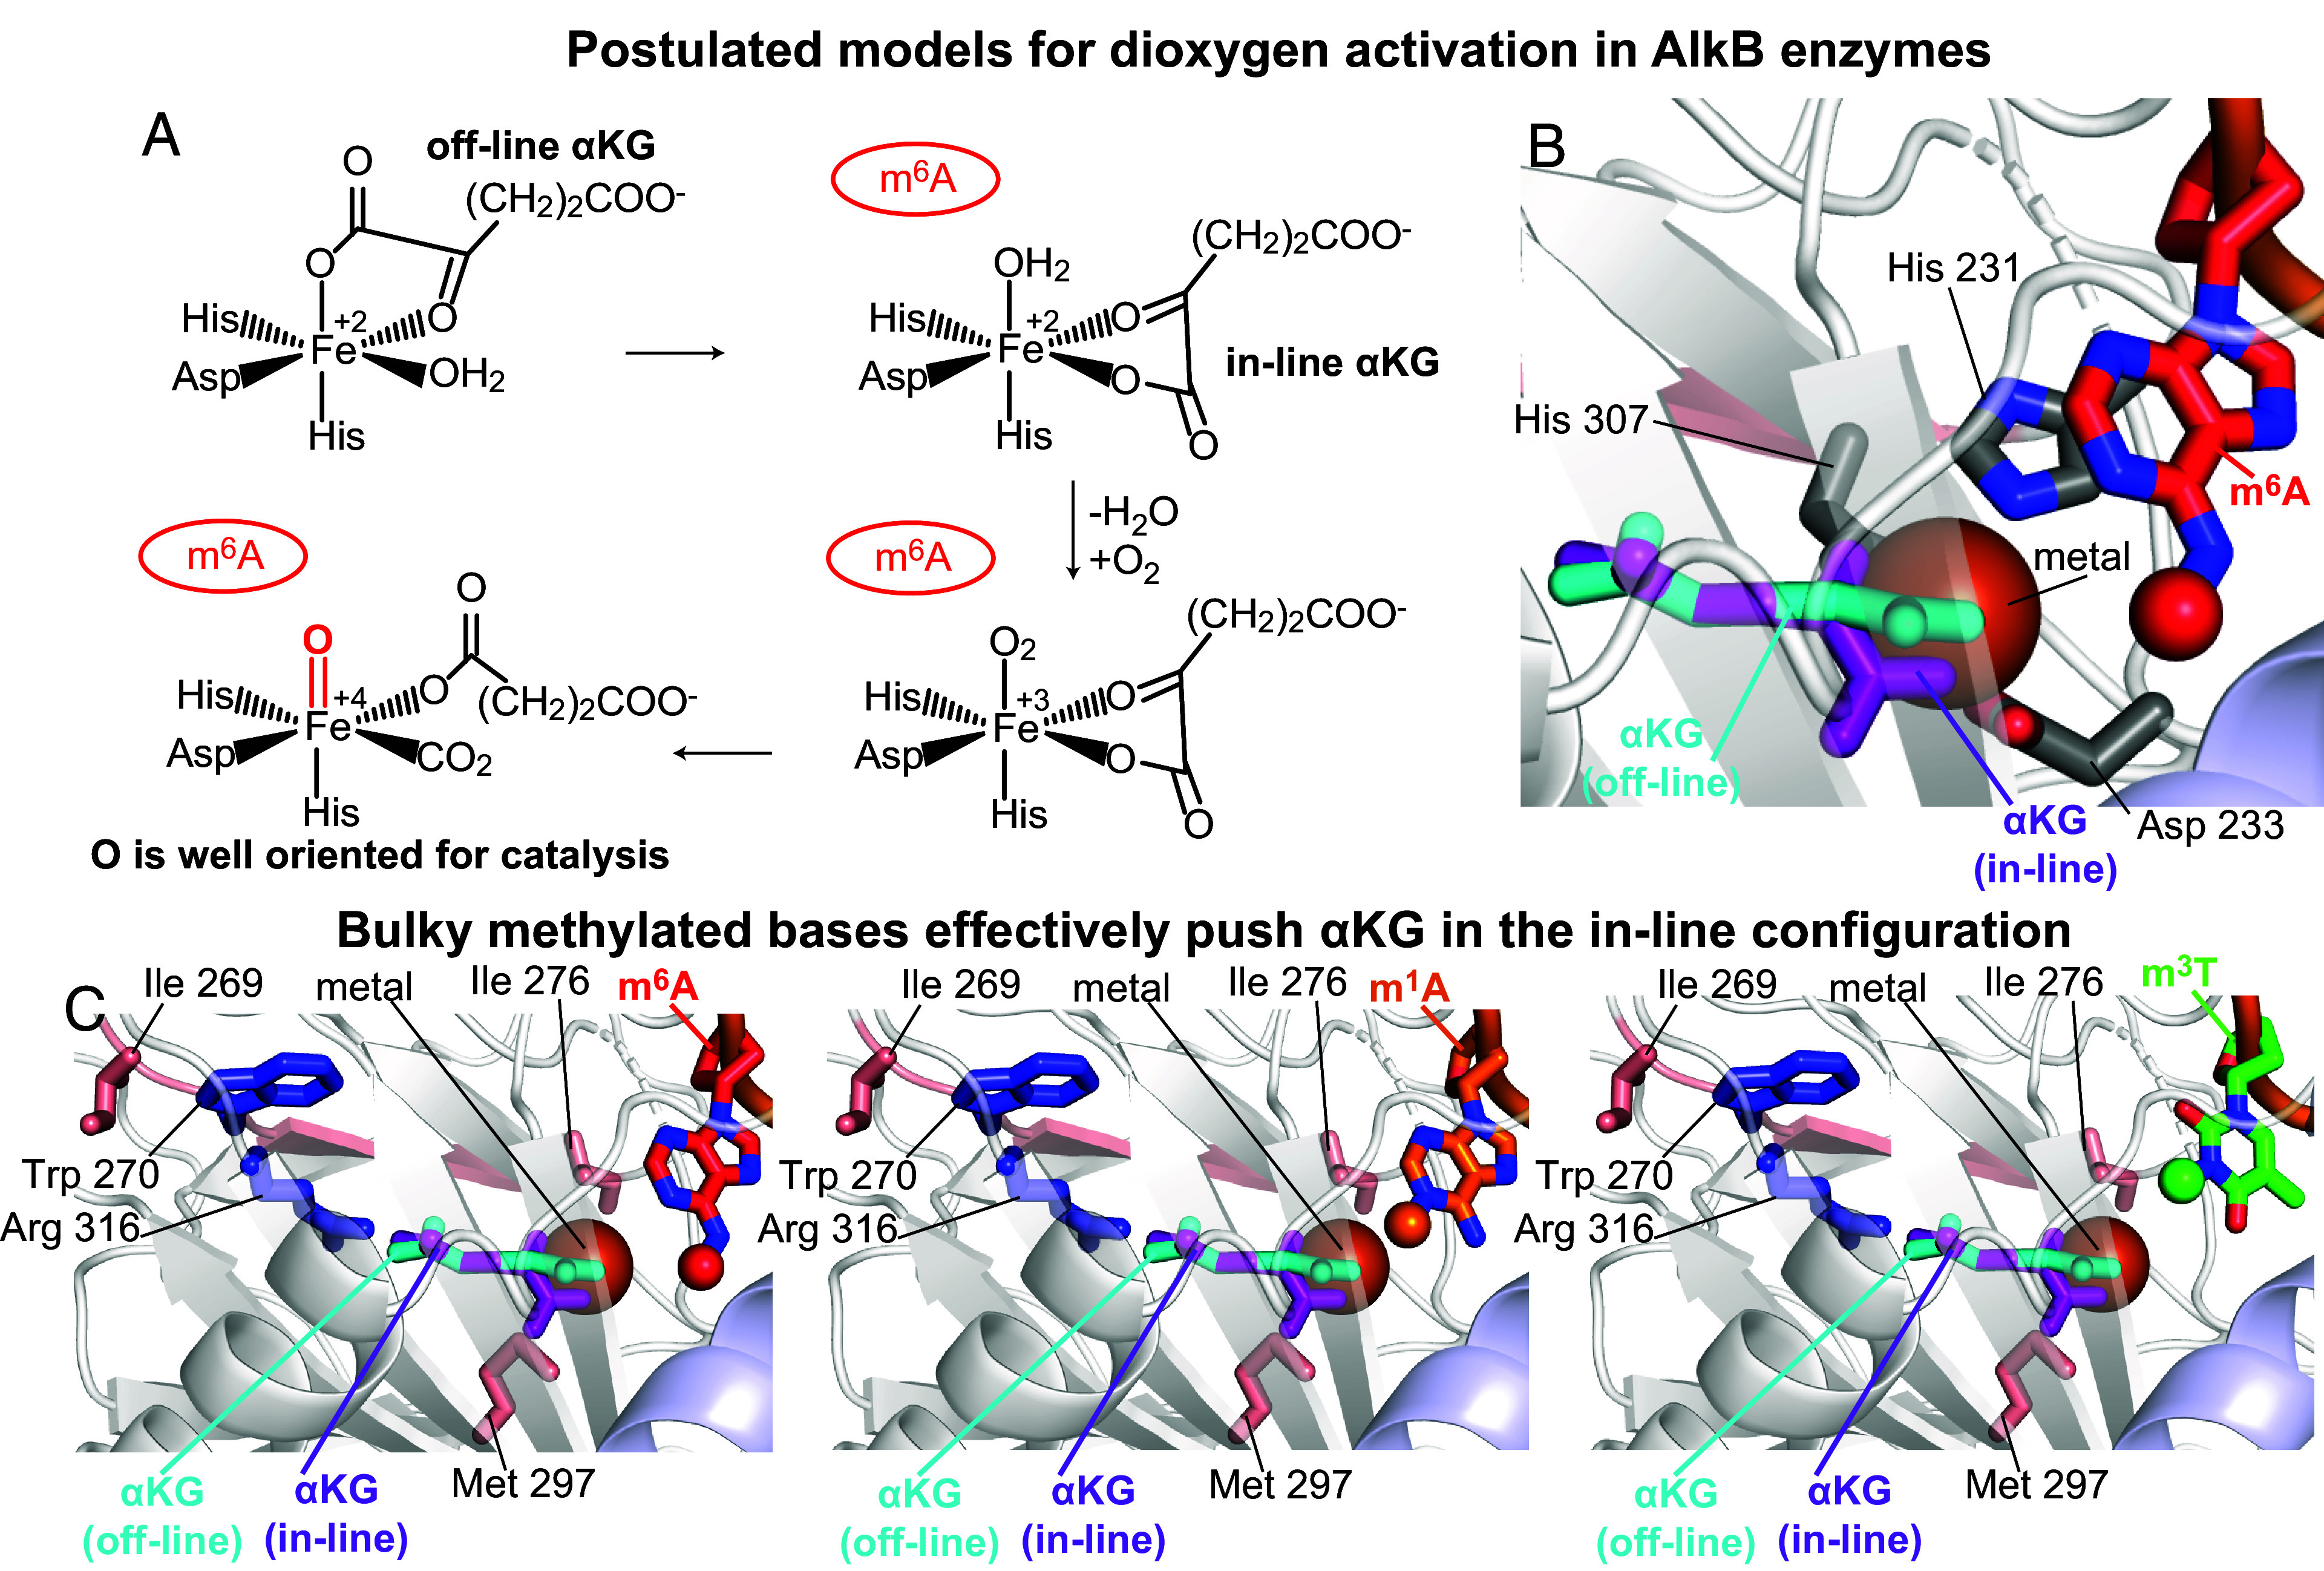
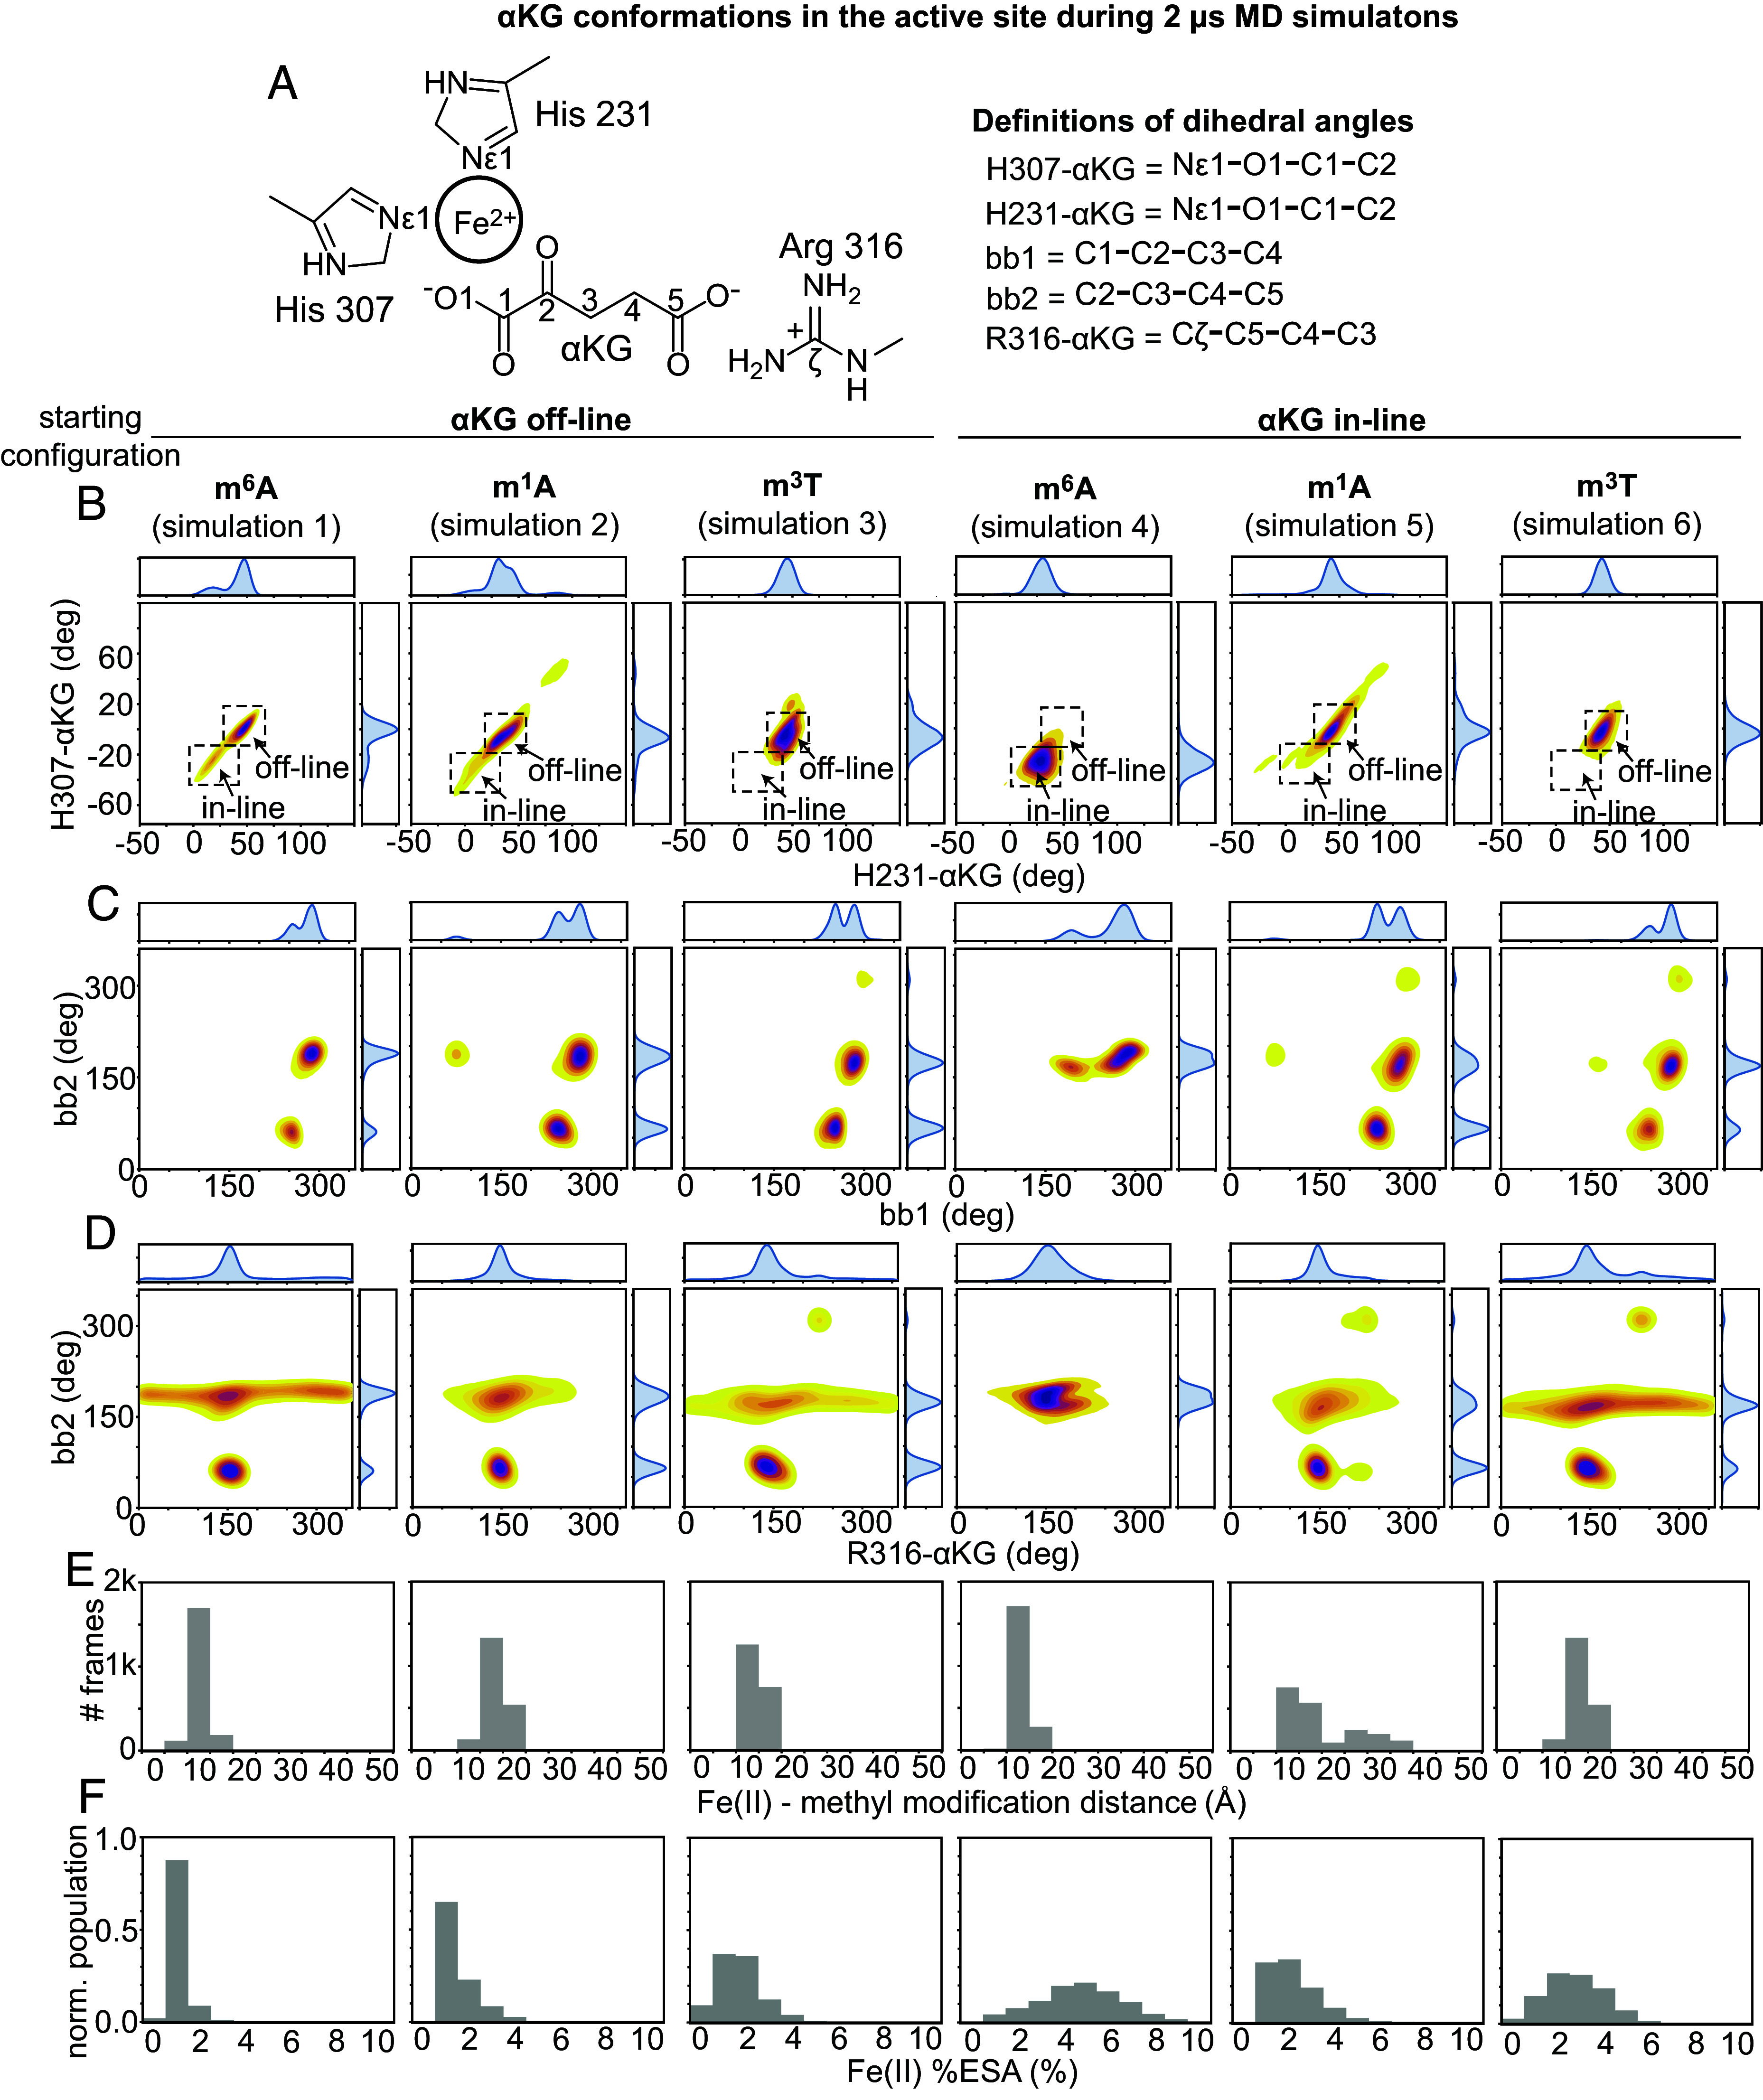
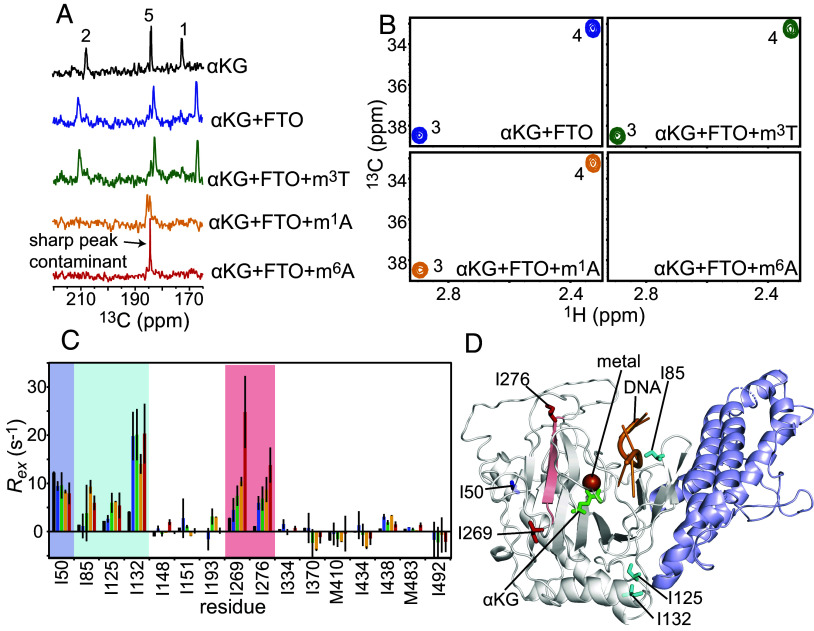
The fat mass and obesity-associated fatso (FTO) protein is a member of the Alkb family of dioxygenases and catalyzes oxidative demethylation of N6-methyladenosine (m6A), N1-methyladenosine (m1A), 3-methylthymine (m3T), and 3-methyluracil (m3U) in single-stranded nucleic acids. It is well established that the catalytic activity of FTO proceeds via two coupled reactions. The first reaction involves decarboxylation of alpha-ketoglutarate (αKG) and formation of an oxyferryl species. In the second reaction, the oxyferryl intermediate oxidizes the methylated nucleic acid to reestablish Fe(II) and the canonical base. However, it remains unclear how binding of the nucleic acid activates the αKG decarboxylation reaction and why FTO demethylates different methyl modifications at different rates. Here, we investigate the interaction of FTO with 5-mer DNA oligos incorporating the m6A, m1A, or m3T modifications using solution NMR, molecular dynamics (MD) simulations, and enzymatic assays. We show that binding of the nucleic acid to FTO activates a two-state conformational equilibrium in the αKG cosubstrate that modulates the O2 accessibility of the Fe(II) catalyst. Notably, the substrates that provide better stabilization to the αKG conformation in which Fe(II) is exposed to O2 are demethylated more efficiently by FTO. These results indicate that i) binding of the methylated nucleic acid is required to expose the catalytic metal to O2 and activate the αKG decarboxylation reaction, and ii) the measured turnover of the demethylation reaction (which is an ensemble average over the entire sample) depends on the ability of the methylated base to favor the Fe(II) state accessible to O2.
Keywords: Alkb dioxygenases; N6-methyladenosine; NMR; liquid chromatography–mass spectrometry; molecular dynamics simulations.
Conflict of interest statement
Competing interests statement:The authors declare no competing interest.
Figures
Similar articles
-
Structural insights into FTO's catalytic mechanism for the demethylation of multiple RNA substrates.Proc Natl Acad Sci U S A. 2019 Feb 19;116(8):2919-2924. doi: 10.1073/pnas.1820574116. Epub 2019 Feb 4. Proc Natl Acad Sci U S A. 2019. PMID: 30718435 Free PMC article.
-
Oxidative demethylation of 3-methylthymine and 3-methyluracil in single-stranded DNA and RNA by mouse and human FTO.FEBS Lett. 2008 Oct 15;582(23-24):3313-9. doi: 10.1016/j.febslet.2008.08.019. Epub 2008 Sep 5. FEBS Lett. 2008. PMID: 18775698 Free PMC article.
-
Distinct RNA N-demethylation pathways catalyzed by nonheme iron ALKBH5 and FTO enzymes enable regulation of formaldehyde release rates.Proc Natl Acad Sci U S A. 2020 Oct 13;117(41):25284-25292. doi: 10.1073/pnas.2007349117. Epub 2020 Sep 28. Proc Natl Acad Sci U S A. 2020. PMID: 32989163 Free PMC article.
-
The AlkB Family of Fe(II)/α-Ketoglutarate-dependent Dioxygenases: Repairing Nucleic Acid Alkylation Damage and Beyond.J Biol Chem. 2015 Aug 21;290(34):20734-20742. doi: 10.1074/jbc.R115.656462. Epub 2015 Jul 7. J Biol Chem. 2015. PMID: 26152727 Free PMC article. Review.
-
Recent Advance in Sensitive Detection of Demethylase FTO.Chembiochem. 2025 May 5;26(9):e202400995. doi: 10.1002/cbic.202400995. Epub 2025 Jan 15. Chembiochem. 2025. PMID: 39714929 Review.
Cited by
-
Illuminating Protein Allostery by Chemically Accurate Contact Response Analysis (ChACRA).J Chem Theory Comput. 2024 Oct 8;20(19):8711-8723. doi: 10.1021/acs.jctc.4c00414. Epub 2024 Jul 22. J Chem Theory Comput. 2024. PMID: 39038177 Free PMC article.
-
1H, 15N, 13C backbone resonance assignment of human Alkbh7.Biomol NMR Assign. 2025 Jun;19(1):65-69. doi: 10.1007/s12104-025-10219-4. Epub 2025 Jan 29. Biomol NMR Assign. 2025. PMID: 39881053
-
Implications of gut microbiota-mediated epigenetic modifications in intestinal diseases.Gut Microbes. 2025 Dec;17(1):2508426. doi: 10.1080/19490976.2025.2508426. Epub 2025 Jun 4. Gut Microbes. 2025. PMID: 40464639 Free PMC article. Review.
-
Differential control of RNA demethylase activity and selectivity by cofactor ascorbate.bioRxiv [Preprint]. 2025 May 8:2025.05.06.652568. doi: 10.1101/2025.05.06.652568. bioRxiv. 2025. PMID: 40654844 Free PMC article. Preprint.
References
-
- Han Z., et al. , Crystal structure of the FTO protein reveals basis for its substrate specificity. Nature (London, UK: ). 464, 1205–1209 (2010). - PubMed
-
- Lu L., Zhu C., Xia B., Yi C., Oxidative demethylation of DNA and RNA mediated by non-heme iron-dependent dioxygenases. Chem. An Asian J. 9, 2018–2029 (2014). - PubMed
MeSH terms
Substances
Grants and funding
LinkOut - more resources
Full Text Sources
Medical
Miscellaneous
