. 2024 Dec 23;197(1):kiae336.
doi: 10.1093/plphys/kiae336.

Shoot hydraulic impairments induced by root waterlogging: Parallels and contrasts with drought

Affiliations

Shoot hydraulic impairments induced by root waterlogging: Parallels and contrasts with drought

Eduardo J Haverroth et al. Plant Physiol. .

Abstract

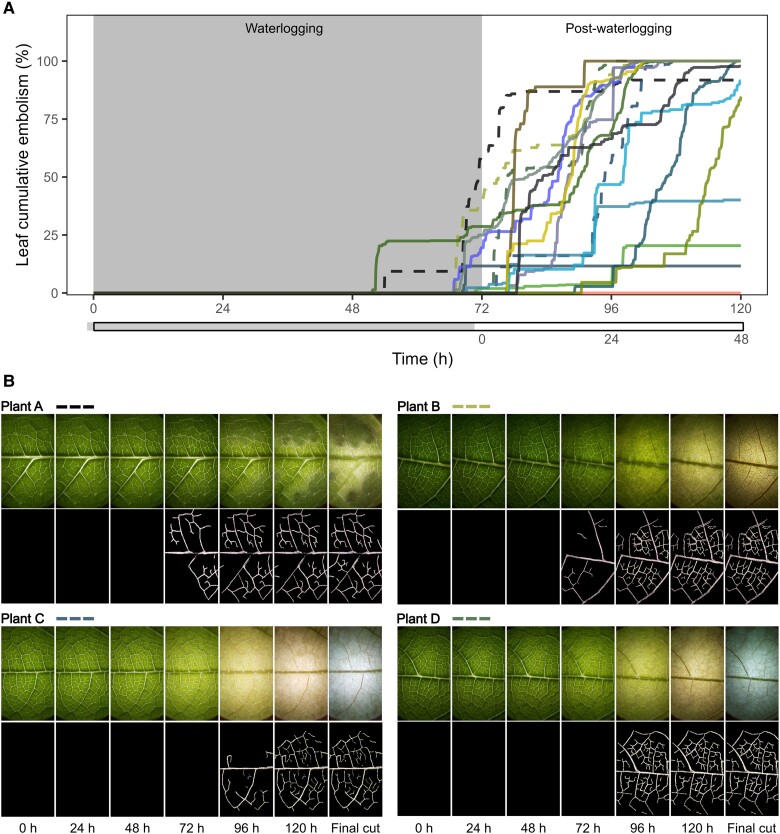
Soil waterlogging and drought correspond to contrasting water extremes resulting in plant dehydration. Dehydration in response to waterlogging occurs due to impairments to root water transport, but no previous study has addressed whether limitations to water transport occur beyond this organ or whether dehydration alone can explain shoot impairments. Using common bean (Phaseolus vulgaris) as a model species, we report that waterlogging also impairs water transport in leaves and stems. During the very first hours of waterlogging, leaves transiently dehydrated to water potentials close to the turgor loss point, possibly driving rapid stomatal closure and partially explaining the decline in leaf hydraulic conductance. The initial decline in leaf hydraulic conductance (occurring within 24 h), however, surpassed the levels predicted to occur based solely on dehydration. Constraints to leaf water transport resulted in a hydraulic disconnection between leaves and stems, furthering leaf dehydration during waterlogging and after soil drainage. As leaves dehydrated later during waterlogging, leaf embolism initiated and extensive embolism levels amplified leaf damage. The hydraulic disconnection between leaves and stems prevented stem water potentials from declining below the threshold for critical embolism levels in response to waterlogging. This allowed plants to survive waterlogging and soil drainage. In summary, leaf and stem dehydration are central in defining plant impairments in response to waterlogging, thus creating similarities between waterlogging and drought. Yet, our findings point to the existence of additional players (likely chemicals) partially controlling the early declines in leaf hydraulic conductance and contributing to leaf damage during waterlogging.


Conflict of interest statement

Conflict of interest statement. None declared.

Figures

Figure 1.
Figure 1.
Hydraulic changes during and after waterlogging. A) Midday leaf water potentials obtained with psychrometers (n = 4), (B) continuous measurements of stem water potentials using psychrometers (n = 4) and final measurements using pressure chamber (black squares) (n = 12), (C) stomatal conductances (n = 6), and (D) leaf hydraulic conductances (n = 6) for P. vulgaris plants exposed to 72 h of waterlogging (gray area) and 48 h of post-waterlogging (white area). E) High-resolution assessment of leaf water potential within 48 h of waterlogging using leaf psychrometers (measurements every 15 min) (n = 4), optical dendrometers (assessments every 1 min) (n = 4), and pressure chamber (n = 3). Stems are excised after 48 h so more negative water potentials can be used to calibrate the data obtained from the optical dendrometers. Calibration curves for the optical dendrometers can be found in Supplementary Fig. S5. Data are means ± Se (error bars or shadings around lines). Asterisks denote statistical differences between controls and stressed plants (Student’s t-test, P < 0.05). In (A), the leaf water potential of stressed plants at 120 h is −2.87 ± 1.83 MPa (Supplementary Table S4). In (A) and (E), P12, Kleaf is the water potential at 12% loss in leaf hydraulic conductance, ΨTLP is turgor loss point, and P12, OV is the water potential at 12% leaf cumulative embolism. In (B), P12, OV, P50, OV, and P88, OV are the water potentials at 12%, 50%, and 88% stem cumulative embolism.
Figure 2.
Figure 2.
Declines in leaf hydraulic conductance with leaf dehydration for P. vulgaris plants (gray symbols and curve fit) and changes in leaf hydraulic conductance as plants were exposed to 72 h of waterlogging and 48 h of post-waterlogging (colored symbols). Black lines and shadows represent means ± Se, n = 6 plants. Colored symbols reflect means ± Se of the leaf hydraulic conductances in Fig. 1D (n = 6) and the minimum water potential for each time in Fig. 1, A and E (n = 4). An arrow highlights the single point (24 h of waterlogging) at which the decline in leaf hydraulic conductance cannot be explained by leaf dehydration.
Figure 3.
Figure 3.
Embolism accumulation in leaves during and after waterlogging. A) Cumulative embolism in P. vulgaris leaves observed in situ as plants were exposed to 72 h of waterlogging (gray area) and 48 h of post-waterlogging (white area). Colors represent different individuals (n = 18). Dashed lines indicate individuals highlighted in (B). B) Original images and spatiotemporal evolution of embolism formation obtained throughout the experiment. After the experiment, leaves were cut in the air to induce further dehydration and 100% cumulative embolism, i.e. “final cut”.
Figure 4.
Figure 4.
Leaf damage during and after waterlogging. A) Fold changes in foliar malondialdehyde levels (representing cell membrane damage) (n = 4) and (B) maximum quantum efficiency of PSII (FvFm) (n = 6) in P. vulgaris plants exposed to 72 h of waterlogging (gray area) and 48 h of post-waterlogging (white area). White circles are controls and black circles are stressed plants. Data are means ± Se. Asterisks denote statistical differences between controls and stressed plants (Student's t-test, P < 0.05). C) Representative images of leaves sampled at different times during waterlogging and post-waterlogging. Images were digitally extracted for comparison. Photos were taken without a scale.
Figure 5.
Figure 5.
An overview of the plant hydraulic alterations occurring during and after waterlogging. A) Summarizing figure highlighting actual changes in leaf and stem water potentials and relative changes in stomatal conductance, leaf hydraulic conductance, leaf cell membrane damage (i.e. foliar malondialdehyde levels), and leaf cumulative embolism in P. vulgaris plants exposed to 72 h of waterlogging (gray area) and 48 h of post-waterlogging (white area). Data corresponds to Figs. 1, 3, and 4. B) The main physiological and hydraulic processes taking place during and after waterlogging. Processes start to occur during waterlogging and are amplified after soil drainage. Early during waterlogging, root hydraulic conductance declines (literature-based information), reducing the water movement from roots to the shoot, and thus causing stems and leaves to dehydrate. Rapid declines in leaf water potential (Ψleaf) close to the leaf turgor loss point likely result in ABA accumulation and stomatal closure. Stomatal closure minimizes leaf water loss and transiently increases Ψleaf. Declines in leaf hydraulic conductance (Kleaf) co-occur with stomatal closure and, within the first 24 h, are induced not only by leaf dehydration but also by dehydration-independent mechanisms—possibly impairments to aquaporin (AQP) function triggered by chemical signals. Declines in Kleaf result in hydraulic disconnection between leaves and stems, furthering the declines in Ψleaf, while protecting the stems from major dehydration. By minimizing stem dehydration beyond the thresholds for catastrophic embolism levels, plants survive the waterlogging and post-waterlogging. During waterlogging, leaf damage precedes leaf embolism formation, and it is likely associated with both leaf dehydration and ROS accumulation. Leaf xylem embolism occurs late during waterlogging and after the waterlogging due to further leaf dehydration, and embolism intensifies the leaf damage.

Similar articles

Cited by

References

    1. Alpuerto JB, Hussain RMF, Fukao T. The key regulator of submergence tolerance, SUB1A, promotes photosynthetic and metabolic recovery from submergence damage in rice leaves. Plant Cell Environ. 2016:39(3):672–684. 10.1111/pce.12661 - DOI - PubMed
    1. Aroca R, Amodeo G, Fernández-Illescas S, Herman EM, Chaumont F, Chrispeels MJ. The role of aquaporins and membrane damage in chilling and hydrogen peroxide induced changes in the hydraulic conductance of maize roots. Plant Physiol. 2005:137(1):341–353. 10.1104/pp.104.051045 - DOI - PMC - PubMed
    1. Aroca R, Porcel R, Ruiz-Lozano JM. Regulation of root water uptake under abiotic stress conditions. J Exp Bot. 2012:63(1):43–57. 10.1093/jxb/err266 - DOI - PubMed
    1. Bailey-Serres J, Voesenek LACJ. Flooding stress: acclimations and genetic diversity. Annu Rev Plant Biol. 2008:59(1):313–339. 10.1146/annurev.arplant.59.032607.092752 - DOI - PubMed
    1. Bourbia I, Brodribb TJ. A new technique for monitoring plant transpiration under field conditions using leaf optical dendrometry. Agric For Meteorol. 2023:331:109328. 10.1016/j.agrformet.2023.109328 - DOI