. 2024 Jun 14;10(24):eadk4387.
doi: 10.1126/sciadv.adk4387. Epub 2024 Jun 12.

TERRA transcripts localize at long telomeres to regulate telomerase access to chromosome ends

Affiliations

TERRA transcripts localize at long telomeres to regulate telomerase access to chromosome ends

Nicole Bettin et al. Sci Adv. .

Abstract

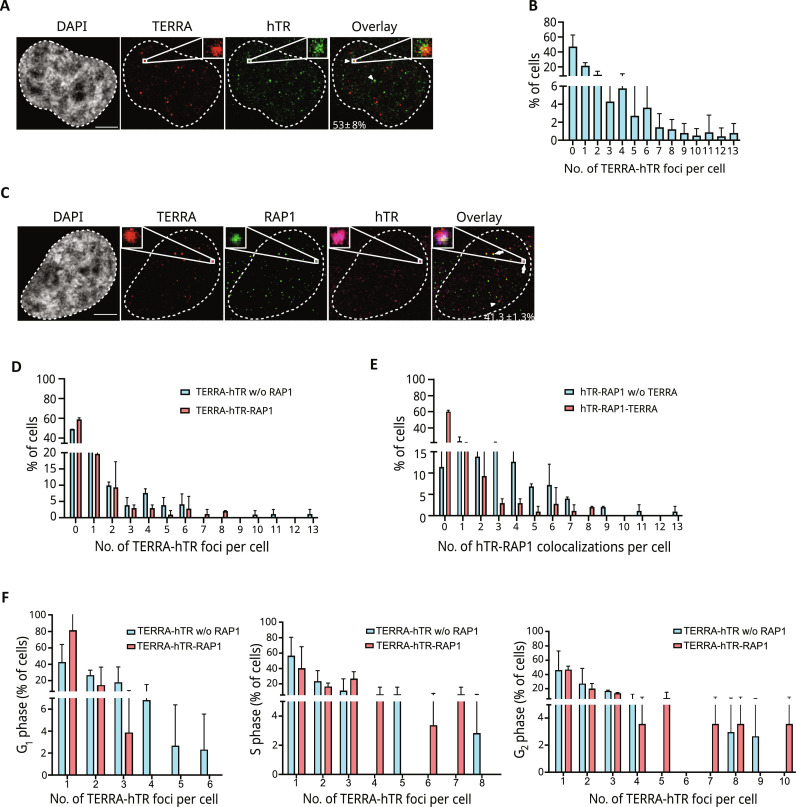
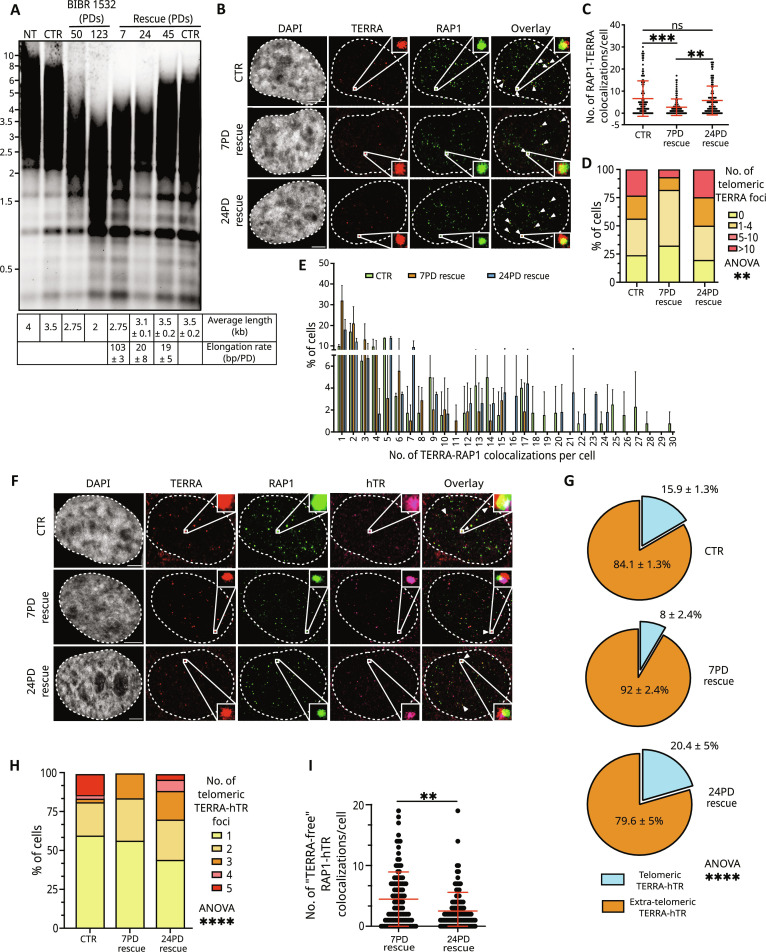
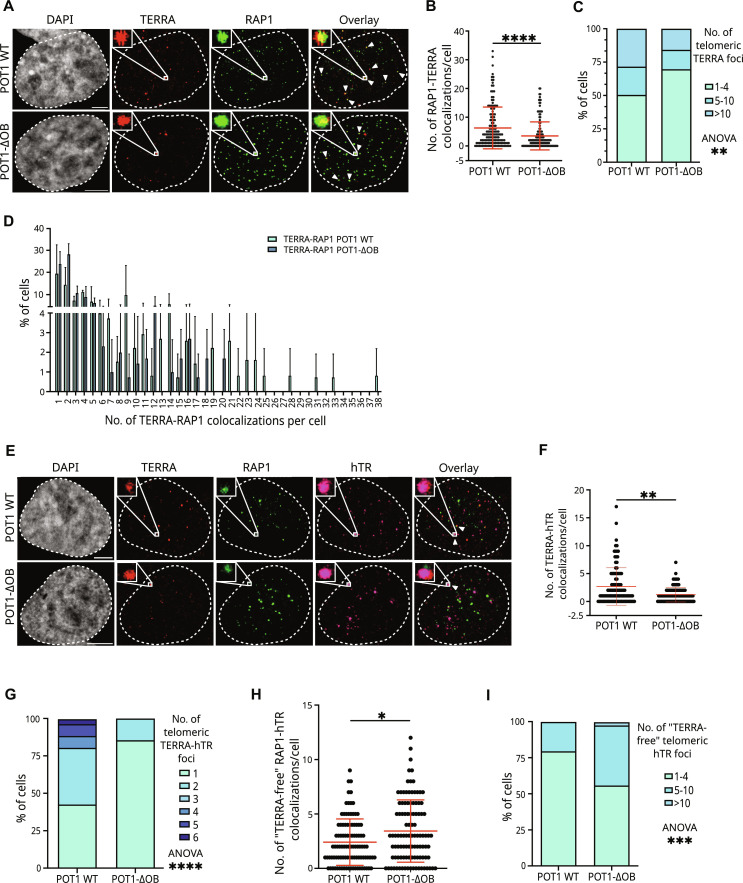
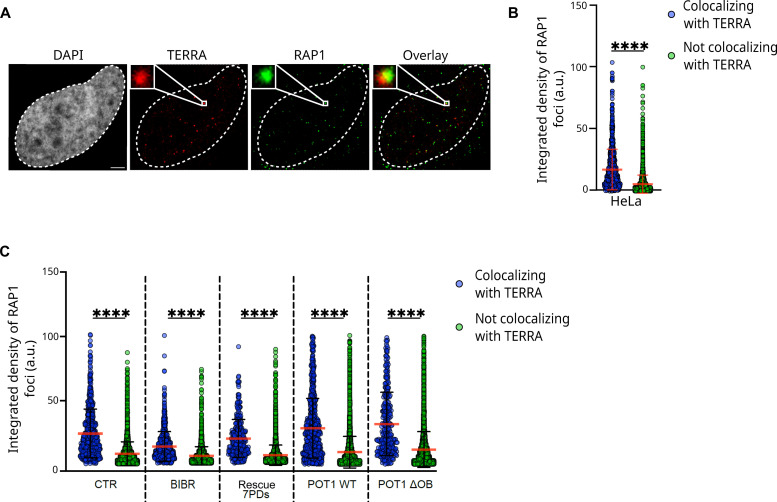
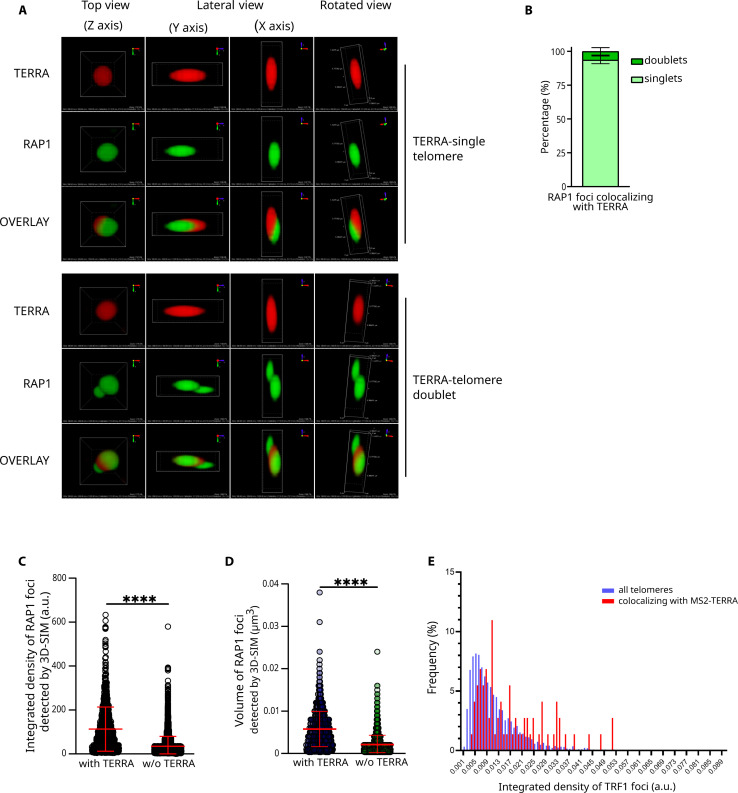
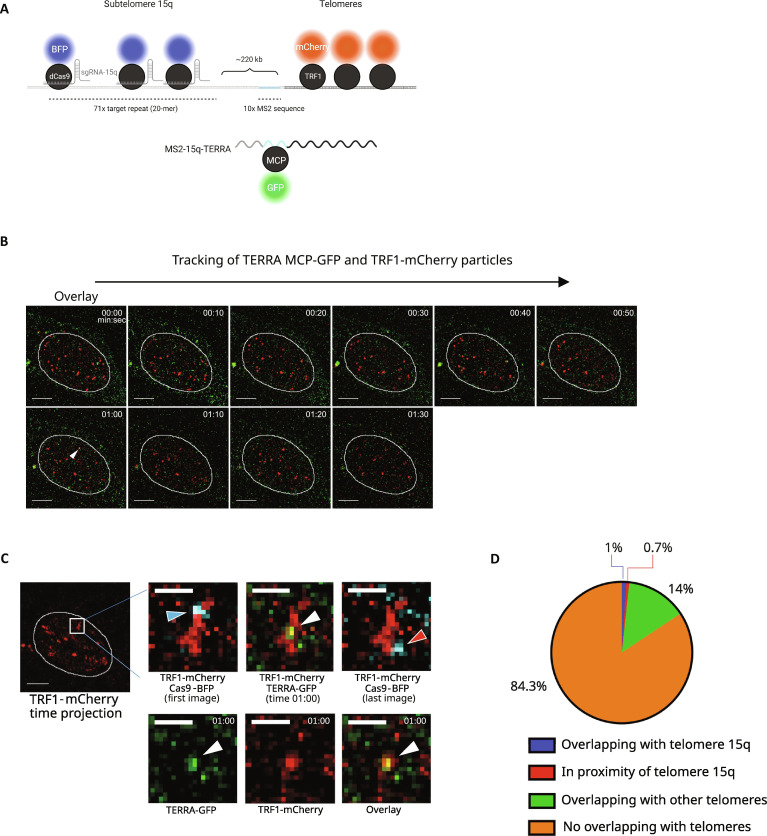
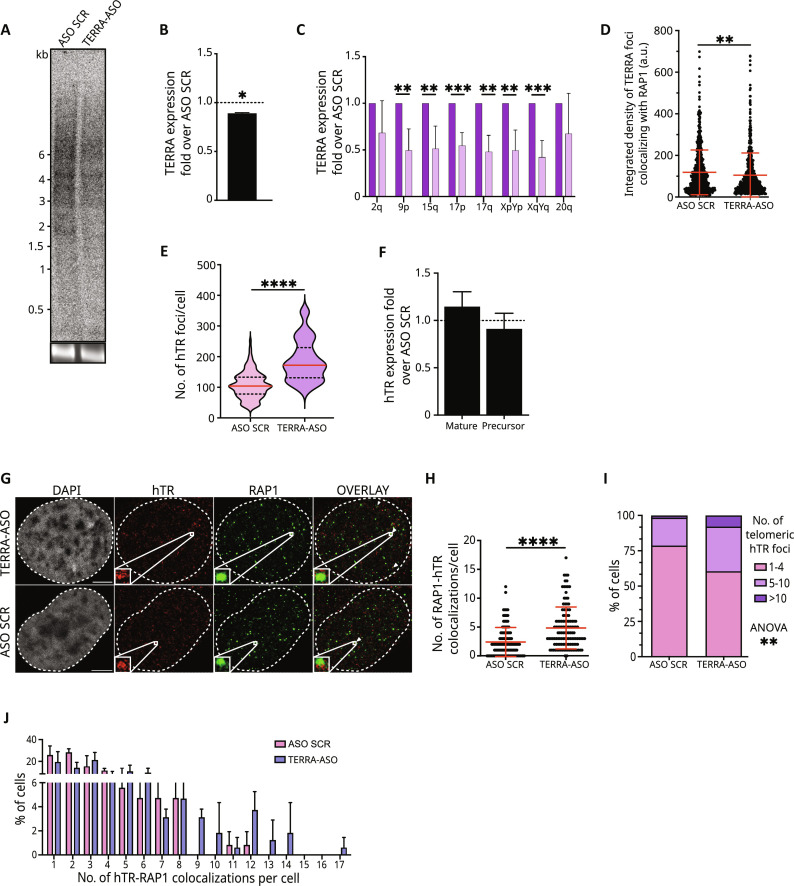
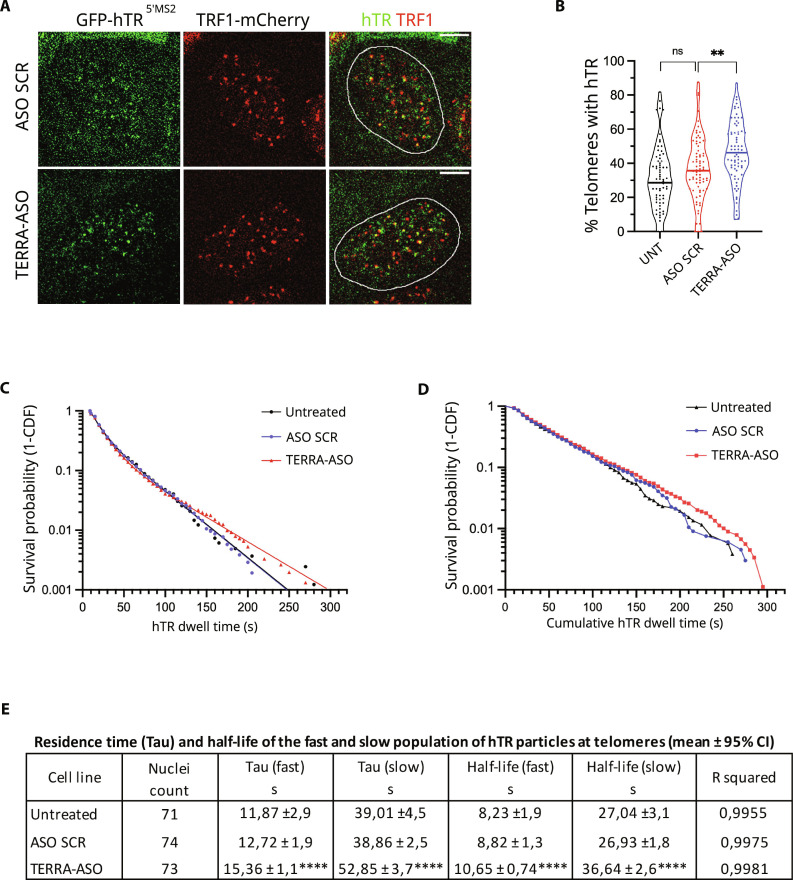
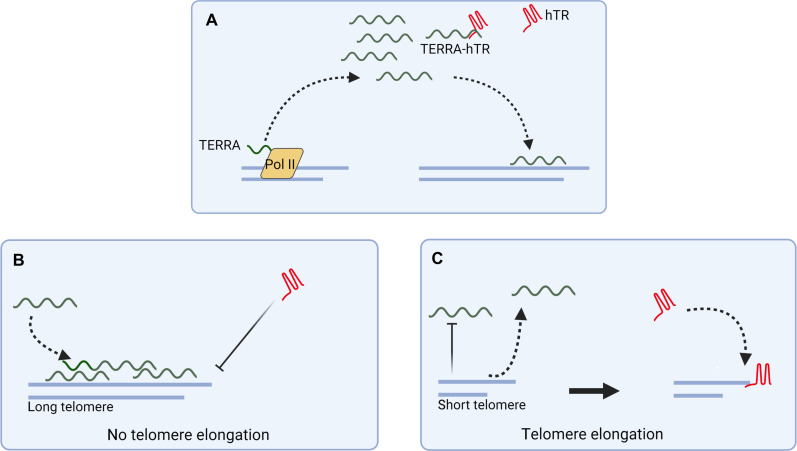
The function of TERRA in the regulation of telomerase in human cells is still debated. While TERRA interacts with telomerase, how it regulates telomerase function remains unknown. Here, we show that TERRA colocalizes with the telomerase RNA subunit hTR in the nucleoplasm and at telomeres during different phases of the cell cycle. We report that TERRA transcripts relocate away from chromosome ends during telomere lengthening, leading to a reduced number of telomeric TERRA-hTR molecules and consequent increase in "TERRA-free" telomerase molecules at telomeres. Using live-cell imaging and super-resolution microscopy, we show that upon transcription, TERRA relocates from its telomere of origin to long chromosome ends. Furthermore, TERRA depletion by antisense oligonucleotides promoted hTR localization to telomeres, leading to increased residence time and extended half-life of hTR molecules at telomeres. Overall, our findings indicate that telomeric TERRA transcripts inhibit telomere elongation by telomerase acting in trans, impairing telomerase access to telomeres that are different from their chromosome end of origin.


Figures

Fig. 1.
Fig. 1.. TERRA and hTR colocalize at telomeres in HeLa cells.
(A) Detection of TERRA and hTR by smiFISH in HeLa cells. The percentage of cells, in which at least 1 TERRA-hTR colocalization event is detected, is indicated (mean ± SD; n = 5; 298 cells analyzed). Scale bar, 5 μm. (B) Quantification of the number of TERRA-hTR colocalizations per nucleus (mean ± SD; n = 5; 298 cells analyzed). (C) Detection of TERRA, hTR, and telomeres by smiFISH/RAP1 IF in HeLa cells (mean ± SD; n = 2; 102 cells analyzed). Scale bar, 5 μm. (D) Quantification of the number of TERRA-hTR colocalizations per cell detected at telomeres (TERRA-hTR-RAP1) and outside telomeres (TERRA-hTR w/o RAP1) (mean ± SD; n = 2; 102 cells analyzed). (E) Number of hTR-RAP1 colocalizations per cell with and w/o TERRA (mean ± SD; n = 2; 102 cells analyzed). (F) Quantification of the number of TERRA-hTR foci at telomeres (TERRA-hTR-RAP1) and outside telomeres (TERRA-hTR w/o RAP1) during G1, S, and G2 phase in HeLa cells upon cell synchronization (mean ± SD; n = 2; total number of cells analyzed: 54 (G1 phase), 46 (S phase), and 45 (G2 phase). Fraction of hTR-TERRA foci at telomeres: 20.9 ± 3.3% in G1-phase cells, 40.2 ± 11% in S-phase cells, and 41.1 ± 5.5% in G2-phase cells.
Fig. 2.
Fig. 2.. Telomeric localization of TERRA and TERRA-hTR foci inversely correlates with telomere elongation by telomerase.
(A) Telomere length measurement by TRF through Southern blot in HeLa cells in the indicated conditions. NT, untreated; CTR, DMSO-treated. Estimated average telomere length and elongation rate for each sample are indicated in the table below. Average ± SD from two technical replicates. (B) Detection of TERRA and telomeres by smiFISH/IF in CTR, 7PD rescue, and 24PD rescue cells. Scale bar, 5 μm. (C) Quantification of the number of telomeric TERRA foci detected per nucleus by smiFISH/IF (each dot represents a nucleus) (mean ± SD; n = 2; 124 CTR cells, 111 7PD rescue cells, and 112 24PD rescue cells analyzed). Unpaired nonparametric Kruskal-Wallis test coupled with post hoc Dunn’s multiple-comparison test: **P < 0.01, ***P < 0.001. (D and E) Distribution analyses of the number of telomeric TERRA foci per cell. Two-way analysis of variance (ANOVA) test: **P < 0.01. Post hoc Tukey’s multiple-comparison test: group 1 to 4 P values = 0.07 (CTR versus 7PD rescue), 0.04 (7PD rescue versus 24PD rescue), not significant (ns) (CTR versus 24PD rescue). (F) Detection of TERRA, hTR, and telomeres by smiFISH/IF in CTR, 7PD rescue, and 24PD rescue cells. Scale bar, 5 μm. (G) Quantification of the percentage of TERRA-hTR foci colocalizing at telomeres and extratelomeric (mean ± SD; n = 2; 124 CTR cells, 111 7PDs rescue cells, and 112 24PDs rescue cells analyzed). Two-way ANOVA test: ****P < 0.0001. (H) Distribution analyses of the number of TERRA-hTR-RAP1 colocalizing foci per nucleus. Two-way ANOVA test: ****P < 0.0001; multiple-comparison test: P = 0.0003 for 7PD versus 24PD rescue, P < 0.0001 for CTR versus 7PD rescue, P = 0.001 CTR versus 24PD rescue. (I) Number of telomeric hTR foci not colocalizing with TERRA per cell detected by smiFISH/IF. Kruskal-Wallis test: P = 0.0025.
Fig. 3.
Fig. 3.. Telomeric TERRA and TERRA-hTR foci decline during telomere elongation in POT1-ΔOB–expressing cells.
(A) Detection of TERRA and telomeres by smiFISH/IF in HeLa cells expressing POT1 WT or POT1-ΔOB proteins. Scale bar, 5 μm. (B) Quantification of the number of telomeric TERRA foci detected per cell by smiFISH/IF (mean ± SD; n = 3; 151 POT1 WT cells and 148 POT1-ΔOB cells analyzed). Mann-Whitney test: ****P < 0.0001. (C and D) Distribution analyses of the number of telomeric TERRA foci per cell. Two-way ANOVA test: **P < 0.01, post hoc Sidak’s multiple-comparison test: P = ns. (E) Detection of TERRA, hTR, and telomeres by smiFISH/IF in HeLa cells expressing POT1 WT or POT1-ΔOB. Scale bar, 5 μm. (F) Quantification of the number of TERRA and hTR colocalizing foci per cell (mean ± SD; n = 2; 100 POT1 WT cells and 105 POT1 ΔOB cells analyzed). Mann-Whitney test: **P < 0.01. (G) Quantification of the number of telomeric TERRA-hTR foci per nucleus by smiFISH/IF (mean ± SD; n = 2; 100 POT1 WT cells and 105 POT1 ΔOB cells analyzed). Two-way ANOVA test: ****P < 0.0001. Post hoc Sidak’s multiple-comparison test: group of one telomeric TERRA-hTR particle per nucleus: P = 0.0017, other groups: P = ns. (H) Number of TERRA-free telomeric hTR foci per cell detected by smiFISH/IF (mean ± SD; n = 2; 100 POT1 WT cells and 105 POT1 ΔOB cells analyzed). Mann-Whitney test: *P < 0.05. (I) Distribution analyses of the number of TERRA-free telomeric hTR foci from experiments shown in (G). Two-way ANOVA test: ***P < 0.001. Post hoc Sidak’s multiple-comparison test: P = ns.
Fig. 4.
Fig. 4.. Telomeres colocalizing with TERRA are characterized by high signal intensity as detected by confocal microscopy.
(A) Detection of TERRA and RAP1 by smiFISH/IF in HeLa cells. An example of a colocalization event between TERRA and RAP1 is shown in the image magnifications. DAPI is used to stain nuclei. Scale bar, 5 μm. (B) Integrated density quantification of RAP1 foci colocalizing and not colocalizing with TERRA foci in HeLa cells as detected by smiFISH/IF. Each dot represents a single RAP1 focus. Mean ± SD is shown. A total of 110 cells were analyzed in three independent biological replicates. Statistical significance was assessed by Mann-Whitney test. ****P < 0.0001. (C) Integrated density quantification of RAP1 foci colocalizing and not colocalizing with TERRA foci in the indicated samples. Each dot represents a single RAP1 focus. Mean ± SD is shown from the following number of samples and biological replicates: 64 CTR cells (n = 2), 67 BIBR1532 cells (123PDs of treatment with BIBR 1532) (n = 2), 111 7PD rescue cells (n = 2), 151 POT1 WT cells (n = 3), and 148 POT1-ΔOB cells (n = 3). The Mann-Whitney test was used to assess statistical significance. ****P < 0.0001.
Fig. 5.
Fig. 5.. TERRA-associated telomeres are characterized by high signal intensity and larger volume as detected by 3D-SIM microscopy.
(A) Detection of TERRA and telomeres in HeLa cells by smiFISH/IF. Image acquisitions were performed using three-dimensional structured illumination microscopy (3D-SIM). Examples of TERRA foci colocalizing with a single telomere (top images) or telomere doublet (bottom images) are displayed. TERRA is shown in red; telomeres are in green. Scale bar is indicated in the rotated view images. (B) Quantification of the fraction of single telomeres versus telomere doublets colocalizing with TERRA. Data are shown as percentage of TERRA-colocalizing telomeres and represent mean ± SD from three independent biological replicates for a total of 30 cells and 663 TERRA-colocalizing RAP1 foci analyzed. (C and D) Quantification of the integrated density (C) and volume (D) of RAP1 foci colocalizing (with TERRA) and not colocalizing (without TERRA) with TERRA. Both TERRA-single telomere and TERRA-telomere doublet colocalizations were considered. Data are shown as arbitrary units (a.u.), in (C), and μm3, in (D), and represents mean ± SD from three independent biological replicates for a total of 30 cells and 663 TERRA-colocalizing RAP1 foci analyzed. The Mann-Whitney test was used to assess statistical significance. ****P < 0.0001. (E) Quantification of the integrated density of all TRF1-mCherry foci and TRF1-mCherry foci colocalizing with MS2-tagged telomere 15q TERRA transcripts per nucleus. Forty nuclei corresponding to 3690 telomeres and 73 telomeres colocalizing with MS2-TERRA transcripts were analyzed from imaging datasets obtained in (62). Statistical analysis was performed with a Kolmogorov-Smirnov test: P ≤ 0.0001.
Fig. 6.
Fig. 6.. Human TERRA transcripts localize at chromosome ends in trans.
(A) Live-cell imaging approaches used to simultaneously detect telomere 15q TERRA transcripts, subtelomere 15q, and telomeres. 10xMS2 sequences were integrated within subtelomere 15q. Telomere 15q MS2-TERRA is detected by MCP-sfGFP expression. Subtelomere 15q is visualized by expression of dCas9-BFP and sgRNA targeting the subtelomere. Telomeres are visualized by TRF1-mCherry expression. (B) Representative images of a time-lapse experiment performed to track TERRA MCP-sfGFP and telomeres. TERRA-telomere colocalizations were analyzed by two-color Z-stack acquisitions every 10 s. dCas9-BFP signal was imaged at the first and last time points. TERRA MCP-sfGFP particles are in green, and telomeres are in red; a single Z-slice is shown. The white arrowhead at the 1-min time point (1:00) indicates a colocalization event between TERRA MCP-sfGFP and a telomeric signal corresponding to telomere 15q. Scale bars, 5 μm. (C) Verification of the colocalization between telomere 15q TERRA (TERRA-GFP) and its telomere of origin. A maximum intensity projection of all the TRF1-mCherry images of the time lapse for a single Z-slice was performed to show the trajectory of telomere 15q, overlaid with the dCas9-BFP foci at the first (blue arrow) and last (red arrow) time points of the experiment. At the 1-min time point, the TERRA MCP-sfGFP spot (white arrow) colocalizes with telomere 15q. Deconvolution was performed with AutoQuant software. Scale bars, 5 and 1.2 μm for the zoom. (D) Quantification of the number of TERRA MCP-sfGFP particles colocalizing with their telomere of origin or other telomeres. Percentage of TERRA MCP-sfGFP particles colocalizing with telomere 15q (blue), detected in proximity of telomere 15q (red) (0.6 μm distance), overlapping with other telomeres (green) or not colocalizing with, and not in proximity of, telomeres (orange) is shown. Twenty-two cells were analyzed for a total of 408 TERRA MCP-GFP particles tracked.
Fig. 7.
Fig. 7.. TERRA depletion results in increased hTR clustering and localization at telomeres.
(A) Northern blot analysis of TERRA in HeLa cells upon TERRA-ASO or control ASO (ASO SCR) transfection. Bottom image shows 18S rRNA band upon gel run. (B) Quantification of TERRA signal from Northern blot analyses of TERRA-ASO–transfected cells shown as fold over ASO SCR (dashed line). *P < 0.05; mean ± SD, n = 2. (C) RT-qPCR analyses of TERRA expression from the indicated telomeres in TERRA-ASO cells shown as fold over ASO SCR. Mean ± SD from four independent biological replicates. Unpaired t test: **P < 0.01, ***P < 0.001. (D) Integrated density quantification of TERRA foci colocalizing with RAP1 foci. Each dot represents a single TERRA signal (mean ± SD; n = 2; 131 ASO SCR cells and 122 TERRA-ASO cells analyzed). Mann-Whitney test: **P < 0.01. (E) Quantification of the number of hTR foci detected per nucleus in TERRA-ASO and ASO SCR cells (mean ± SD; n = 2; 131 ASO SCR cells and 122 TERRA-ASO cells analyzed). Mann-Whitney test: ****P < 0.0001. (F) RT-qPCR quantification of hTR levels using primer pairs detecting the precursor or mature RNA (78, 79). Results are shown as fold change over ASO SCR (dashed line) (mean ± SD, n = 2). U6 gene was used for normalization (80). (G) Detection of hTR and telomeres by smiFISH/IF. Scale bar, 5 μm. (H) Quantification of the number of telomeric hTR foci detected per nucleus. Data are shown as number of RAP1-hTR colocalizations per cell (each dot represents a cell) (mean ± SD, n = 2; 131 ASO SCR cells and 122 TERRA-ASO cells analyzed). Mann-Whitney test: ****P < 0.0001. (I and J) Distribution analysis of the number of RAP1-hTR colocalizations detected per cell. Two-way ANOVA test: **P < 0.01.
Fig. 8.
Fig. 8.. TERRA depletion increases hTR retention at telomeres.
(A) HeLa hTR5’MS2 + hTERT cells were transfected with TERRA-ASO, ASO SCR, or the transfection reagent (UNT) for 48 hours. Still images of telomeres (in red) visualized with TRF1-mCherry and hTR (in green) bound by MCP-sfGFP. Colocalization events are in yellow. Nuclear outline is in white. Scale bar, 5 μm. (B) Percentage of telomeres colocalized with hTR, defined as telomeres that had at least one stable colocalized hTR track, lasting 10 s or more. TERRA-ASO versus ASO SCR, **P = 0.02; UNT versus ASO SCR t test shows nonsignificant difference; n = 71 to 74 cells per condition. (C) Survival probability analysis of individual hTR particles at telomeres in HeLa hTR5’MS2 + hTERT cells transfected with TERRA-ASO, ASO SCR, or the transfection reagent (UNT) for 48 hours. (D) Survival probability analysis of the cumulative dwell time of hTR particles at individual telomeres in two independent replicates. Median values: untreated: 40 s, ASO SCR: 40 s, and TERRA-ASO: 45 s. Statistical analysis with log-rank test: 0.296 (ns). (E) Fast (probing) and slow (binding) values for hTR residence time (Tau) and half-life obtained from bi-exponential decay curves in (C). Statistical analysis between ASO SCR and TERRA-ASO using multiple unpaired t test: ****P < 0.000001; statistical analysis between untreated versus ASO SCR using multiple unpaired t test: ns.
Fig. 9.
Fig. 9.. Proposed model.
TERRA transcripts are displaced from their telomere of origin to localize within the nucleoplasm, associating or not with hTR. (A) A fraction of nucleoplasmic TERRA molecules is recruited at long telomeres. (B) Accumulation of TERRA at long telomeres interferes with telomerase localization and retention at these chromosome ends. Short telomeres either displace TERRA molecules or do not attract TERRA. (C) Telomerase is recruited at these chromosome ends to promote telomere elongation. Created with Biorender.com

Similar articles

Cited by

  • Telomeres: an organized string linking plants and mammals.
    Di Pietro E, Burla R, La Torre M, González-García MP, Dello Ioio R, Saggio I. Di Pietro E, et al. Biol Direct. 2024 Nov 20;19(1):119. doi: 10.1186/s13062-024-00558-y. Biol Direct. 2024. PMID: 39568075 Free PMC article. Review.
  • RNA binding proteins (RBPs) on genetic stability and diseases.
    Aborode AT, Abass OA, Nasiru S, Eigbobo MU, Nefishatu S, Idowu A, Tiamiyu Z, Awaji AA, Idowu N, Busayo BR, Mehmood Q, Onifade IA, Fakorede S, Akintola AA. Aborode AT, et al. Glob Med Genet. 2024 Nov 30;12(1):100032. doi: 10.1016/j.gmg.2024.100032. eCollection 2025 Mar. Glob Med Genet. 2024. PMID: 39925443 Free PMC article. Review.

References

    1. Azzalin C. M., Reichenbach P., Khoriauli L., Giulotto E., Lingner J., Telomeric repeat containing RNA and RNA surveillance factors at mammalian chromosome ends. Science 318, 798–801 (2007). - PubMed
    1. Schoeftner S., Blasco M. A., Developmentally regulated transcription of mammalian telomeres by DNA-dependent RNA polymerase II. Nat. Cell Biol. 10, 228–236 (2008). - PubMed
    1. Luke B., Panza A., Redon S., Iglesias N., Li Z., Lingner J., The Rat1p 5′ to 3′ exonuclease degrades telomeric repeat-containing RNA and promotes telomere elongation in Saccharomyces cerevisiae. Mol. Cell 32, 465–477 (2008). - PubMed
    1. Manzato C., Larini L., Pegorar C. O., Dello Stritto M. R., Jurikova K., Jantsch V., Cusanelli E., TERRA expression is regulated by the telomere-binding proteins POT-1 and POT-2 in Caenorhabditis elegans. Nucleic Acids Res. 51, 10681–10699 (2023). - PMC - PubMed
    1. Diman A., Decottignies A., Genomic origin and nuclear localization of TERRA telomeric repeat-containing RNA: From darkness to dawn. FEBS J. 285, 1389–1398 (2018). - PubMed