

Discovering the gene-brain-behavior link in autism via generative machine learning
- PMID: 38865470
- PMCID: PMC11168471
- DOI: 10.1126/sciadv.adl5307
Discovering the gene-brain-behavior link in autism via generative machine learning
Abstract
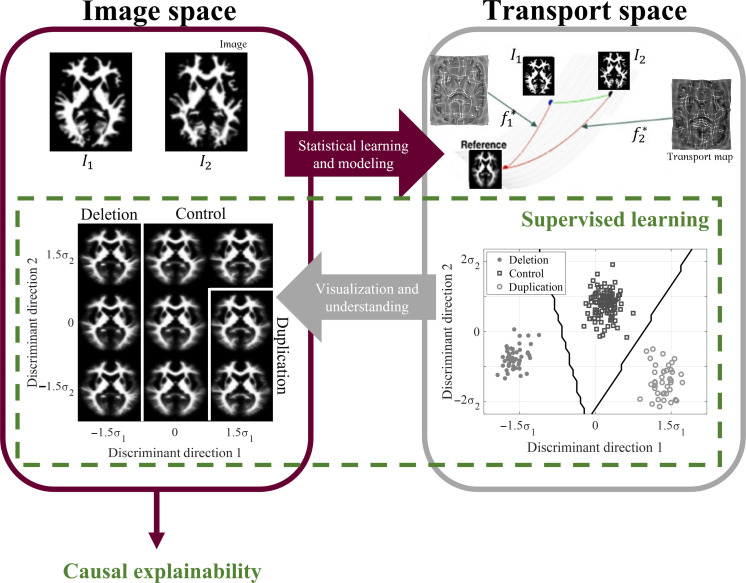
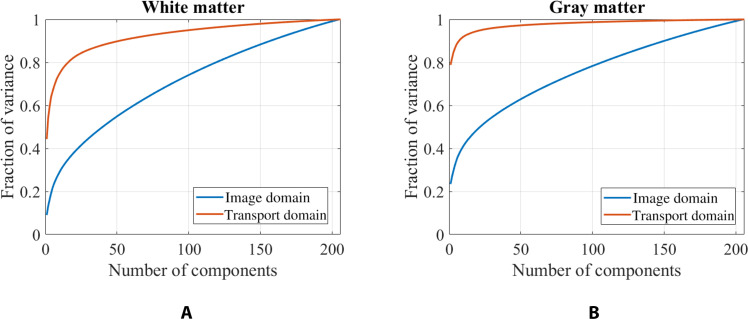
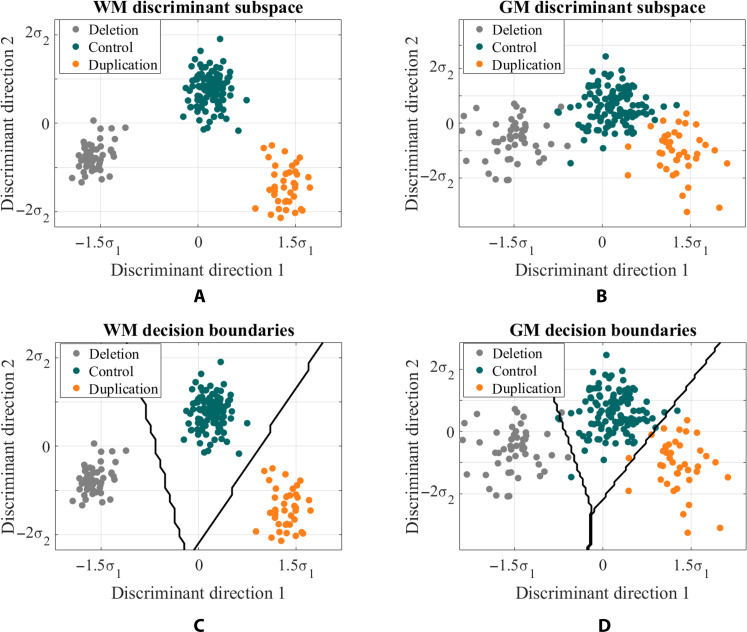
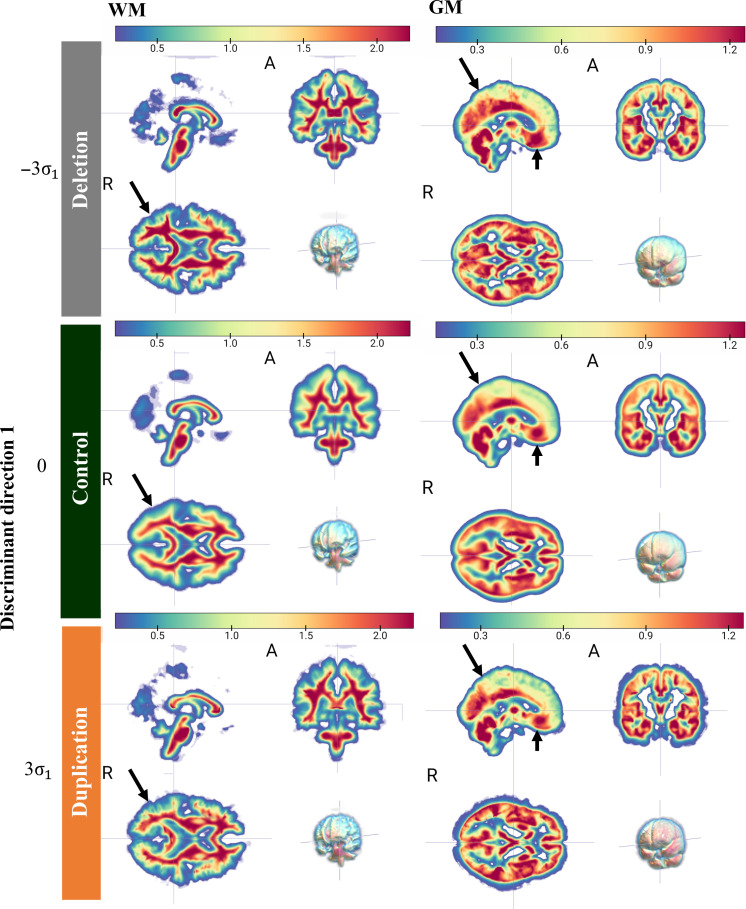
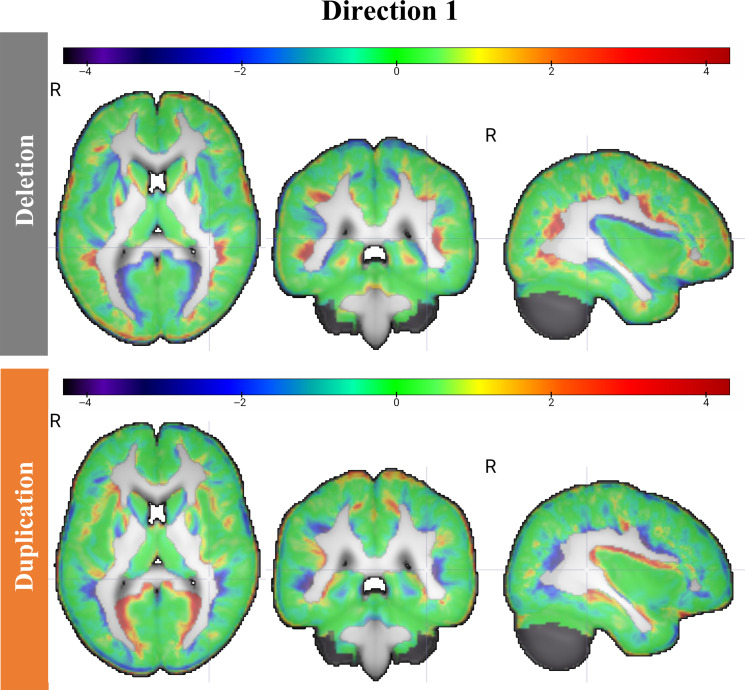
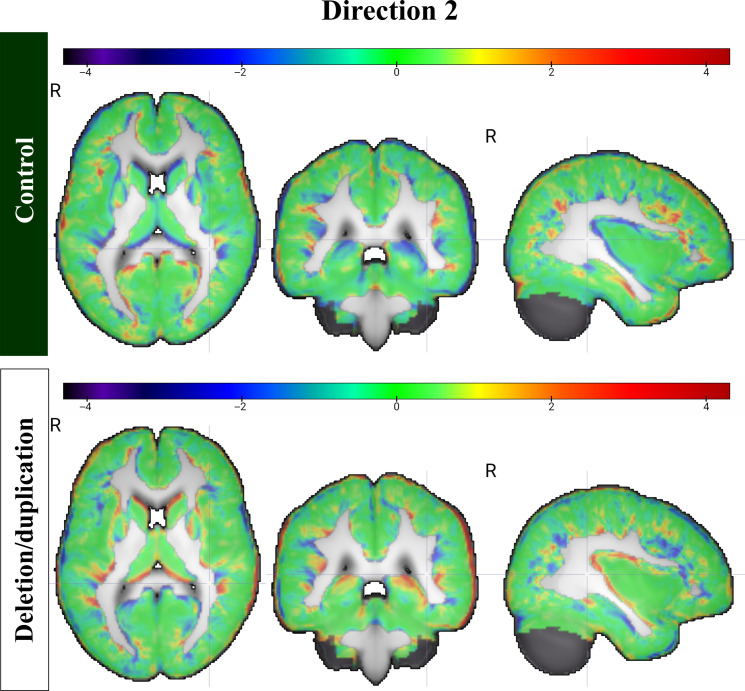
Autism is traditionally diagnosed behaviorally but has a strong genetic basis. A genetics-first approach could transform understanding and treatment of autism. However, isolating the gene-brain-behavior relationship from confounding sources of variability is a challenge. We demonstrate a novel technique, 3D transport-based morphometry (TBM), to extract the structural brain changes linked to genetic copy number variation (CNV) at the 16p11.2 region. We identified two distinct endophenotypes. In data from the Simons Variation in Individuals Project, detection of these endophenotypes enabled 89 to 95% test accuracy in predicting 16p11.2 CNV from brain images alone. Then, TBM enabled direct visualization of the endophenotypes driving accurate prediction, revealing dose-dependent brain changes among deletion and duplication carriers. These endophenotypes are sensitive to articulation disorders and explain a portion of the intelligence quotient variability. Genetic stratification combined with TBM could reveal new brain endophenotypes in many neurodevelopmental disorders, accelerating precision medicine, and understanding of human neurodiversity.
Figures
Similar articles
-
Motor difficulties in 16p11.2 copy number variation.Autism Res. 2024 May;17(5):906-916. doi: 10.1002/aur.3132. Epub 2024 Apr 25. Autism Res. 2024. PMID: 38660979
-
Differently different?: A commentary on the emerging social cognitive neuroscience of female autism.Biol Sex Differ. 2024 Jun 13;15(1):49. doi: 10.1186/s13293-024-00621-3. Biol Sex Differ. 2024. PMID: 38872228 Free PMC article. Review.
-
Memantine for autism spectrum disorder.Cochrane Database Syst Rev. 2022 Aug 25;8(8):CD013845. doi: 10.1002/14651858.CD013845.pub2. Cochrane Database Syst Rev. 2022. PMID: 36006807 Free PMC article.
-
Magnetic resonance perfusion for differentiating low-grade from high-grade gliomas at first presentation.Cochrane Database Syst Rev. 2018 Jan 22;1(1):CD011551. doi: 10.1002/14651858.CD011551.pub2. Cochrane Database Syst Rev. 2018. PMID: 29357120 Free PMC article.
-
Lessons Learned From Neuroimaging Studies of Copy Number Variants: A Systematic Review.Biol Psychiatry. 2021 Nov 1;90(9):596-610. doi: 10.1016/j.biopsych.2021.05.028. Epub 2021 Jun 15. Biol Psychiatry. 2021. PMID: 34509290
Cited by
-
The MED13L Foundation strategic research plan: a roadmap to the future.Ther Adv Rare Dis. 2024 Nov 28;5:26330040241290252. doi: 10.1177/26330040241290252. eCollection 2024 Jan-Dec. Ther Adv Rare Dis. 2024. PMID: 39619418 Free PMC article.
-
HERVs Endophenotype in Autism Spectrum Disorder: Human Endogenous Retroviruses, Specific Immunoreactivity, and Disease Association in Different Family Members.Microorganisms. 2024 Dec 24;13(1):9. doi: 10.3390/microorganisms13010009. Microorganisms. 2024. PMID: 39858776 Free PMC article. Review.
References
-
- American Psychiatric Association, What is autism spectrum disorder?, https://psychiatry.org/patients-families/autism/what-is-autism-spectrum-... (2023). [accessed 18 November 2023].
-
- Binder E. B., Genotype-phenotype predictions in autism: Are we there yet? Am. J. Psychiatry 178, 11–12 (2021). - PubMed
-
- A. Speaks, Should I or we have genetic testing for autism? Expert Opinion (2023).
MeSH terms
Grants and funding
LinkOut - more resources
Full Text Sources
