Integration of transcriptome and machine learning to identify the potential key genes and regulatory networks affecting drip loss in pork
- PMID: 38865489
- PMCID: PMC11214104
- DOI: 10.1093/jas/skae164
Integration of transcriptome and machine learning to identify the potential key genes and regulatory networks affecting drip loss in pork
Abstract
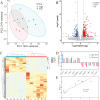
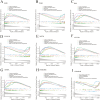
Low level of drip loss (DL) is an important quality characteristic of meat with high economic value. However, the key genes and regulatory networks contributing to DL in pork remain largely unknown. To accurately identify the key genes affecting DL in muscles postmortem, 12 Duroc × (Landrace × Yorkshire) pigs with extremely high (n = 6, H group) and low (n = 6, L group) DL at both 24 and 48 h postmortem were selected for transcriptome sequencing. The analysis of differentially expressed genes and weighted gene co-expression network analysis (WGCNA) were performed to find the overlapping genes using the transcriptome data, and functional enrichment and protein-protein interaction (PPI) network analysis were conducted using the overlapping genes. Moreover, we used machine learning to identify the key genes and regulatory networks related to DL based on the interactive genes of the PPI network. Finally, nine potential key genes (IRS1, ESR1, HSPA6, INSR, SPOP, MSTN, LGALS4, MYLK2, and FRMD4B) mainly associated with the MAPK signaling pathway, the insulin signaling pathway, and the calcium signaling pathway were identified, and a single-gene set enrichment analysis (GSEA) was performed to further annotate the functions of these potential key genes. The GSEA results showed that these genes are mainly related to ubiquitin-mediated proteolysis and oxidative reactions. Taken together, our results indicate that the potential key genes influencing DL are mainly related to insulin signaling mediated differences in glycolysis and ubiquitin-mediated changes in muscle structure and improve the understanding of gene expression and regulation related to DL and contribute to future molecular breeding for improving pork quality.
Keywords: RNA-seq; WGCNA; drip loss; machine learning; meat quality; single-gene GSEA.
Plain language summary
A low level of drip loss (DL) is critical for the economic value of pork. However, the genetic basis underlying DL remains unclear. In this study, pigs with extremely high and low DL at both 24 and 48 h postmortem were selected, and total RNA from longissimus dorsi (LD) muscles was extracted for transcriptome sequencing. Subsequently, a variety of analytical methods, were integrated to identify the potential key genes and pathways affecting DL. As a result, nine potential key genes (IRS1, ESR1, HSPA6, INSR, SPOP, MSTN, LGALS4, MYLK2, and FRMD4B) mainly associated with the MAPK signaling pathway, insulin signaling pathway, and calcium signaling pathway, were identified, and these genes are primarily related to ubiquitin-mediated proteolysis and oxidation reactions. This study contributes new evidence for elucidating the molecular mechanism of DL and provides potential target genes for precise genetic improvement of DL.
© The Author(s) 2024. Published by Oxford University Press on behalf of the American Society of Animal Science. All rights reserved. For commercial re-use, please contact reprints@oup.com for reprints and translation rights for reprints. All other permissions can be obtained through our RightsLink service via the Permissions link on the article page on our site—for further information please contact journals.permissions@oup.com.
Conflict of interest statement
The authors declare that they have no known competing financial interests or personal relationships that could have appeared to influence the work reported in this paper.
Figures


Similar articles
-
Weighted gene co-expression network analysis reveals potential candidate genes affecting drip loss in pork.Anim Genet. 2020 Dec;51(6):855-865. doi: 10.1111/age.13006. Epub 2020 Sep 28. Anim Genet. 2020. PMID: 32986257
-
Comparative gene expression profiling of muscle reveals potential candidate genes affecting drip loss in pork.BMC Genet. 2019 Dec 2;20(1):89. doi: 10.1186/s12863-019-0794-0. BMC Genet. 2019. PMID: 31791257 Free PMC article.
-
Transcriptome analysis of differential gene expression in the longissimus dorsi muscle from Debao and landrace pigs based on RNA-sequencing.Biosci Rep. 2019 Dec 20;39(12):BSR20192144. doi: 10.1042/BSR20192144. Biosci Rep. 2019. PMID: 31755521 Free PMC article.
-
RNA-seq analysis reveals new candidate genes for drip loss in a Pietrain × Duroc × Landrace × Yorkshire population.Anim Genet. 2016 Apr;47(2):192-9. doi: 10.1111/age.12401. Epub 2016 Feb 13. Anim Genet. 2016. PMID: 26873330
-
Construction of circRNA-related ceRNA networks in longissimus dorsi muscle of Queshan Black and Large White pigs.Mol Genet Genomics. 2022 Jan;297(1):101-112. doi: 10.1007/s00438-021-01836-4. Epub 2021 Nov 18. Mol Genet Genomics. 2022. PMID: 34792645
Cited by
-
Identification of new candidate genes affecting drip loss in pigs based on genomics and transcriptomics data.J Anim Sci. 2025 Jan 4;103:skaf177. doi: 10.1093/jas/skaf177. J Anim Sci. 2025. PMID: 40485044 Free PMC article.
-
Impact of dietary Alpinia Katsumadai extracts on production performance, meat quality, and gene expression in AMPK signaling regulatory pathway of Wuzhishan pigs.Front Vet Sci. 2025 Jun 5;12:1563498. doi: 10.3389/fvets.2025.1563498. eCollection 2025. Front Vet Sci. 2025. PMID: 40538725 Free PMC article.
References
-
- Barreto-Andrade, J. N., de Fatima L. A., Campello R. S., Cipriano Guedes J. A., de Freitas H. S., and Ubiratan Fabres Machado M. M. O... 2018. Estrogen receptor 1 (ESR1) enhances Slc2a4/GLUT4 expression by a SP1 cooperative mechanism. Int. J. Med. Sci. 15:1320–1328. doi: 10.7150/ijms.26774 - DOI - PMC - PubMed
-
- Borchers, N., Otto G., and Kalm E... 2007. Genetic relationship of drip loss to further meat quality traits in purebred Pietrains. Arch. Tierz. 50:84–91. doi: 10.5194/aab-50-84-2007 - DOI
MeSH terms
LinkOut - more resources
Full Text Sources
Research Materials
Miscellaneous

